Bitcoin has done it again. It's gone where most critics and quite a few enthusiasts didn't think it would.
The world's most popular cryptocurrency registered an intraday high that broke past $28,000 for the first time, on Sunday, swelling the digital token's market cap by over half a trillion dollars. For perspective, this means the price multiplied by almost seven times since its March trough around the $4K level.
There are some seemingly contradictory explanations for this gargantuan growth: amateur investors and institutions.
Under normal market conditions, retail investor participation increases as the media pumps out positive news after a rally. These amateur investors buy the asset from institutional investors, often referred to as smart money, who already drove up the market as far as they believe it could or should go.
When the public runs out of cash and are unable to keep bidding prices up a vacuum in demand develops. On the other side, supply has increased because of sophisticated investors who want out. That causes a decline.
When amateur buyers, who entered the fray under the impression they'd make some quick and easy riches are disappointed by this initial decline, they begin selling, deepening the decline. The pace of professional selling then quickens, creating a vicious cycle, leading to a correction, if not an outright crash.
When all the sellers are out and the market is on the floor, the same smart money that sold at the top comes back for easy pickings and the opporutnity to enjoy another rally to the top, only to sellout again to the same, unsuspecting public for another, similar ride.
However, those dynamics are what make up a normal market. Bitcoin is anything but a normal market.
For one, Wall Street institutions had little to do with its ascent. Rather enthusiasts and wealthy individuals were the primary drivers.
While that makes the case for ongoing rallies, the participation of level-headed, traditional investors tends to be gradual, and the recent spikes: 11% last week, 38% over the last two weeks or 148% since October is likely to give investors—who are accustomed to caution and a search for value—pause.
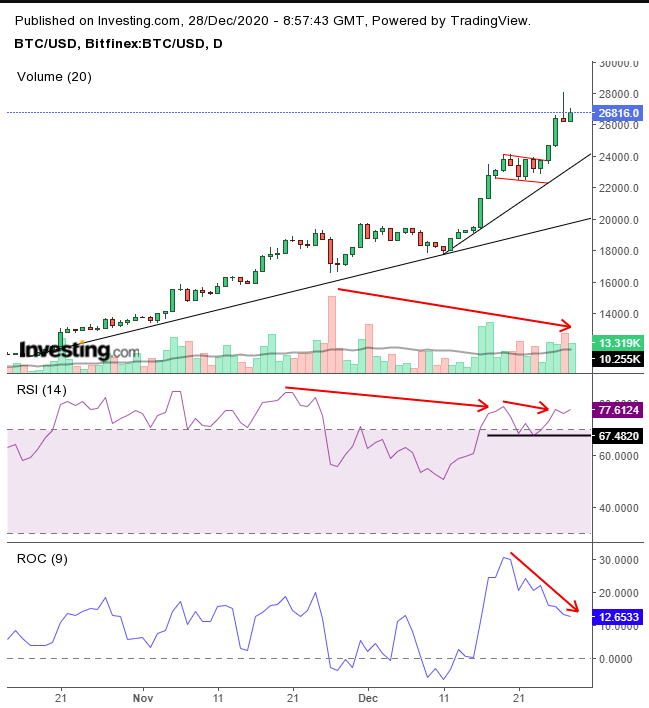
That’s also why, though we believe the cryptocurrency has more room to run, we would prefer a pullback before buying in. We think the technical chart makes the same case:

After Sunday’s intraday high achieved most of the flag’s implied target, the price wiped out all of yesterday’s gains and even posted a decline. This pattern produced a shooting star whose session high forms a looming shadow, revealing a bearish footprint.
While the price surged almost 70% from the November low, volume has been falling, demonstrating dwindling participation. After reaching the extreme overbought condition of 83 in November, the RSI provided back-to-back negative divergences, demonstrating that momentum does not support the price. And the RSI may be about to produce a double top.
The ROC, a different formula for measuring momentum, did not support the flag’s breakout, providing instead its own negative divergence.
After leaping from $18,000 to $28,000 in just two bounds, we’d prefer to see the price return to a sustainable incline, before we'd go back in. Aggressive traders might even enter a contrarian, short position.
Trading Strategies
Conservative traders would patiently wait for Bitcoin’s potential return, at least toward its uptrend line since the Oct.17 low of $11,325, which currently coincides with the Nov. 30 highs of $20,000.
Moderate traders would wait to find support above the flag, above $24.000
Aggressive traders might short, knowing they are entering a contrarian position, trading against the uptrend. They'd write a plan accordingly.
Here’s an example:
Trade Sample
- Entry: $27,000
- Stop-Loss: $28,000
- Risk: $1,000
- Target: $24,000
- Reward: $3,000
- Risk:Reward Ratio: 1:3
