Texas Roadhouse earnings missed by $0.05, revenue topped estimates

Introduction & Market Context
Blue Owl Capital Inc. (NYSE:OWL) released its second quarter 2025 earnings presentation on July 31, revealing record fundraising that propelled significant assets under management (AUM) growth, despite a decline in GAAP net income. The alternative asset manager’s stock closed at $19.51 on July 30, down 1.71% ahead of the earnings release, and has traded between $14.55 and $26.73 over the past 52 weeks.
The company’s presentation highlighted its continued momentum across business segments, with particularly strong performance in fundraising and fee-related earnings, while maintaining its 17-quarter streak of sequential management fee growth. These results come after Blue Owl’s Q1 2025 earnings showed mixed performance, with revenue beating expectations but earnings per share falling short of forecasts.
Quarterly Performance Highlights
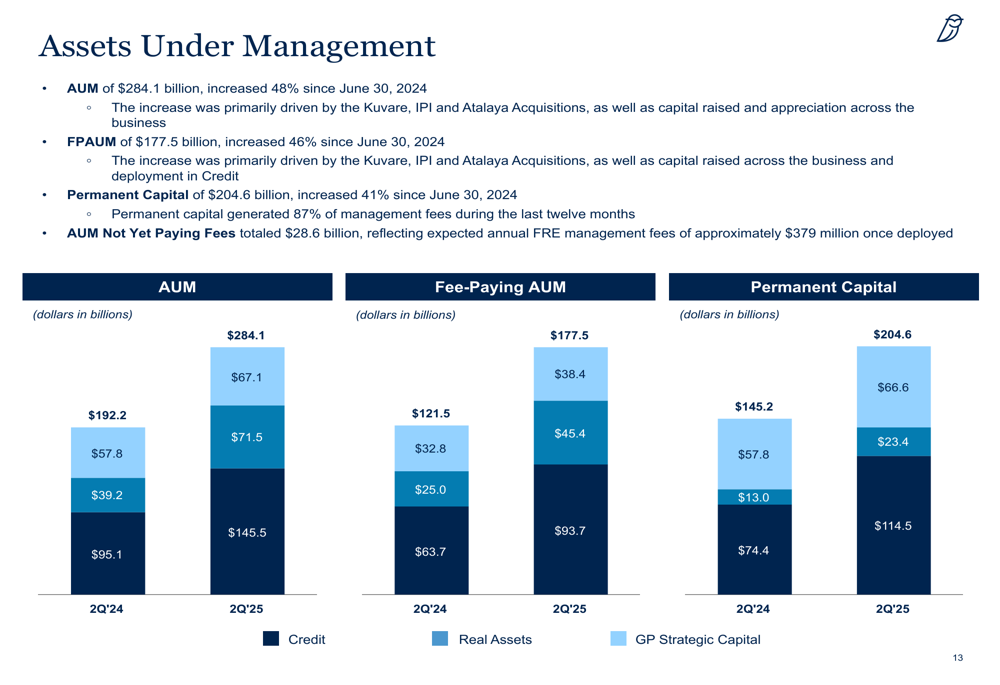
Blue Owl reported total assets under management of $284.1 billion as of June 30, 2025, representing a 48% increase year-over-year. Fee-paying AUM grew 46% to $177.5 billion, while permanent capital reached $204.6 billion, up 41% from the prior year.
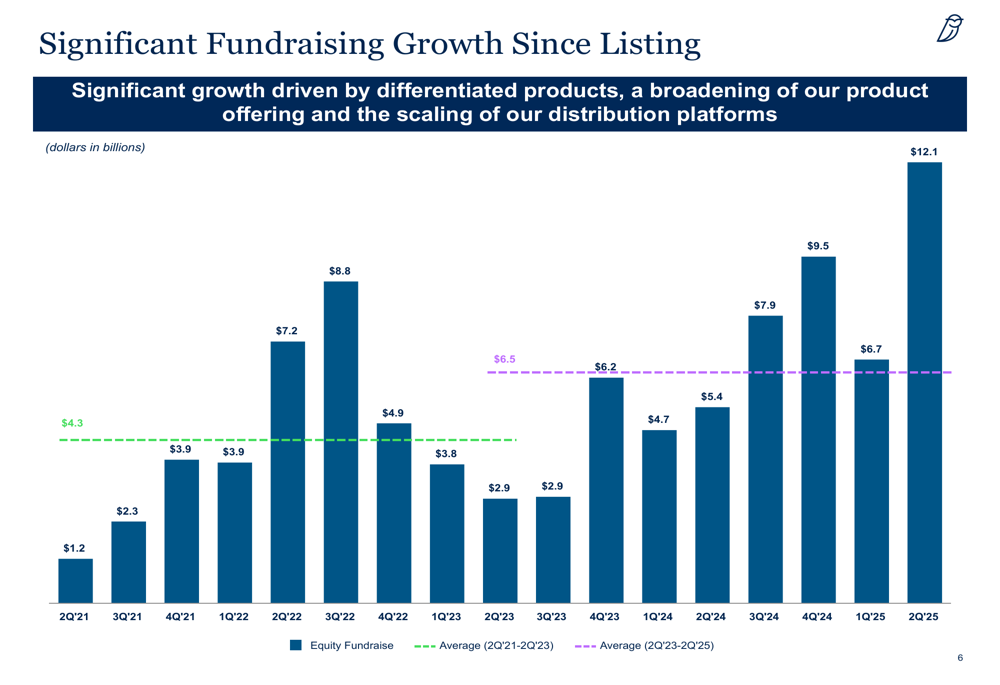
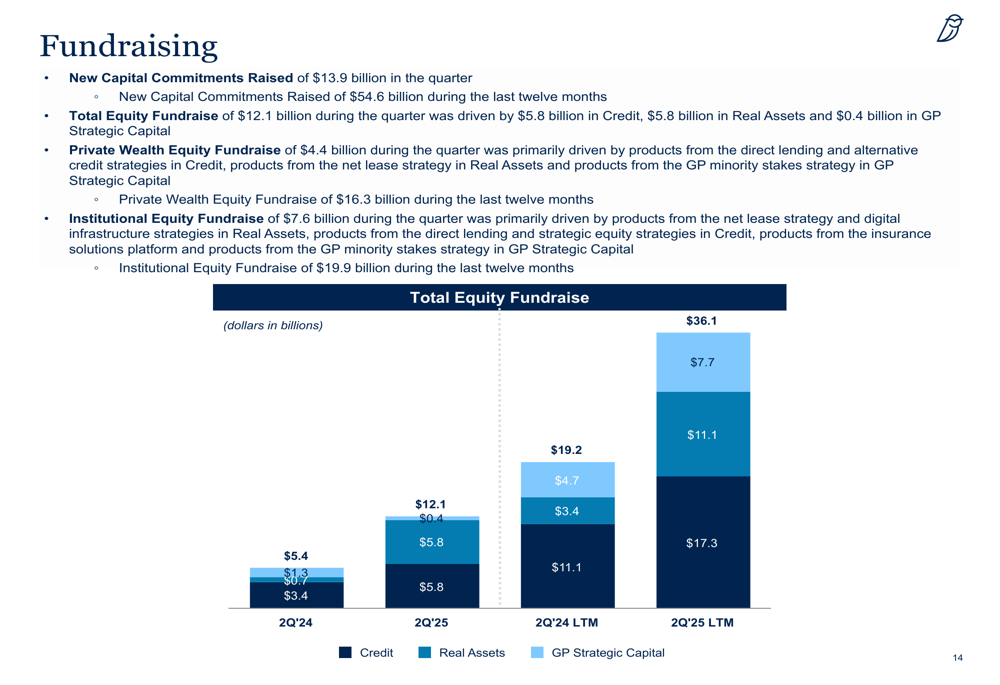
The company achieved a record quarter of capital raising, with $12.1 billion in new equity capital commitments. This fundraising success was broad-based across the firm’s platforms, with particularly strong contributions from both Credit and Real Assets segments.
As shown in the following chart of Blue Owl’s fundraising growth since its public listing, the company has demonstrated a significant upward trajectory, with Q2 2025 representing its strongest fundraising quarter to date:
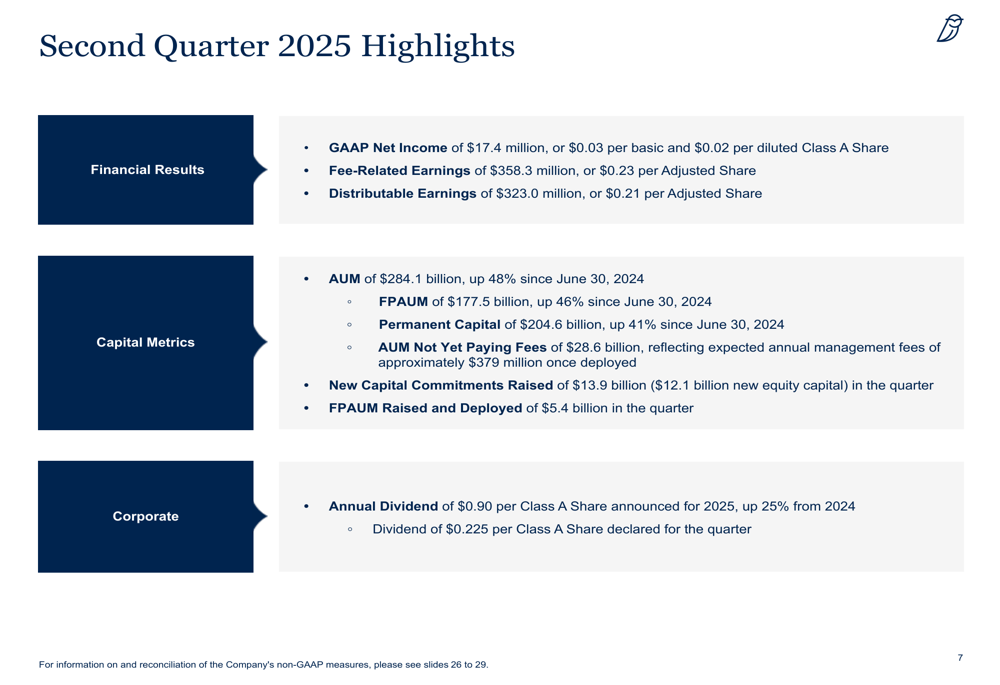
GAAP revenues for Q2 2025 reached $703.1 million, a 28% increase from $549.8 million in Q2 2024. However, GAAP net income attributable to Blue Owl Capital Inc. decreased to $17.4 million, down 49% from $33.9 million in the prior year period. This resulted in earnings of $0.03 per basic and $0.02 per diluted Class A Share.
The company’s non-GAAP metrics showed more positive results, with fee-related earnings (FRE) of $358.3 million ($0.23 per adjusted share) and distributable earnings of $323.0 million ($0.21 per adjusted share), representing increases of 21% and 18% year-over-year, respectively.
Blue Owl’s board declared a quarterly dividend of $0.225 per Class A Share and announced an annual dividend of $0.90 per share for 2025, representing a 25% increase from 2024.
The following slide summarizes the key financial and operational highlights for the quarter:
Detailed Financial Analysis
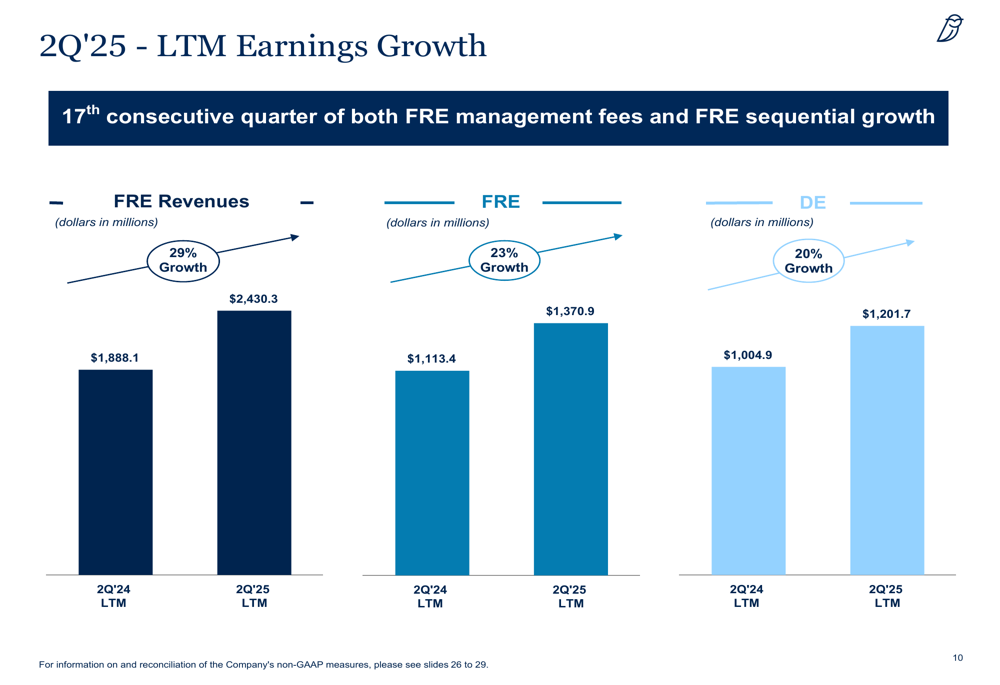
Blue Owl’s presentation emphasized its consistent growth in fee-related earnings, marking the 17th consecutive quarter of sequential FRE management fee growth. For the last twelve months ended June 30, 2025, FRE revenues increased 29% to $2.43 billion, while FRE grew 23% to $1.37 billion and distributable earnings rose 20% to $1.20 billion.
The company’s earnings growth is illustrated in the following chart:
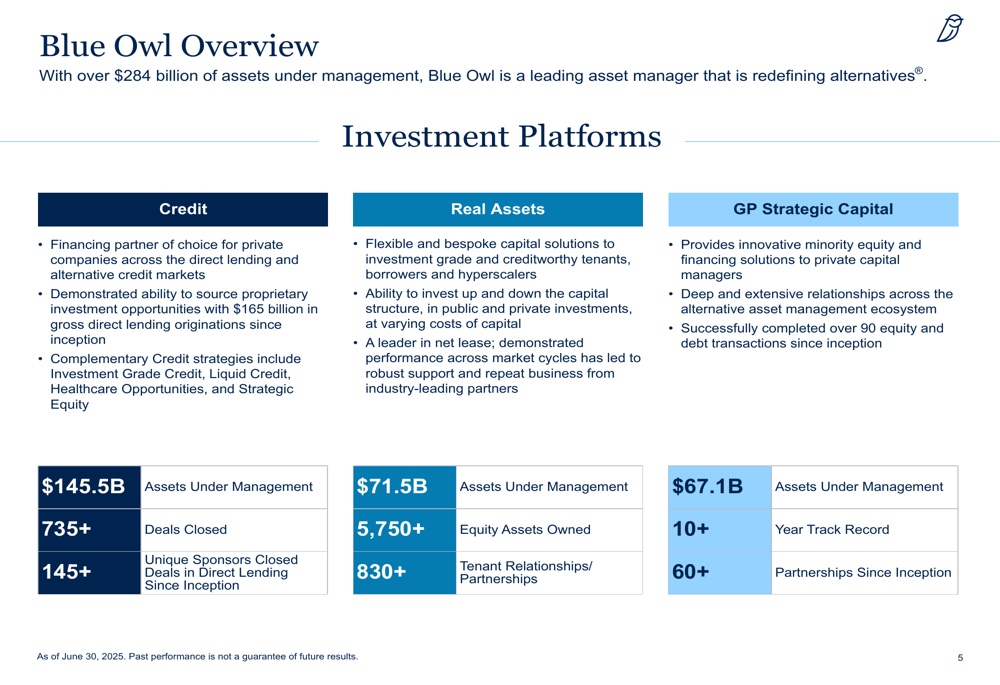
Across its three investment platforms, Blue Owl demonstrated strong AUM growth:
1. Credit Platform: AUM increased 53% year-over-year to $145.5 billion
2. Real Assets Platform: AUM grew 82% to $71.5 billion
3. GP Strategic Capital Platform: AUM rose 16% to $67.1 billion
The breakdown of AUM across these platforms is shown in the following chart:
The company’s fundraising success was particularly notable in the Credit and Real Assets platforms during Q2 2025, with each raising $5.8 billion in equity capital. For the last twelve months, Blue Owl raised a total of $36.1 billion across all platforms, with Credit leading at $17.3 billion, followed by Real Assets at $11.1 billion and GP Strategic Capital at $7.7 billion.
The following chart details the company’s fundraising performance:
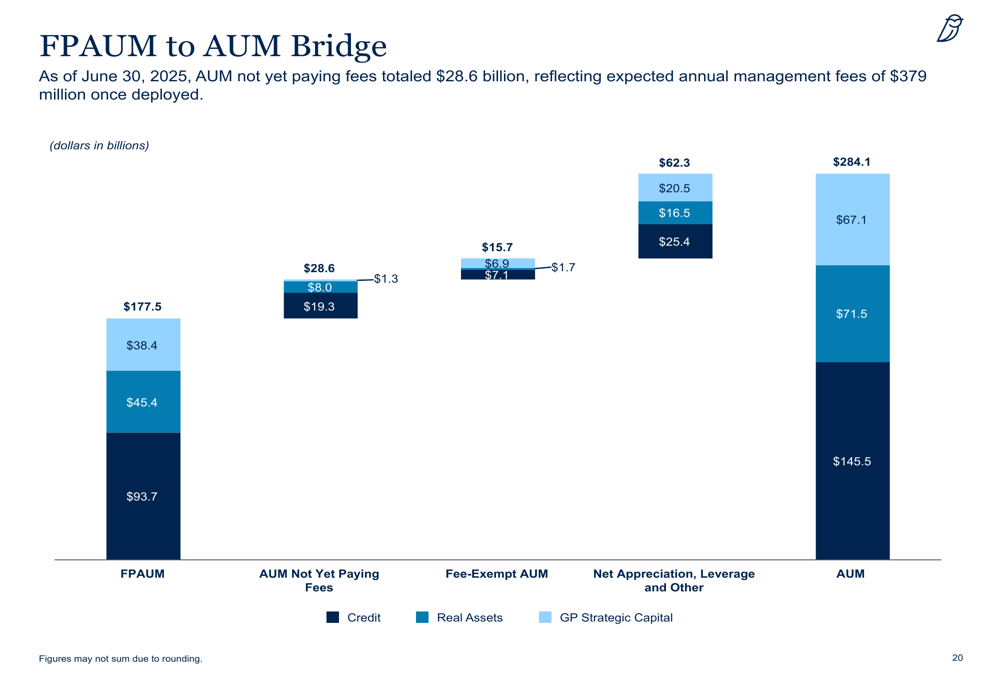
Blue Owl also highlighted its pipeline of future management fees, with $28.6 billion of AUM not yet paying fees as of June 30, 2025. This represents expected annual management fees of approximately $379 million once deployed, providing visibility into future revenue growth.
The relationship between fee-paying AUM and total AUM is illustrated in this bridge chart:
Strategic Initiatives
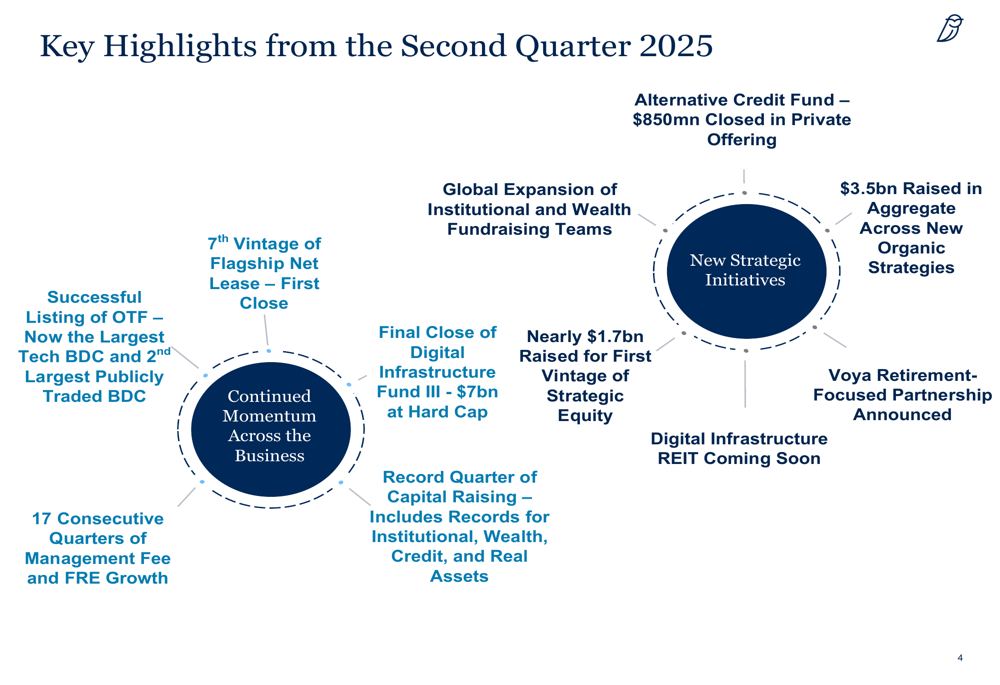
Blue Owl’s presentation highlighted several strategic initiatives that contributed to its strong fundraising and AUM growth during the quarter. The company emphasized its continued momentum across all business segments, with particular success in expanding its product offerings and distribution capabilities.
Key strategic developments included:
1. The successful listing of OTF, which is now the largest Tech BDC and second-largest publicly traded BDC
2. The final close of Digital Infrastructure Fund III at $7 billion, reaching its hard cap
3. The first close of the 7th vintage of its flagship Net Lease fund
4. Nearly $1.7 billion raised for the first vintage of Strategic Equity
5. A retirement-focused partnership announced with Voya
6. Global expansion of institutional and wealth fundraising teams
7. $3.5 billion raised across new organic strategies
These initiatives are summarized in the following key highlights slide:
The company also provided an overview of its three investment platforms, highlighting their scale and market positioning:
Forward-Looking Statements
Looking ahead, Blue Owl appears well-positioned for continued growth, with significant dry powder in the form of AUM not yet paying fees. The company’s strong fundraising momentum and consistent FRE growth suggest potential for further expansion, particularly in its rapidly growing Real Assets platform.
The company maintains solid liquidity with $1.1 billion available and a well-structured debt profile with an average maturity of approximately 10 years and a cost of debt of 3.8%. Blue Owl’s investment-grade credit ratings (BBB+ from Fitch, Baa2 from Moody’s, and BBB from S&P) provide flexibility for future capital raises and strategic initiatives.
While Blue Owl’s presentation emphasized its strong fundraising and AUM growth, investors should note the divergence between growing non-GAAP earnings metrics and declining GAAP net income. This pattern continues from Q1 2025, when the company missed EPS forecasts despite beating revenue expectations.
The 25% increase in annual dividend signals management’s confidence in the sustainability of distributable earnings growth, even as GAAP profitability faces challenges. As Blue Owl continues to execute on its growth strategy, balancing AUM expansion with improved GAAP profitability will likely be a key focus for investors and analysts in the coming quarters.
Full presentation:
This article was generated with the support of AI and reviewed by an editor. For more information see our T&C.