Navitas stock soars as company advances 800V tech for NVIDIA AI platforms

Introduction & Market Context
Asbury Automotive Group (NYSE:ABG) presented its second quarter 2025 investor presentation on July 29, showcasing accelerated revenue growth and strategic portfolio rebalancing initiatives. The automotive retailer’s stock was up 1.75% in premarket trading at $233.20, following a 3.56% decline in the previous session, suggesting investor optimism about the latest quarterly results.
The presentation comes after a mixed first quarter where Asbury beat earnings estimates but missed revenue targets, resulting in a stock price decline. The Q2 results appear to address some of those concerns, with improved performance across multiple segments.
Executive Summary
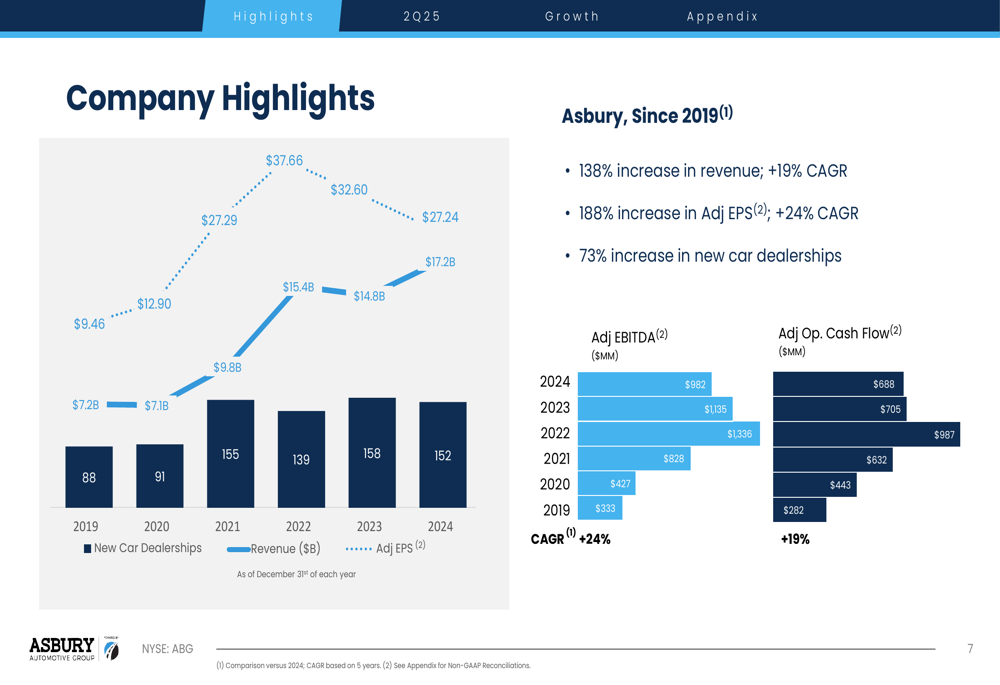
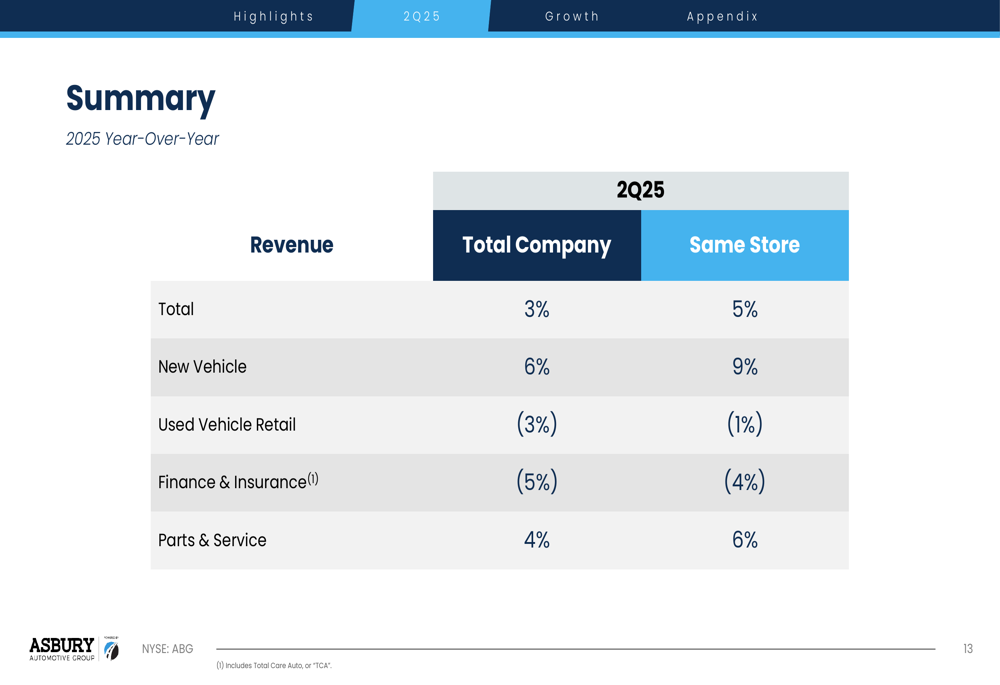
Asbury reported a 3% year-over-year increase in total company revenue for Q2 2025, with same-store revenue growing by 5%. The company has demonstrated consistent long-term growth, with revenue increasing 138% since 2019 (19% CAGR) and adjusted EPS rising 188% (24% CAGR) over the same period.
The company highlighted its ongoing portfolio rebalancing following the acquisition of Herb Chambers Automotive Group, which was mentioned as pending in Q1 earnings reports. This strategic move shifts Asbury’s brand mix toward a more balanced portfolio of luxury, import, and domestic vehicles.
As shown in the following financial performance chart, Asbury has maintained strong growth across key metrics since 2019:
Quarterly Performance Highlights
Asbury’s Q2 2025 performance showed strength in new vehicle sales and parts & service, while used vehicle retail and F&I segments experienced modest declines. New vehicle revenue increased by 6% company-wide and 9% on a same-store basis, outperforming the used vehicle segment which saw declines of 3% and 1% respectively.
The company’s same-store year-over-year performance is illustrated in the following chart:
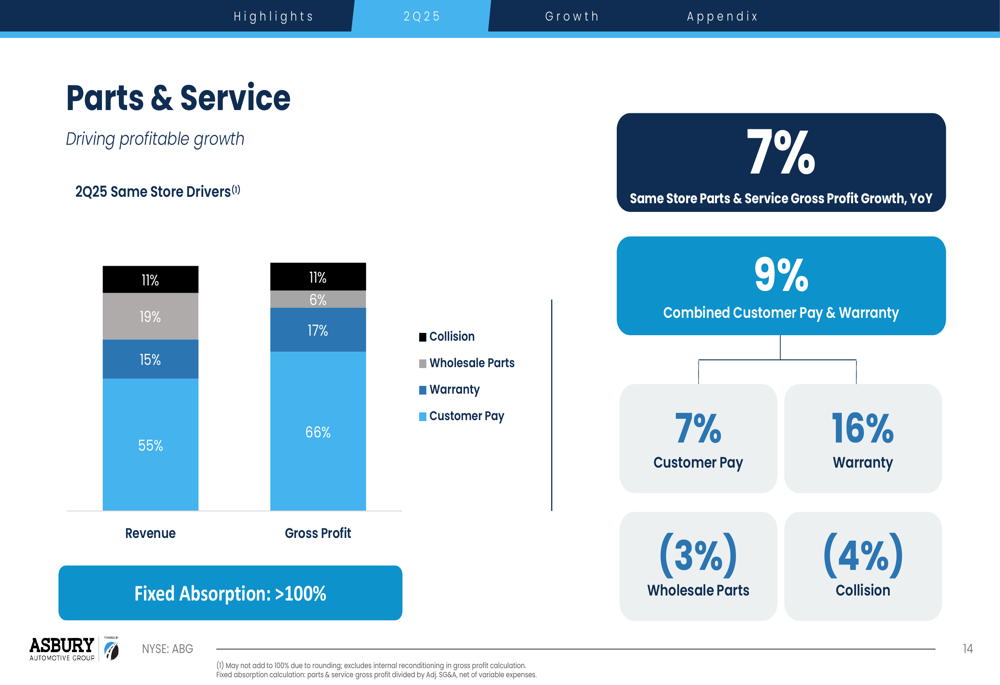
The parts & service segment emerged as a particular bright spot, with same-store gross profit growing 7% year-over-year. Customer pay and warranty work showed strong combined growth of 9%, highlighting the resilience of this high-margin business segment. The company reported fixed absorption exceeding 100%, indicating that service and parts operations more than cover fixed overhead expenses.
The breakdown of parts & service performance is detailed in this chart:
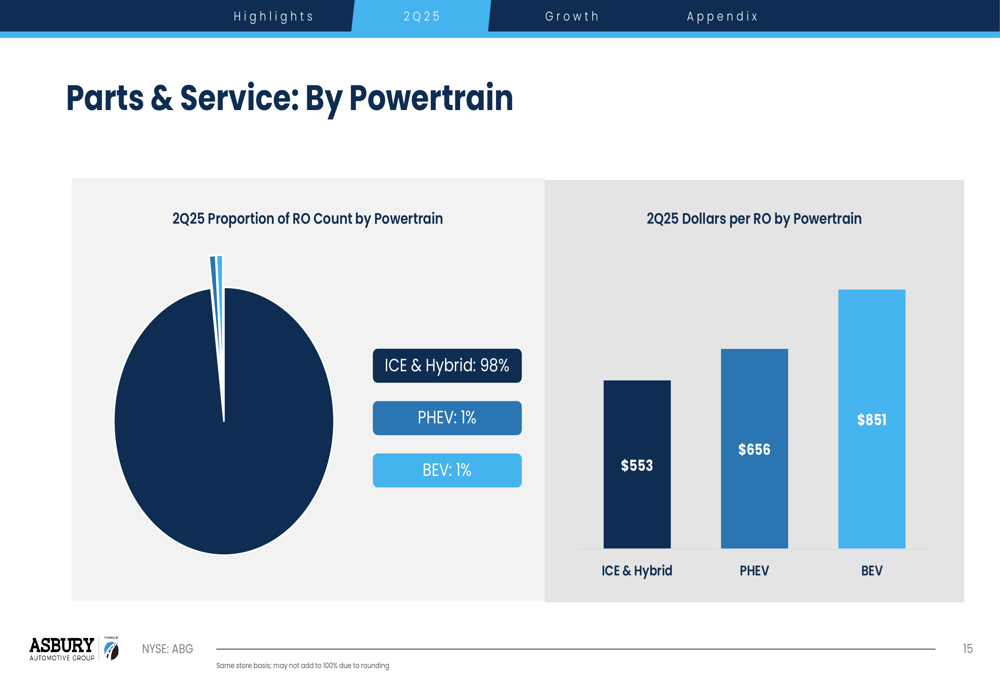
Notably, Asbury provided insights into service revenue by powertrain type, revealing that battery electric vehicles (BEVs) generate significantly higher revenue per repair order ($851) compared to plug-in hybrids ($656) and traditional internal combustion engines and hybrids ($553). This data suggests potential for increased service profitability as EV adoption grows, despite BEVs currently representing only 1% of repair order count.
Strategic Initiatives
A central focus of Asbury’s presentation was its strategic portfolio rebalancing through the acquisition of Herb Chambers Automotive Group. This acquisition, which appears to have progressed from "pending" status mentioned in Q1 earnings, significantly impacts Asbury’s brand mix.
The following chart illustrates how the acquisition reshapes Asbury’s portfolio composition:
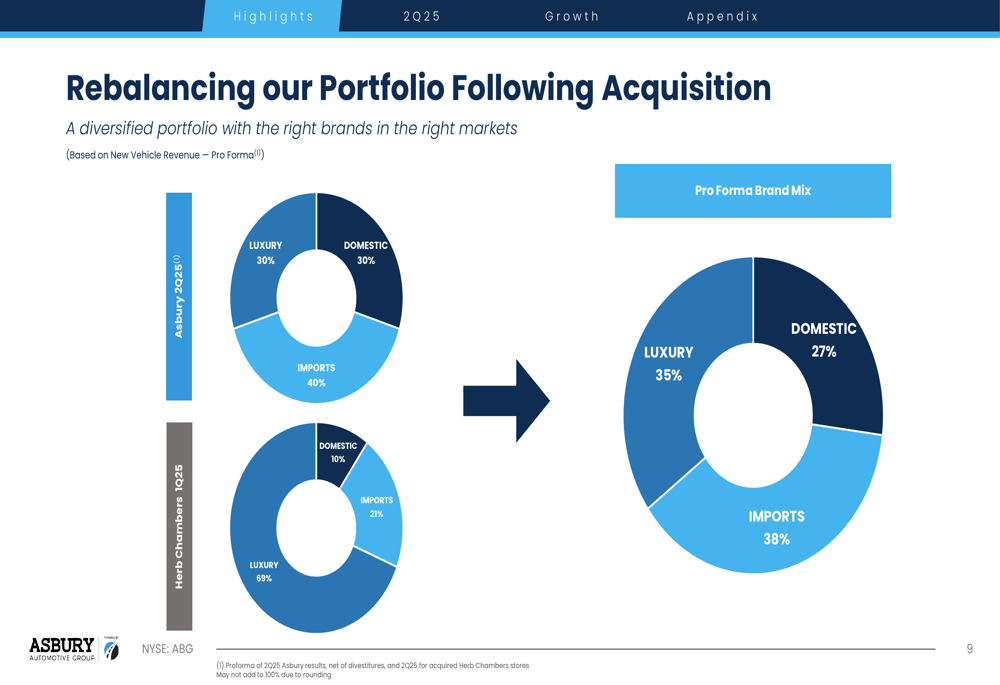
Post-acquisition, Asbury’s revenue mix is more balanced with luxury brands comprising 35%, import brands 38%, and domestic brands 27%. This represents a strategic shift from the previous mix, potentially positioning the company for more stable performance across market segments.
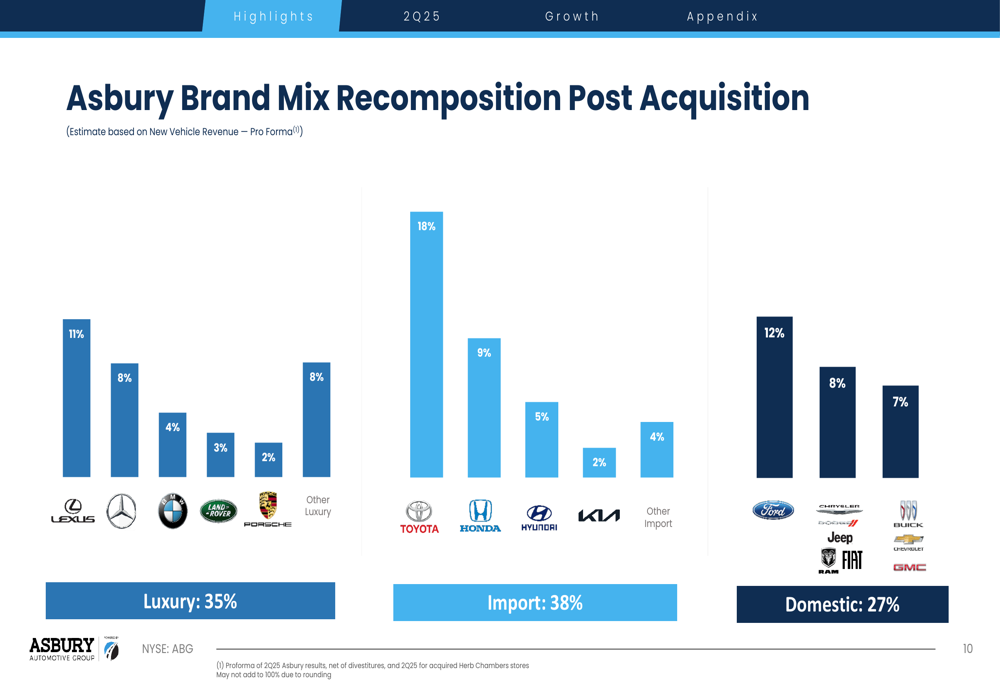
The detailed brand breakdown reveals Toyota (NYSE:TM) (18%), Ford (12%), and Lexus (11%) as the company’s largest brand exposures:
Detailed Financial Analysis
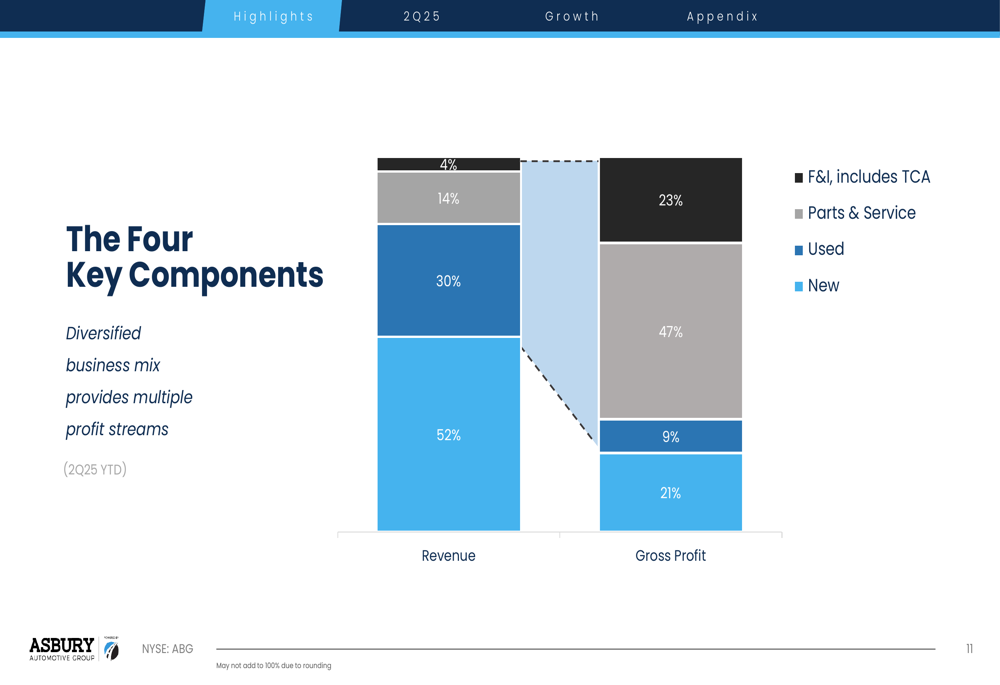
Asbury’s presentation highlighted its diversified business model with multiple revenue and profit streams. While new vehicles represent 52% of revenue, they contribute only 9% to gross profit. Conversely, parts & service accounts for just 14% of revenue but delivers 23% of gross profit, underscoring its importance to overall profitability.
The company’s revenue and gross profit mix is illustrated in this chart:
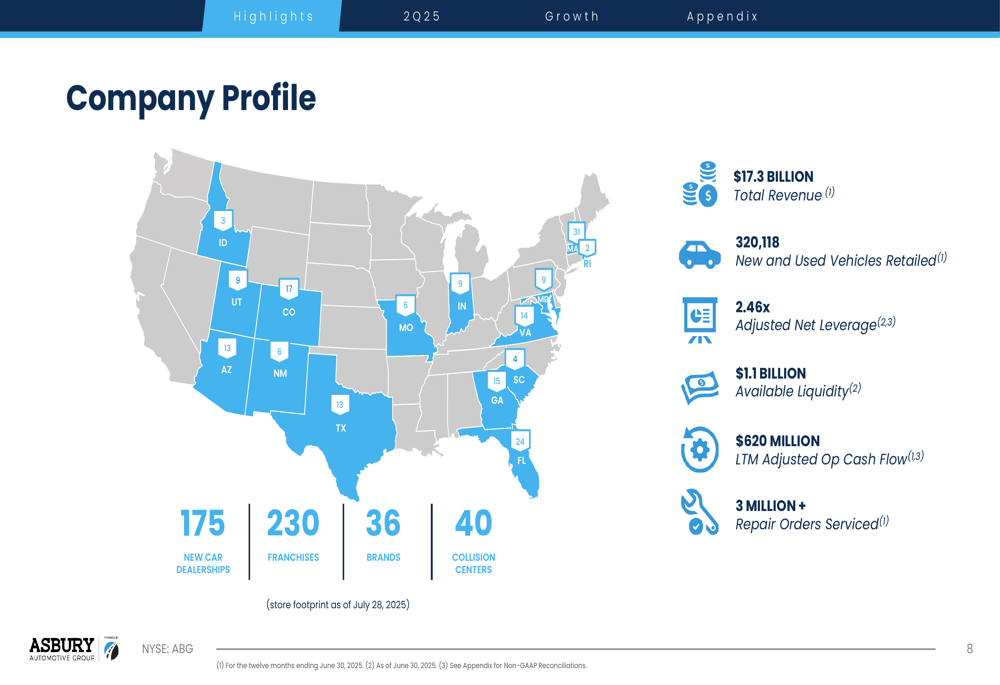
Asbury’s financial position remains strong with $1.1 billion in available liquidity and adjusted net leverage of 2.46x. The company reported $620 million in last twelve months adjusted operating cash flow, providing flexibility for strategic investments and potential shareholder returns.
The company’s geographic footprint spans 16 states with 175 new car dealerships, 230 franchises, 36 brands, and 40 collision centers. This extensive network positions Asbury as a major player in the automotive retail landscape, as shown in the following company profile overview:
Forward-Looking Statements
Looking ahead, Asbury appears well-positioned to continue its growth trajectory, building on its 19% revenue CAGR since 2019. The company’s strategic focus on high-margin segments like parts & service, particularly as electric vehicle adoption increases, could provide additional profit growth opportunities.
The integration of Herb Chambers Automotive Group represents a significant strategic initiative that will likely influence performance in coming quarters. This acquisition aligns with CEO David Hult’s statement from Q1 that "We’re a different company today than we were pre-COVID," reflecting Asbury’s transformation into a more diversified automotive retailer.
While the presentation focused primarily on positive developments, investors should note that used vehicle retail and F&I segments showed year-over-year declines, potentially signaling challenges in these areas. Additionally, the company faces broader industry headwinds including potential tariff impacts, evolving consumer preferences, and regulatory changes affecting the automotive sector.
As Asbury continues to execute its growth strategy and portfolio rebalancing initiatives, investors will be watching closely to see if the improved Q2 performance represents a sustainable trend following the mixed results of Q1 2025.
Full presentation:
This article was generated with the support of AI and reviewed by an editor. For more information see our T&C.