Street Calls of the Week

Introduction & Market Context
Bank of Hawaii Corporation (NYSE:BOH) presented its second-quarter 2025 financial results on July 28, 2025, showcasing continued improvement in profitability metrics despite facing market headwinds. The bank reported diluted earnings per share of $1.06 and net income of $47.6 million, representing growth from the previous quarter’s results.
Despite the positive financial performance, BOH shares declined 4.32% on the day of the presentation, closing at $65.69. The stock had shown some strength in pre-market trading with a 1.48% gain, but sentiment turned negative during the regular session.
Quarterly Performance Highlights
Bank of Hawaii reported several positive financial metrics for Q2 2025, continuing the momentum from the previous quarter. Net interest margin (NIM) expanded for the fifth consecutive quarter, reaching 2.39% from 2.32% in Q1 2025. Return on average common equity increased to 12.50% from 11.80% in the previous quarter.
As shown in the following comprehensive financial summary from the presentation:
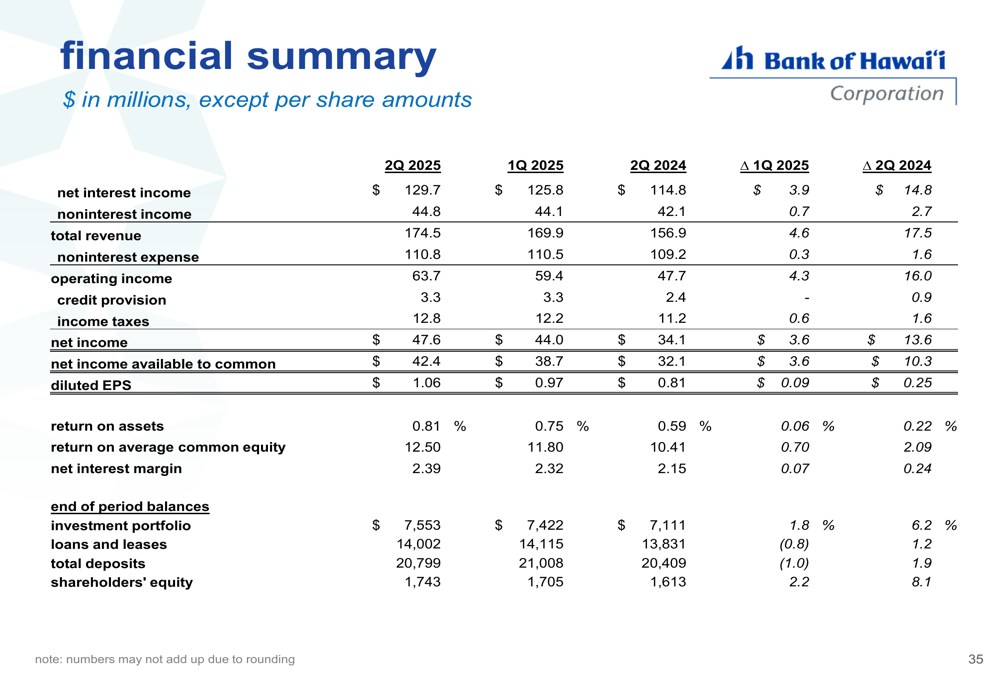
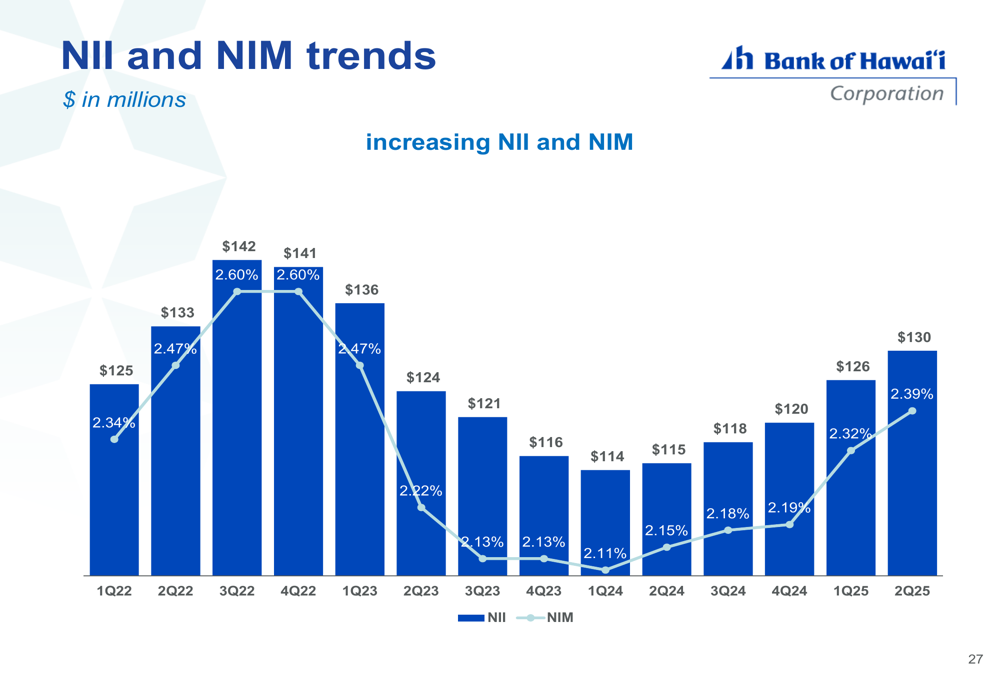
The bank’s net interest income reached $142 million in Q2 2025, showing continued improvement. This growth in NIM and net interest income reflects the bank’s strategic balance sheet management and the beneficial impact of higher interest rates on its loan portfolio.
The following chart illustrates the positive trend in NII and NIM over recent quarters:
Market Position and Business Model
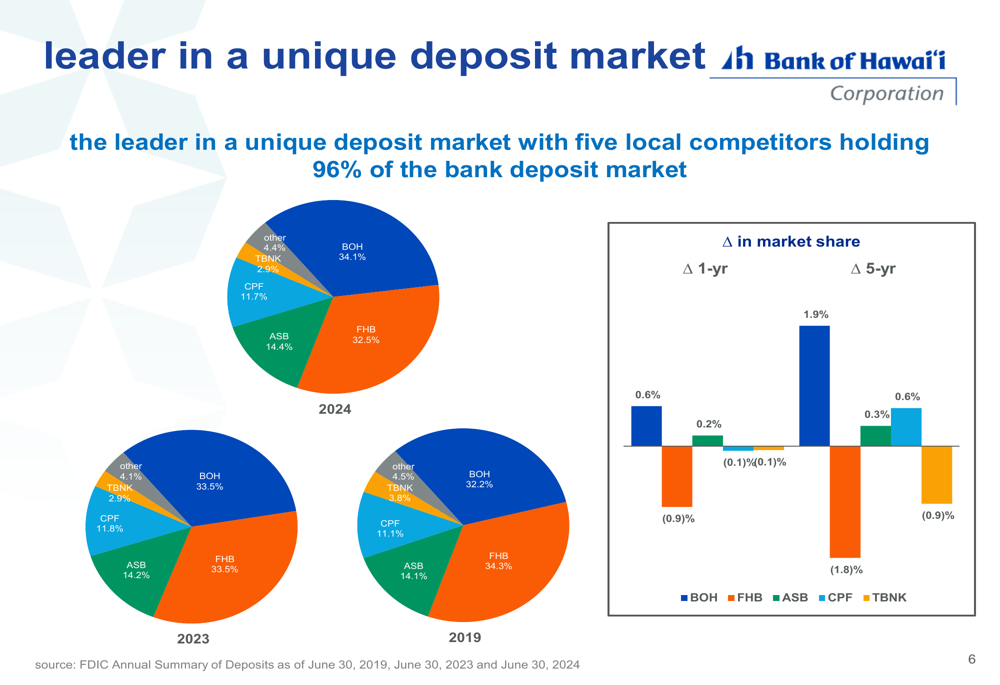
Bank of Hawaii maintains a dominant position in its core market, with approximately 33-34% market share. The bank’s unique business model focuses on three key elements: an attractive core market, dominant market position, and a fortress risk profile, which together deliver superior risk-adjusted returns.
The bank’s brand awareness significantly outpaces its competitors, as illustrated in the following chart showing unaided brand awareness:
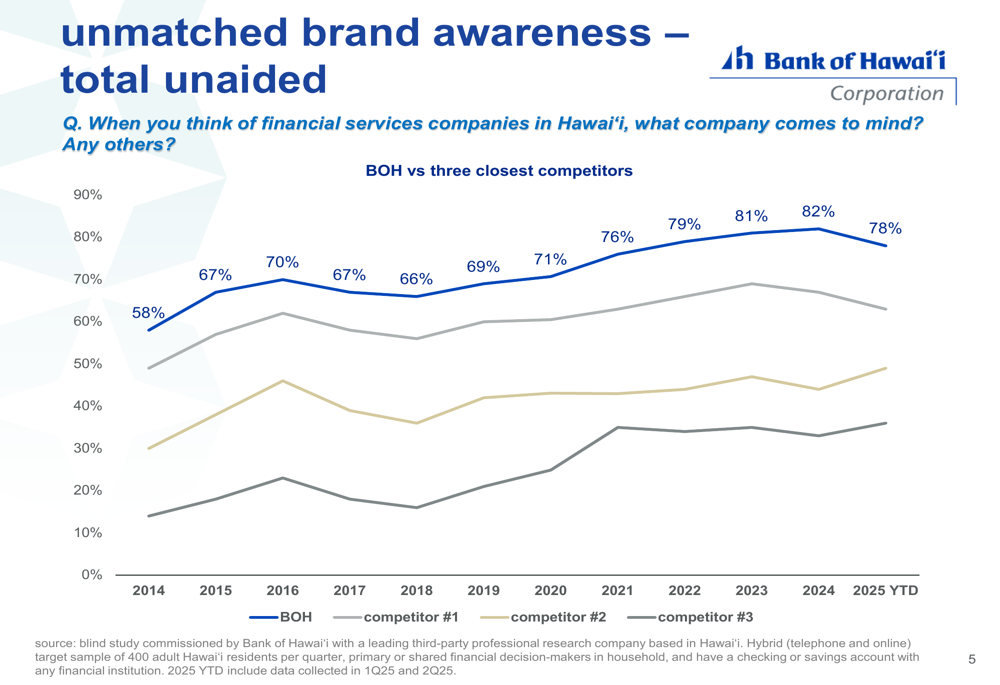
This strong brand recognition contributes to the bank’s leading position in the deposit market. BOH has increased its market share by approximately 0.6% year-over-year and 1.9% over the past five years, as shown in this market share analysis:
Loan Portfolio and Credit Quality
Bank of Hawaii maintains a geographically focused lending strategy, with 93% of its loan portfolio concentrated in Hawaii. This focus on its core market, where the bank has deep expertise, contributes to its strong credit quality metrics.
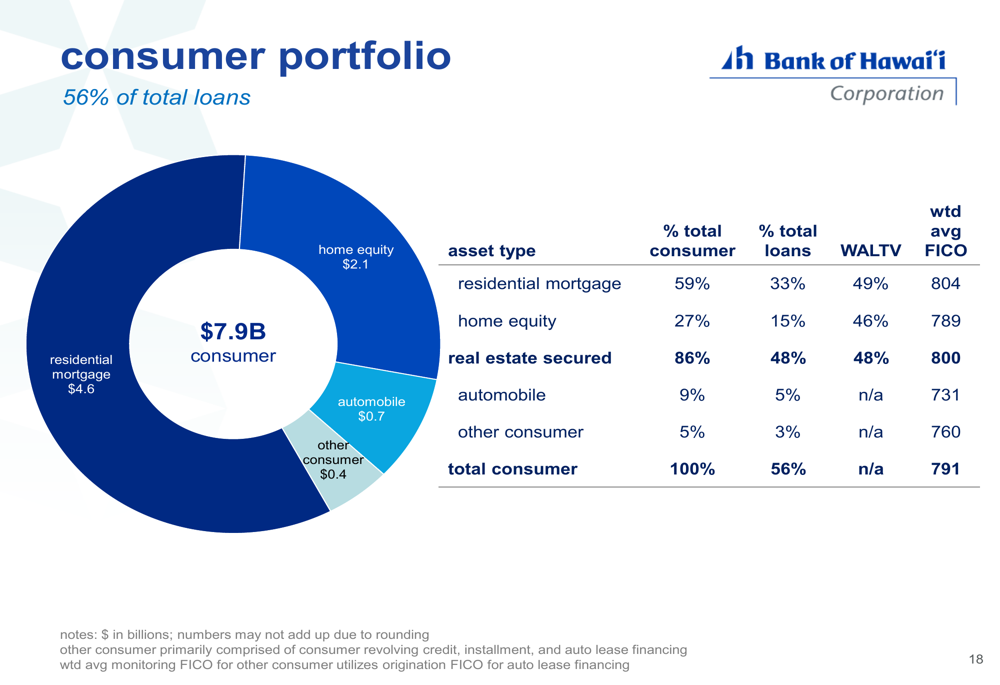
The loan portfolio is well-balanced between consumer and commercial segments. Consumer loans represent 56% of the total portfolio ($7.9 billion), with a significant portion secured by real estate:
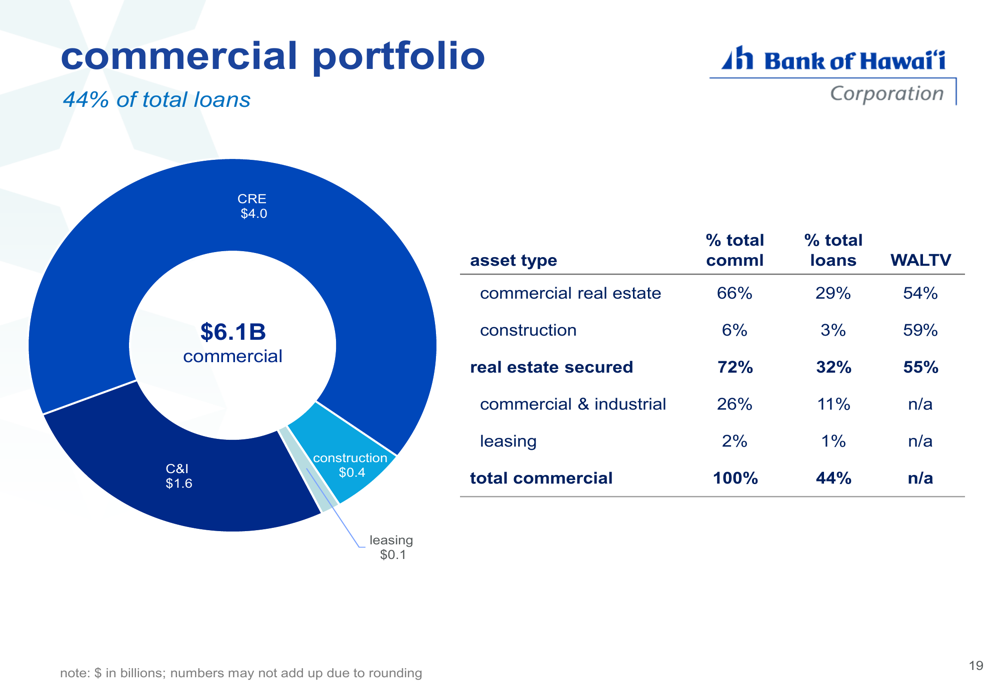
Commercial loans make up the remaining 44% of the portfolio ($6.1 billion), with commercial real estate (CRE) being the largest component:
Credit quality remains exceptionally strong, with a net charge-off rate of just 0.07% and non-performing assets at 0.13%. The loan portfolio is well-secured, with 80% being real estate-backed with a combined weighted average loan-to-value ratio of 51%.
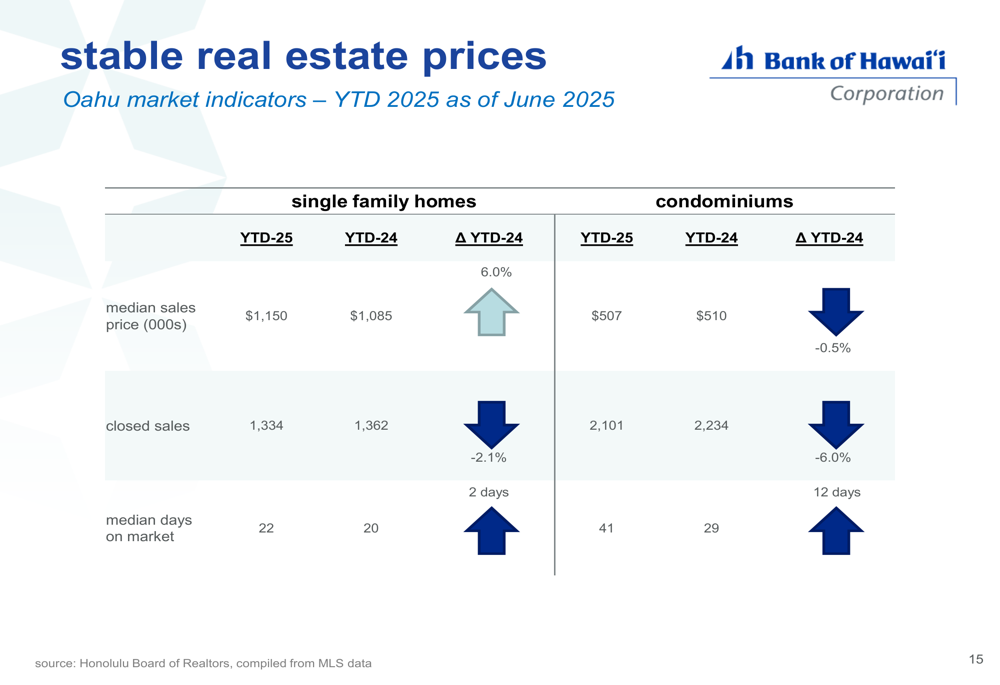
The Oahu real estate market, which underpins much of the bank’s lending, remains stable. Single-family home median sales prices increased 6.0% year-to-date to $1,150,000, while condominium prices decreased slightly by 0.5% to $507,000:
Balance Sheet Management and Capital Position
Bank of Hawaii continues to optimize its balance sheet through strategic management of assets and liabilities. The bank reported $572 million in Q2 2025 loan and investment cash flow, with a 4.0% roll-off rate and a 6.3% roll-on rate, contributing to a quarterly net interest income impact of $3.2 million.
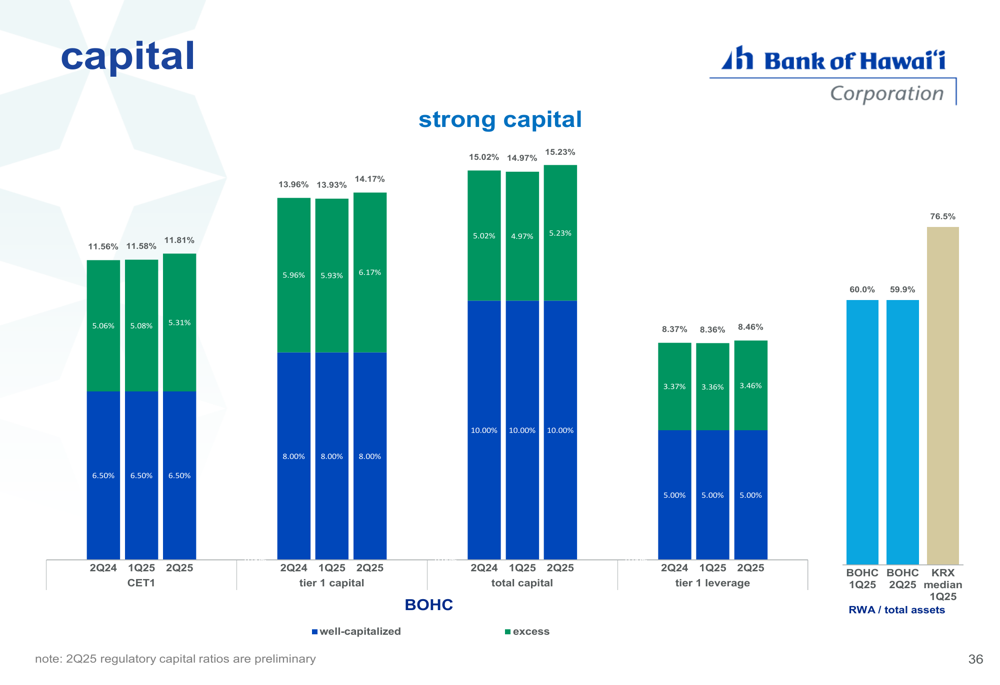
Capital ratios remain strong, with a Tier 1 capital ratio of 14.17% and a total capital ratio of 15.23%. These robust capital levels provide the bank with financial flexibility and a buffer against potential economic challenges.
Forward-Looking Statements
Looking ahead, Bank of Hawaii expects to benefit from continued NIM expansion as its balance sheet reprices at higher rates. The bank’s management highlighted several positive factors supporting this outlook, including the accretive impact of balance sheet remix and stable deposit costs.
However, the bank also faces potential challenges, including a forecasted slight increase in Hawaii’s unemployment rate, which is expected to reach 3.3% by Q4 2025. The bank’s significant exposure to the Hawaiian real estate market also presents both opportunities and risks, though current market indicators suggest stability.
In the presentation’s key takeaways, management emphasized the bank’s continued NII and NIM growth, dominant market position, exceptional credit quality, and strong liquidity and risk-based capital:
Bank of Hawaii’s Q2 2025 results demonstrate the bank’s ability to generate improving financial performance despite market challenges. With its dominant market position, strong brand recognition, and prudent risk management, the bank appears well-positioned to navigate the current economic environment while continuing to deliver value to shareholders.
Full presentation:
This article was generated with the support of AI and reviewed by an editor. For more information see our T&C.