Bitcoin price today: struggles at $111k as trade tensions, risk aversion weigh

Introduction & Market Context
Barclays PLC (LSE:LON:BARC) delivered strong financial results in its Q1 2025 presentation on April 30, 2025, with performance exceeding expectations across most business segments. The bank reported a statutory Return on Tangible Equity (RoTE) of 14.0%, significantly above its 2025 guidance of approximately 11% and even surpassing its 2026 target of over 12%. This continues the positive momentum seen in the previous quarter, when Barclays achieved all its financial targets for 2024.
Quarterly Performance Highlights
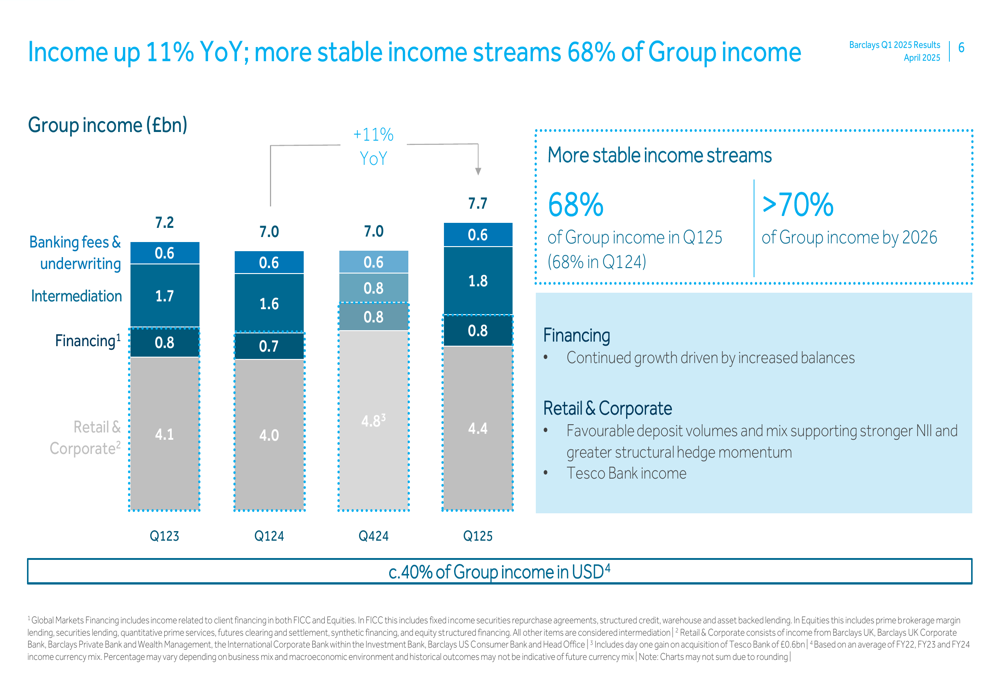
Barclays reported a profit before tax of £2.7 billion in Q1 2025, representing a 19% increase compared to £2.3 billion in Q1 2024. Total (EPA:TTEF) income rose to £7.7 billion, up 11% year-over-year from £7.0 billion. Earnings per share showed even stronger growth, increasing 26% to 13.0p from 10.3p in the same period last year.
As shown in the following chart detailing RoTE and profit before tax analysis, the bank’s performance was driven by strong income growth, partially offset by higher costs and impairment charges:
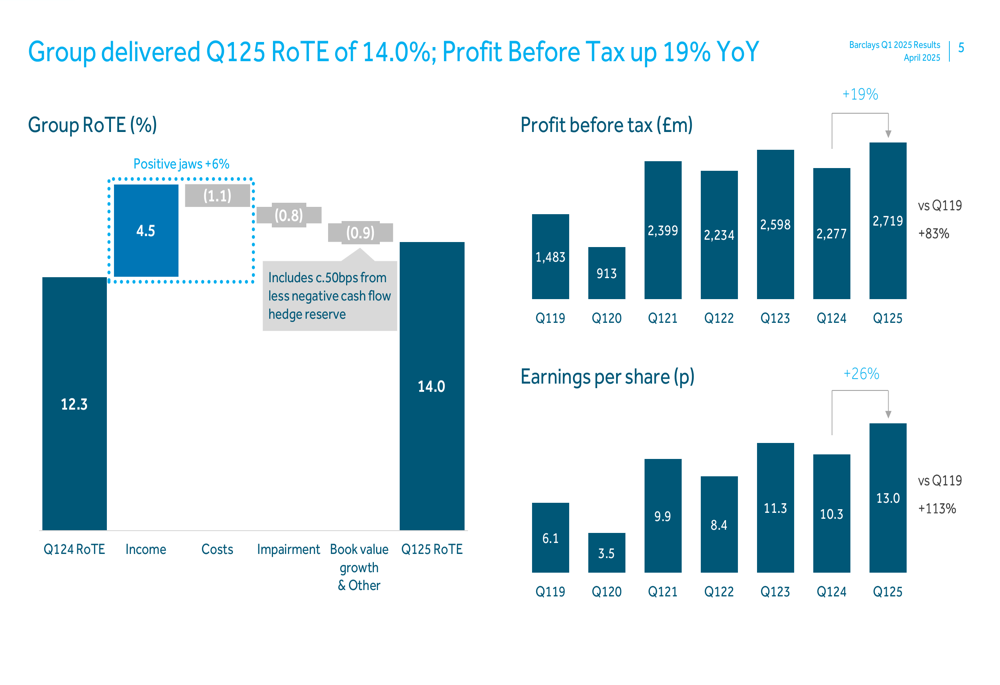
The cost-to-income ratio improved to 57% from 60% in Q1 2024, reflecting the bank’s ongoing efficiency efforts. Barclays has already realized approximately £150 million of the £500 million expected gross cost efficiency savings targeted for FY 2025.
Detailed Financial Analysis
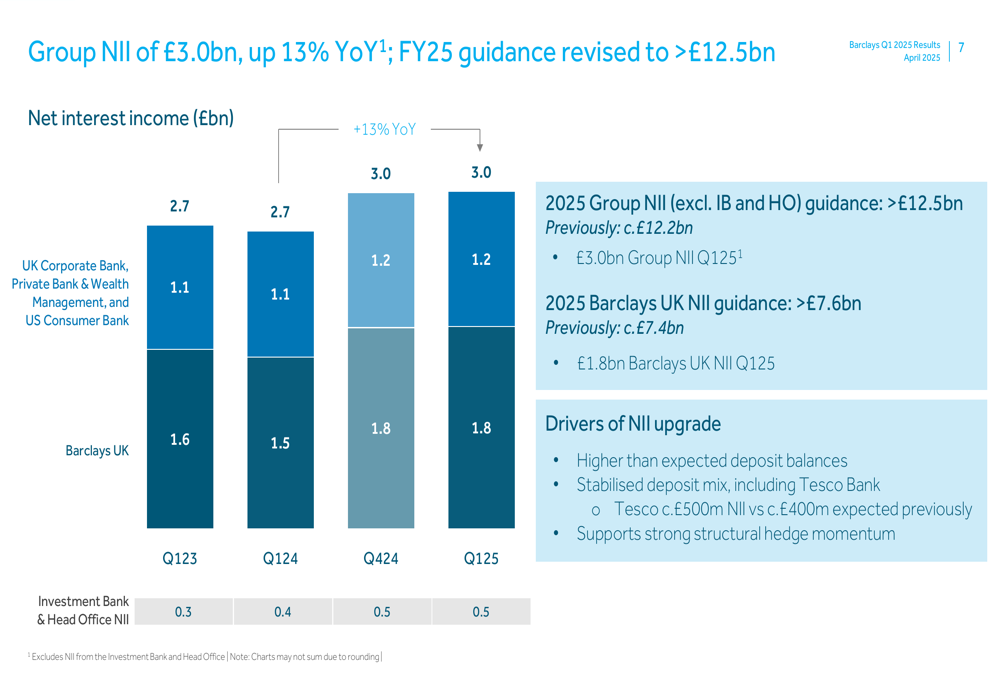
Group Net Interest Income (NII) showed robust growth of 13% year-over-year to £3.0 billion. Based on this strong performance, Barclays has revised its FY 2025 guidance upward to more than £12.5 billion, from the previous estimate of approximately £12.2 billion. Similarly, Barclays UK NII guidance was upgraded to more than £7.6 billion from approximately £7.4 billion previously.
The following chart illustrates the Group NII performance and revised guidance:
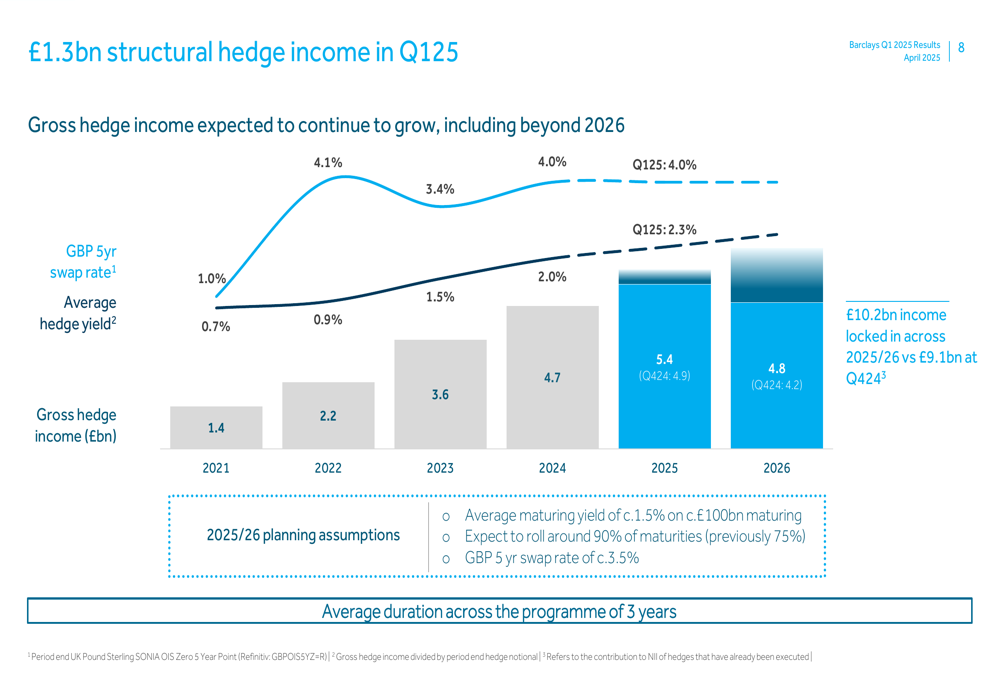
A key driver of the bank’s performance is its structural hedge income, which reached £1.3 billion in Q1 2025. Barclays has locked in £10.2 billion of income across 2025/26, up from £9.1 billion at Q4 2024, providing increased visibility on future earnings.
The structural hedge income and underlying assumptions are detailed in this chart:
The bank’s capital position remained strong, with the CET1 ratio improving to 13.9% from 13.6% at the end of December 2024. Tangible Net Asset Value (TNAV) per share increased to 372p from 357p over the same period.
Business Segment Performance
Most of Barclays’ business segments delivered strong results in Q1 2025:
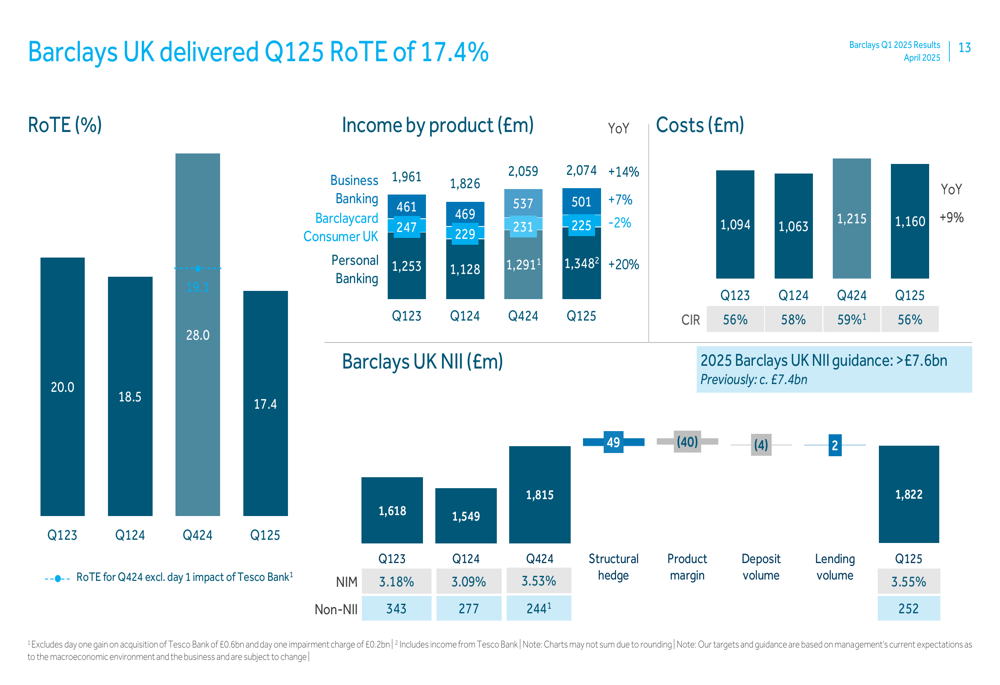
- Barclays UK achieved a RoTE of 17.4% (Q1 2024:18.5%)
- UK Corporate Bank reported a RoTE of 17.1%
- Private Bank & Wealth Management delivered an exceptional RoTE of 34.5%
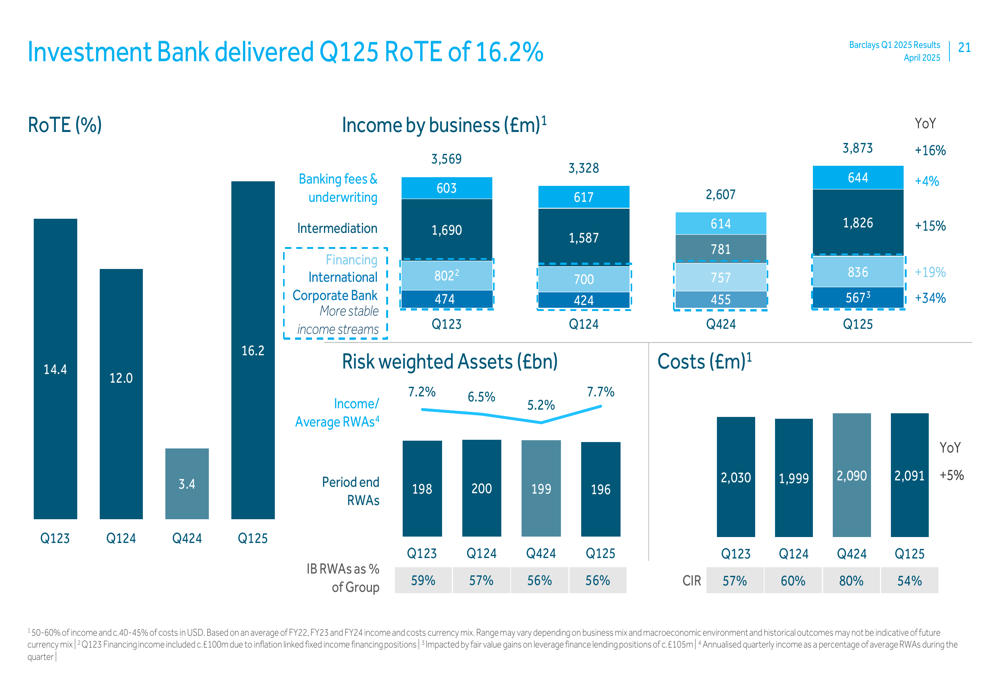
- Investment Bank posted a RoTE of 16.2%
- US Consumer Bank continued to underperform with a RoTE of 4.5%, well below its target of over 12% by 2026
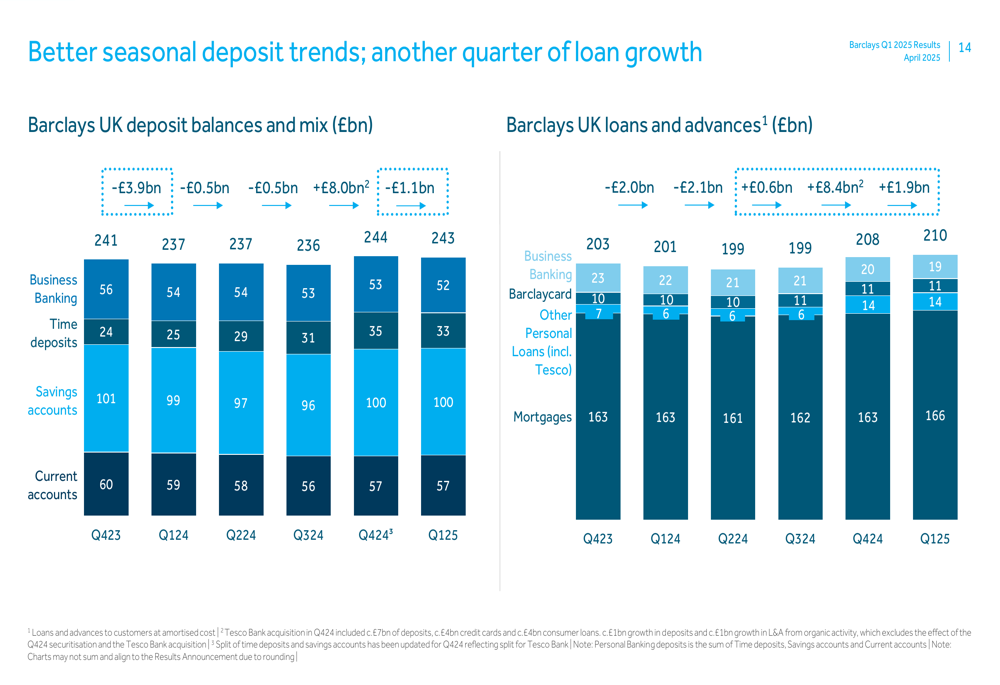
The following chart breaks down Barclays UK’s performance by product and costs:
Barclays UK’s deposit and loan trends show stability in deposit balances and growth in loans and advances, particularly in mortgages and personal loans:
The Investment Bank, which accounts for 56% of Group Risk Weighted Assets (RWAs), delivered a strong performance with income growth across most business lines:
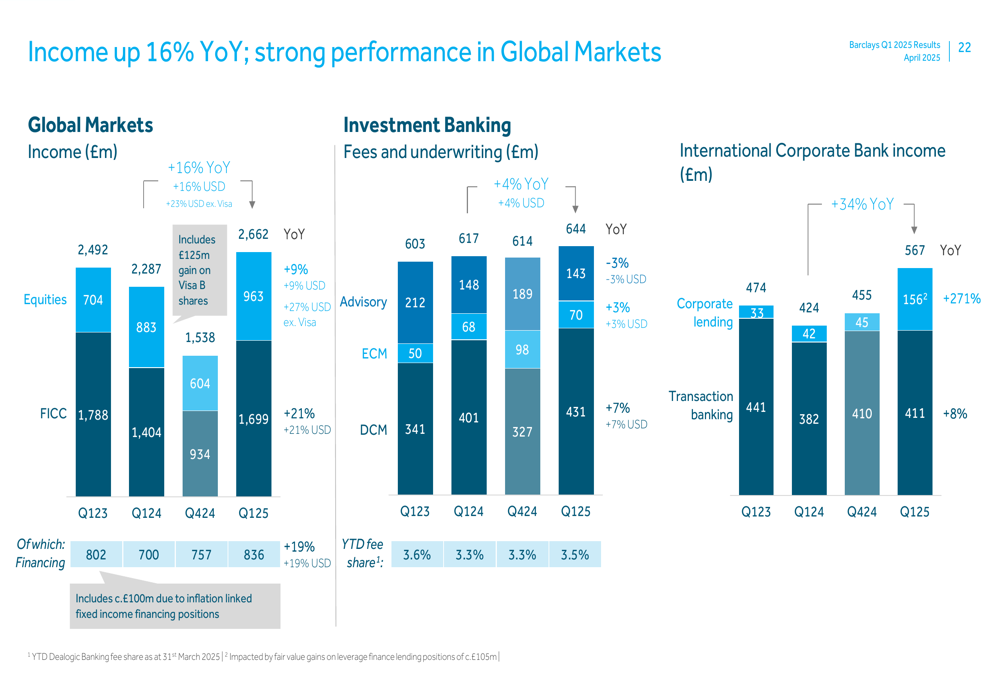
Global Markets and Investment Banking performance was particularly strong, with year-over-year growth in most segments:
Strategic Initiatives
Barclays has made progress on several strategic initiatives during the quarter:
1. Completed the disposal of its German consumer finance business
2. Announced a strategic long-term partnership with Brookfield for Payment Acceptance, with Brookfield potentially acquiring approximately 70% ownership after three years
3. Continued focus on cost efficiency, with a target cost-to-income ratio in the high 50s% by 2026, down from 57% in Q1 2025
The bank’s income streams are becoming increasingly stable, with 68% of Group income in Q1 2025 coming from financing and retail & corporate segments, which are considered more stable sources of revenue. Barclays aims to increase this to more than 70% by 2026.
The following chart illustrates the income growth and stability:
Forward-Looking Statements
Barclays has maintained its 2025 guidance of approximately 11% RoTE and increased its 2025 Group NII guidance to more than £12.5 billion. The bank continues to target a RoTE of over 12% by 2026, with a cost-to-income ratio in the high 50s%.
The bank has committed to a progressive increase in shareholder returns compared to 2024, when it paid £1.2 billion in dividends and conducted £1.8 billion in share buybacks. Barclays is targeting at least £10 billion in total capital returns between 2024 and 2026.
While most business segments are performing at or above target levels, the US Consumer Bank remains a challenge, with a RoTE of only 4.5% compared to its target of over 12%. The loan loss rate in this segment was 562bps in Q1 2025, significantly higher than the Group average of 61bps.
Despite these challenges, Barclays’ overall performance in Q1 2025 demonstrates strong execution of its strategy, with improved profitability, upgraded guidance, and progress on strategic initiatives positioning the bank well for continued growth.
Full presentation:
This article was generated with the support of AI and reviewed by an editor. For more information see our T&C.