Moody’s downgrades Senegal to Caa1 amid rising debt concerns

Introduction & Market Context
Bill.com (NYSE:BILL) released its Q4 and fiscal year 2025 investor presentation on August 27, 2025, highlighting the company’s continued growth as a financial operations platform for small and midsize businesses. The presentation comes as the company’s stock showed mixed performance, closing at $40.63 but rising 1.65% in after-hours trading following the release.
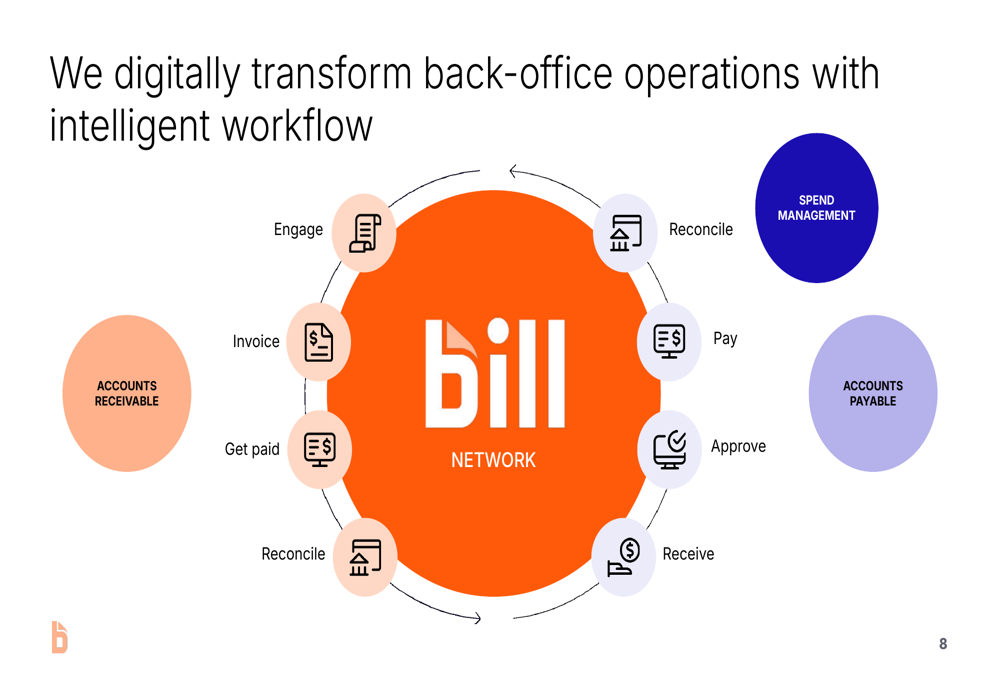
The company positions itself as "Champions of small and midsize businesses" with a mission to "Make it simple to connect and do business." Bill.com’s platform aims to replace legacy paper-based processes with digital solutions for accounts payable, accounts receivable, spend management, and financial planning.
Quarterly Performance Highlights
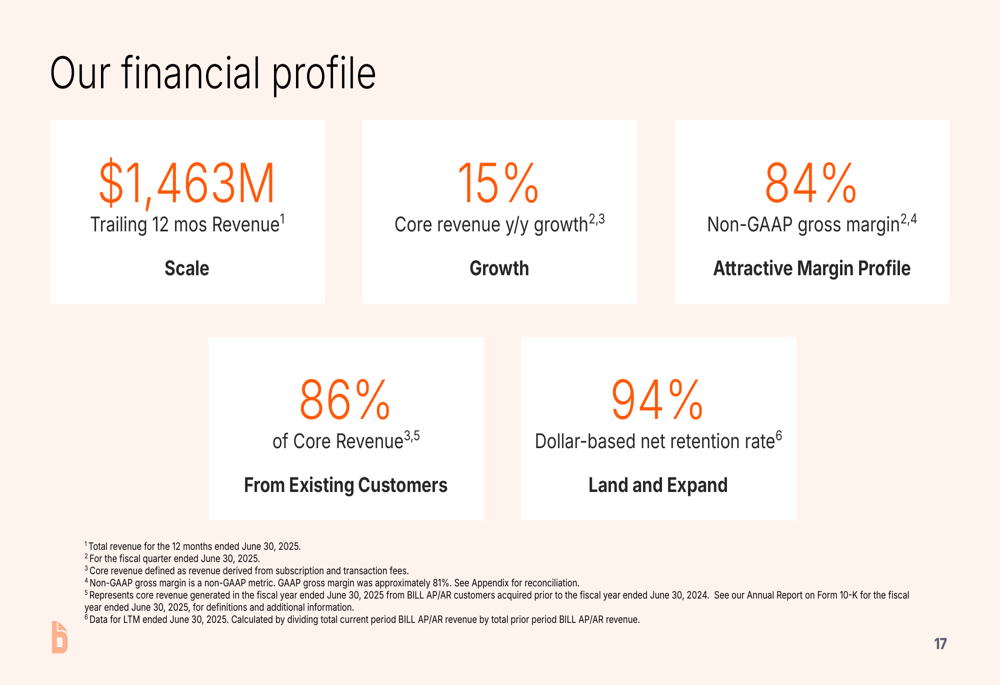
Bill.com reported Q4 2025 revenue of $383 million, representing a 12% year-over-year increase from $344 million in Q4 2024. For the full fiscal year 2025, the company achieved total revenue of $1.46 billion, up 13% from $1.29 billion in FY 2024.
As shown in the following revenue breakdown chart:
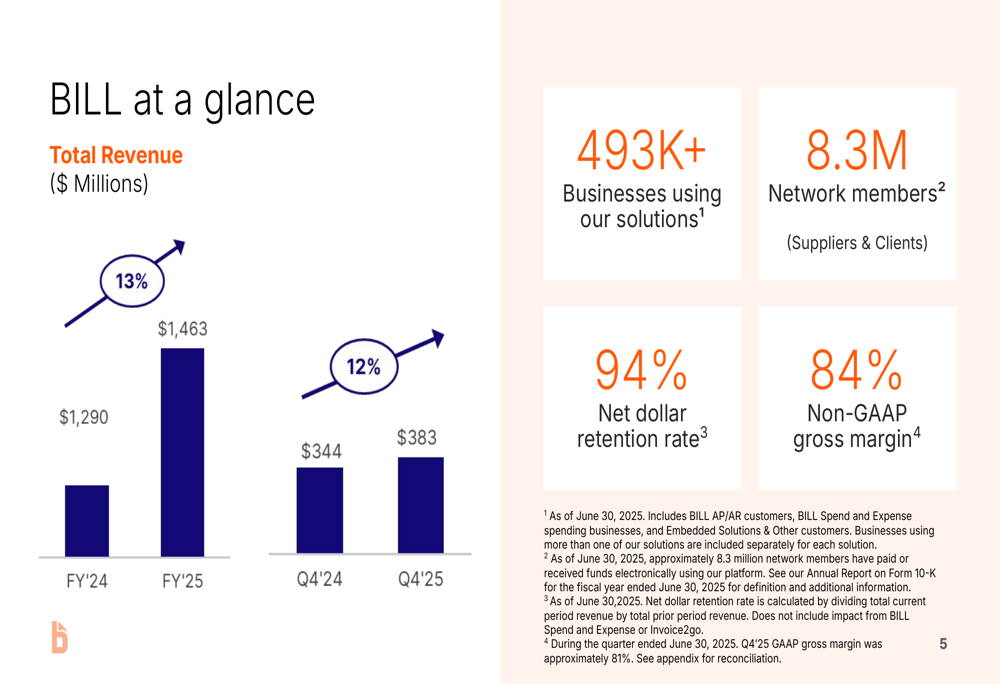
Core revenue, which excludes float revenue, grew at an even stronger rate, reaching $346 million in Q4 2025 (up 15% year-over-year) and $1.30 billion for the full fiscal year (up 16% year-over-year). The company maintained a strong non-GAAP gross margin of 84% and a net dollar retention rate of 94%, indicating high customer satisfaction and expanded usage among existing clients.
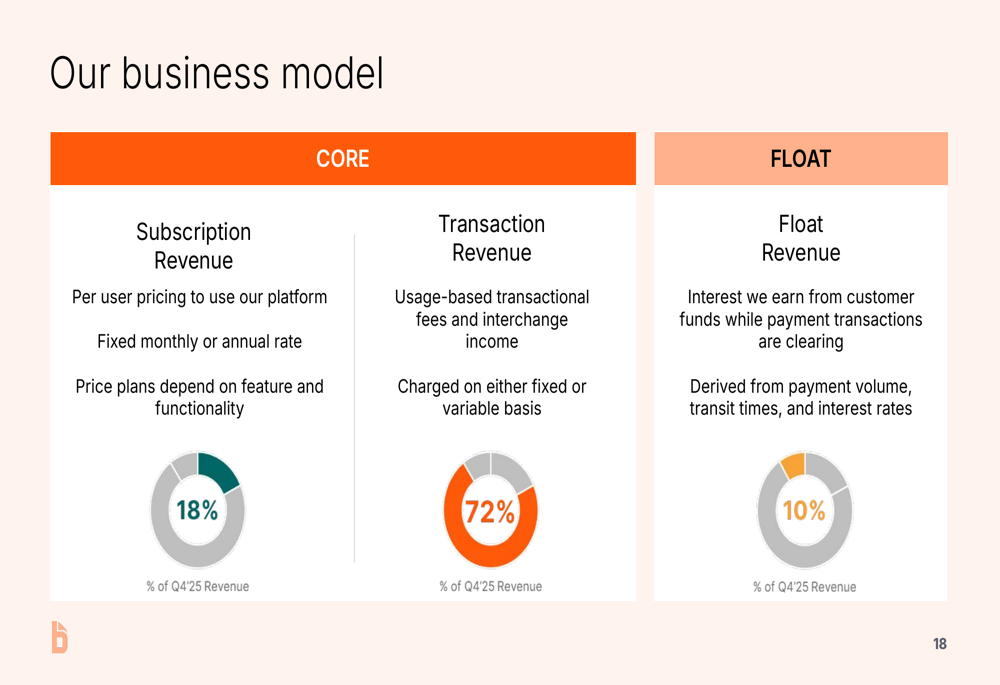
The company’s business model relies primarily on transaction revenue, which accounts for 72% of total revenue, while subscription and float revenue contribute 18% and 10% respectively, as illustrated in this breakdown:
Platform Adoption and Usage
Bill.com continues to expand its customer base and transaction volume. The company now serves over 493,000 businesses, up 4% year-over-year, while transactions processed increased 18% to 33 million in Q4 2025. Total payment volume grew 13% to $86 billion in the same quarter.
The following chart illustrates this growth across key operational metrics:
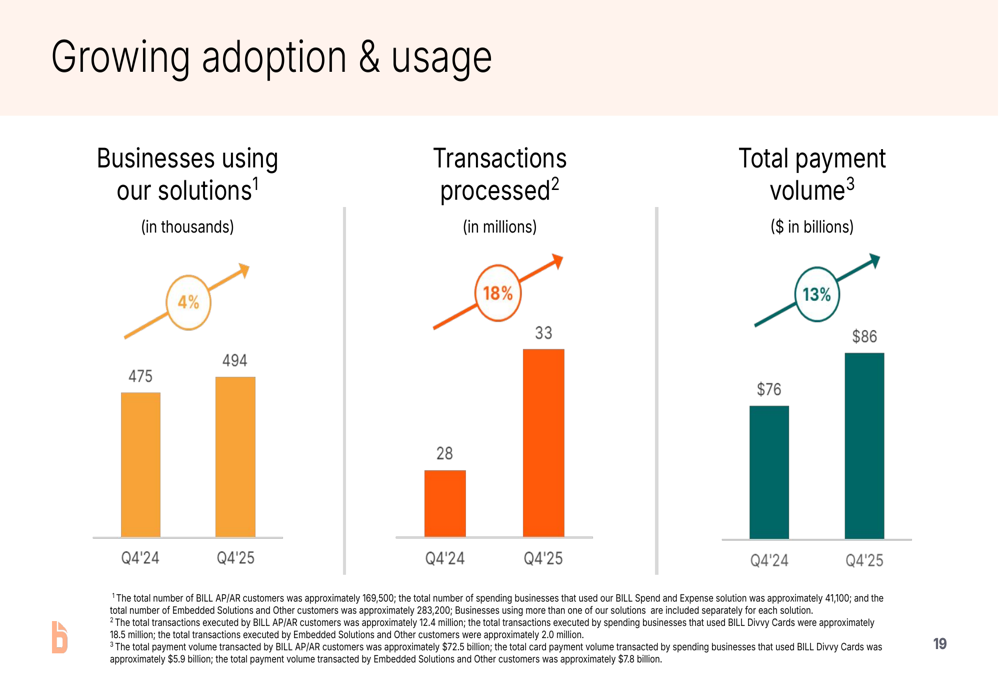
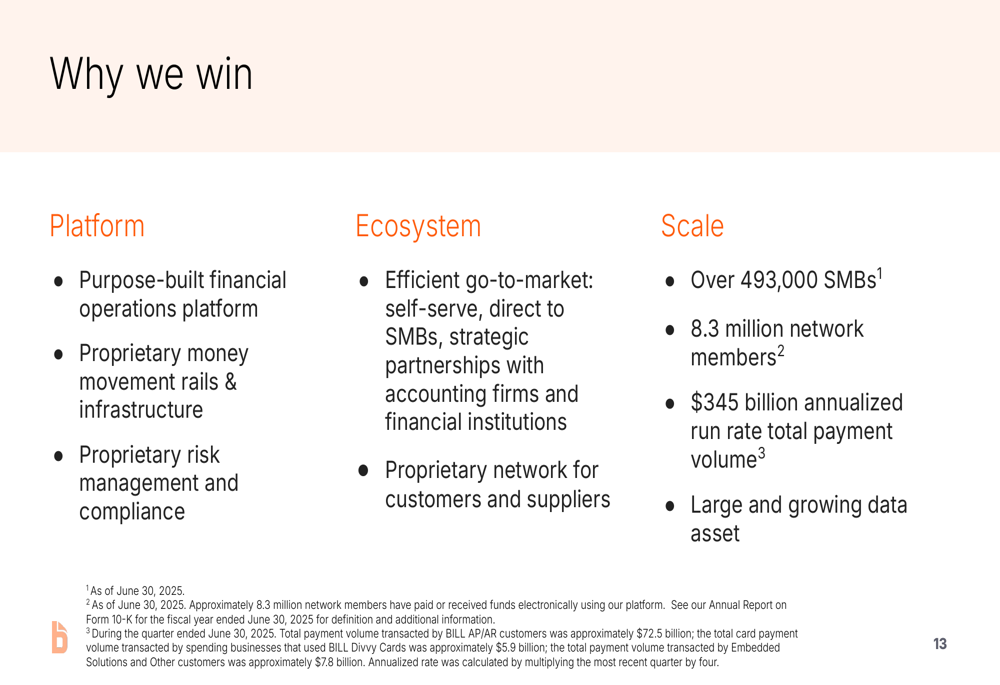
The company’s network now includes 8.3 million members, creating significant network effects that drive adoption, engagement, and customer retention. This expanding ecosystem represents a key competitive advantage for Bill.com in the financial operations market.
Strategic Positioning and Competitive Advantages
Bill.com highlighted several factors contributing to its market leadership position. The company’s integrated platform approach addresses multiple financial operation needs through a single interface, as shown in this product visualization:
The company’s competitive advantages include its purpose-built financial operations platform, proprietary payment infrastructure, efficient go-to-market strategies, and growing network of customers and suppliers. Bill.com has also established partnerships with over 9,000 accounting firms and major financial institutions including American Express, Wells Fargo, JPMorgan Chase, and Bank of America.
As illustrated in their competitive positioning slide:
Market Opportunity and Growth Drivers
Bill.com identifies a substantial addressable market for its solutions. In the U.S. alone, the company targets 34 million SMBs and sole proprietors, representing $75 billion in software spend and $36 trillion in B2B payment volume. Globally, these figures expand to 72 million+ SMBs, $344 billion in software spend, and $135 trillion in B2B payment volume.
The company outlined several drivers for future growth, including new customer acquisition, increased adoption by existing customers, network expansion, platform development, and international expansion. With 86% of core revenue coming from existing customers, Bill.com demonstrates strong upsell potential within its current user base.
Financial Profile and Outlook
Bill.com maintains a strong financial profile with 84% non-GAAP gross margins and a 94% dollar-based net retention rate. The company has achieved a 49% CAGR in total revenue, demonstrating consistent execution over time.
The financial highlights are summarized in this slide:
These results align with the company’s Q3 2025 earnings report from earlier this year, which showed revenue of $358 million (11% year-over-year growth) and an EPS of $0.50, exceeding analyst expectations of $0.37. At that time, the company projected Q4 revenue between $370.5 million and $380.5 million, and the actual $383 million result came in slightly above the high end of that guidance.
Market Reaction and Analysis
Despite Bill.com’s solid financial performance, investor reaction has been mixed. Following the Q3 earnings report, the stock fell 3.51% despite beating expectations. The stock closed at $40.63 on August 27, 2025, but showed signs of positive movement with a 1.65% gain in after-hours trading.
The stock remains significantly below its 52-week high of $100.19, though well above its low of $36.55. This valuation gap may reflect broader market concerns about the SMB sector amid economic uncertainty, though Bill.com’s consistent growth and high retention rates suggest underlying business strength.
As the company continues to execute on its growth strategy, investors will be watching for sustained revenue acceleration, margin expansion, and increased platform adoption across its target markets.
Full presentation:
This article was generated with the support of AI and reviewed by an editor. For more information see our T&C.