US stock futures inch higher with Q3 earnings on tap

Blend Labs Inc (NYSE:BLND) reported its first quarter 2025 results on May 8, showing continued profitability and strong free cash flow generation despite a challenging mortgage environment. The fintech company’s stock jumped 12.15% in aftermarket trading following the release, reaching $3.69 per share.
Quarterly Performance Highlights
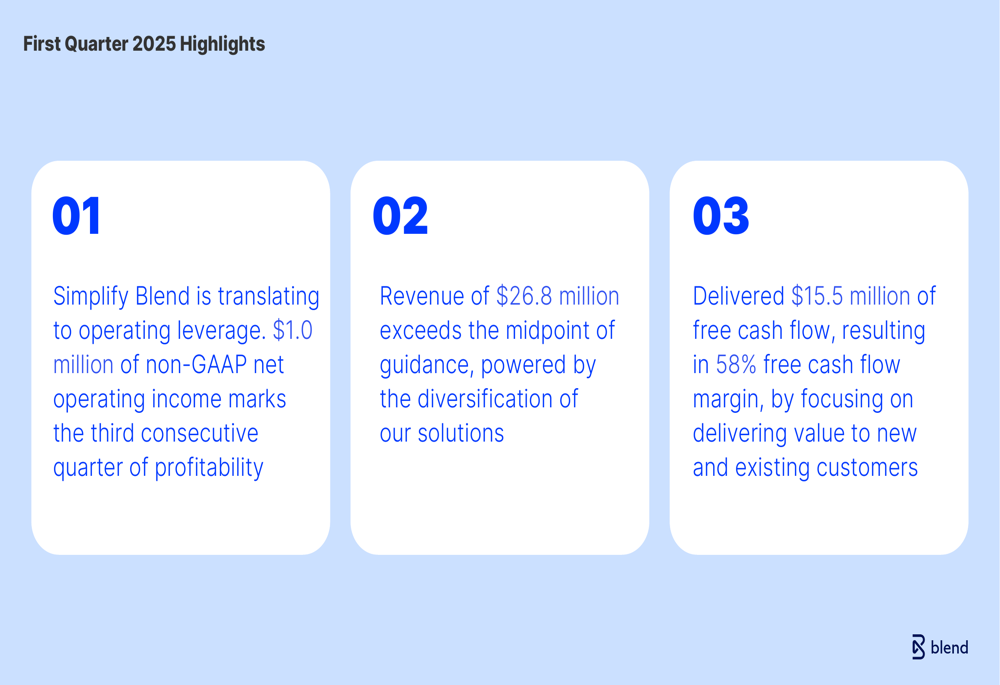
Blend Labs reported Q1 2025 revenue of $26.8 million, exceeding the midpoint of its guidance and representing a 12% year-over-year increase from $23.8 million in Q1 2024. The company achieved $1.0 million in non-GAAP net operating income, marking its third consecutive quarter of profitability.
Perhaps most impressive was Blend’s free cash flow generation, which reached $15.5 million in the quarter, resulting in a 58% free cash flow margin. This represents a dramatic improvement from previous quarters and demonstrates the company’s progress toward sustainable profitability.
As shown in the following key highlights from the quarter:
Revenue Diversification Strategy
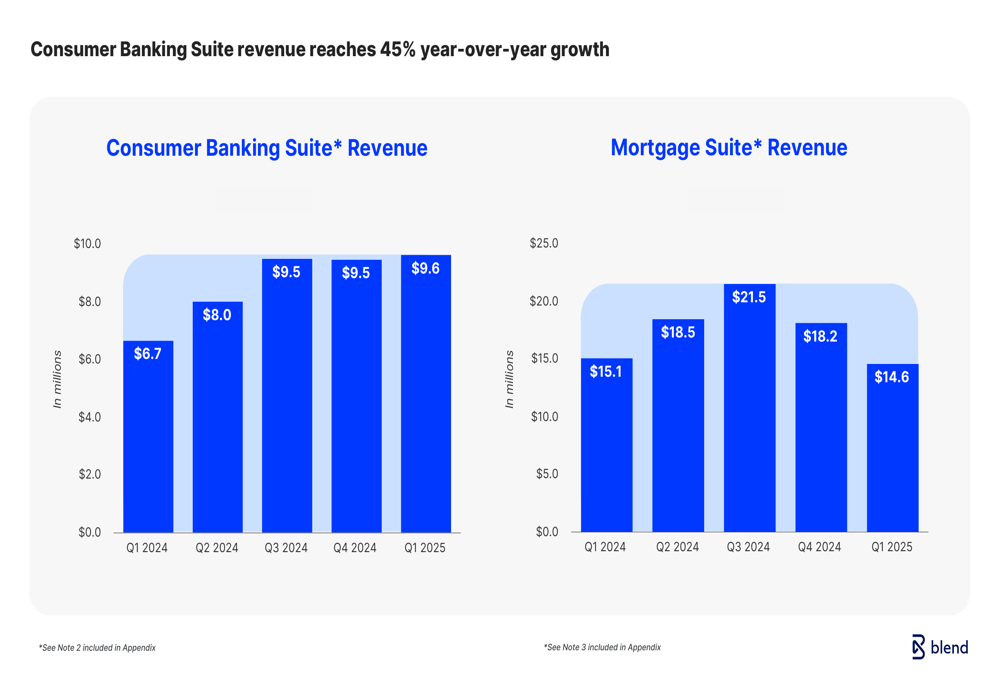
Blend’s revenue diversification strategy continued to pay dividends, with its Consumer Banking Suite revenue growing 45% year-over-year to $9.6 million, now representing 36% of total revenue compared to 28% a year earlier. Meanwhile, Mortgage Suite revenue declined slightly to $14.6 million, a 3% year-over-year decrease, reflecting ongoing challenges in the mortgage market.
The following chart illustrates the steady growth of Consumer Banking revenue over the past five quarters, contrasted with the more volatile performance of the Mortgage Suite:
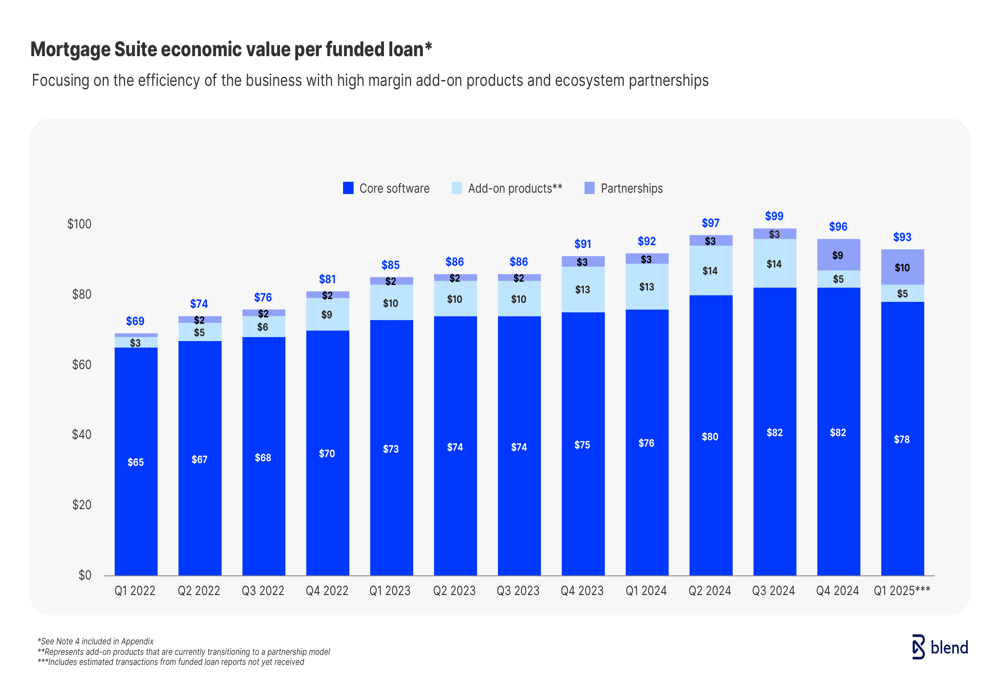
Despite the decline in Mortgage Suite revenue, Blend has successfully increased the economic value it generates per funded loan. The company’s strategy of adding more value through core software, add-on products, and partnerships has resulted in economic value per funded loan of $93 in Q1 2025, compared to $92 in Q1 2024.
The breakdown of economic value per funded loan over time is illustrated here:
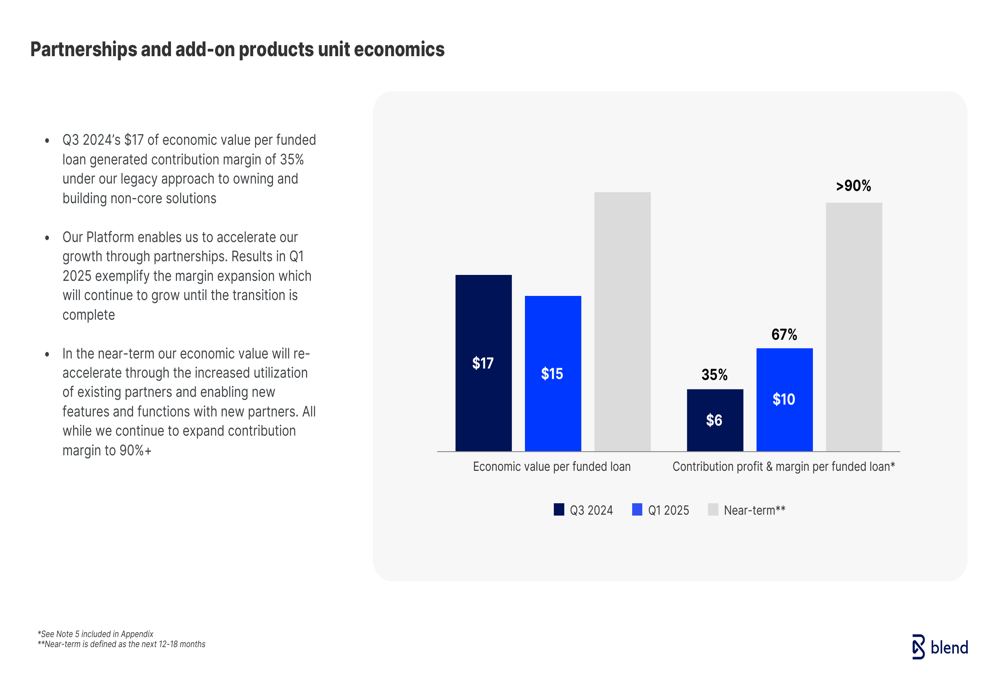
Blend has also made significant progress in improving the profitability of its partnerships and add-on products, with contribution margin per funded loan increasing from 35% ($6) in Q3 2024 to 67% ($10) in Q1 2025, with a near-term target exceeding 90%.
As shown in the following chart of partnership economics:
Operational Efficiency Improvements
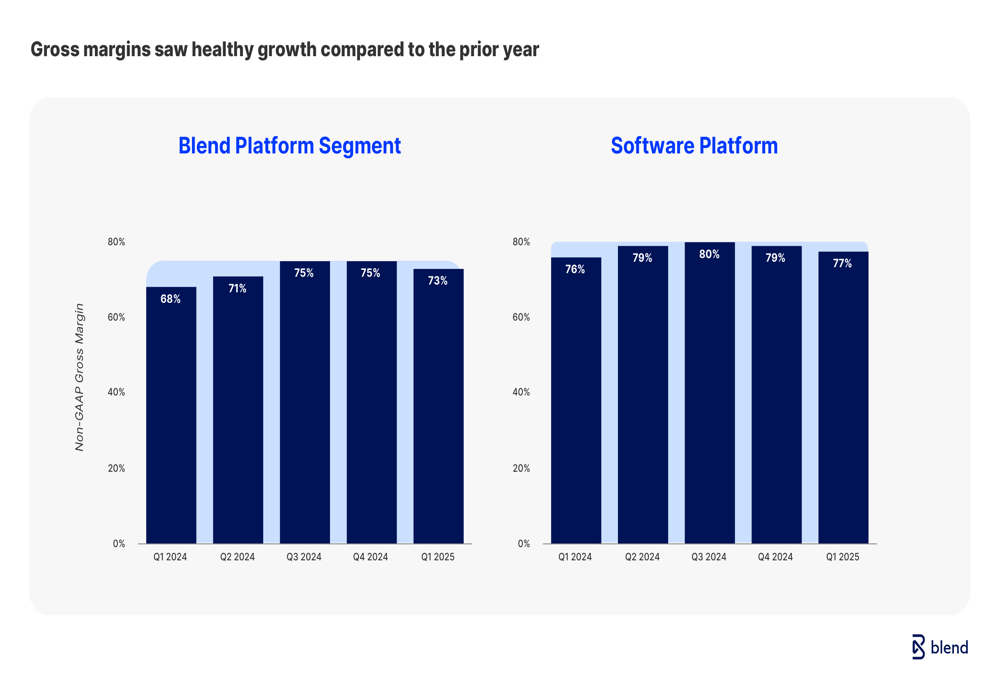
Blend’s "Simplify Blend" initiative has translated into significant operating leverage, with gross margins improving across the business. The Blend Platform Segment’s non-GAAP gross margin increased from 68% in Q1 2024 to 73% in Q1 2025, while the Software (ETR:SOWGn) Platform’s gross margin improved from 76% to 77% over the same period.
The gross margin improvements are illustrated in the following chart:
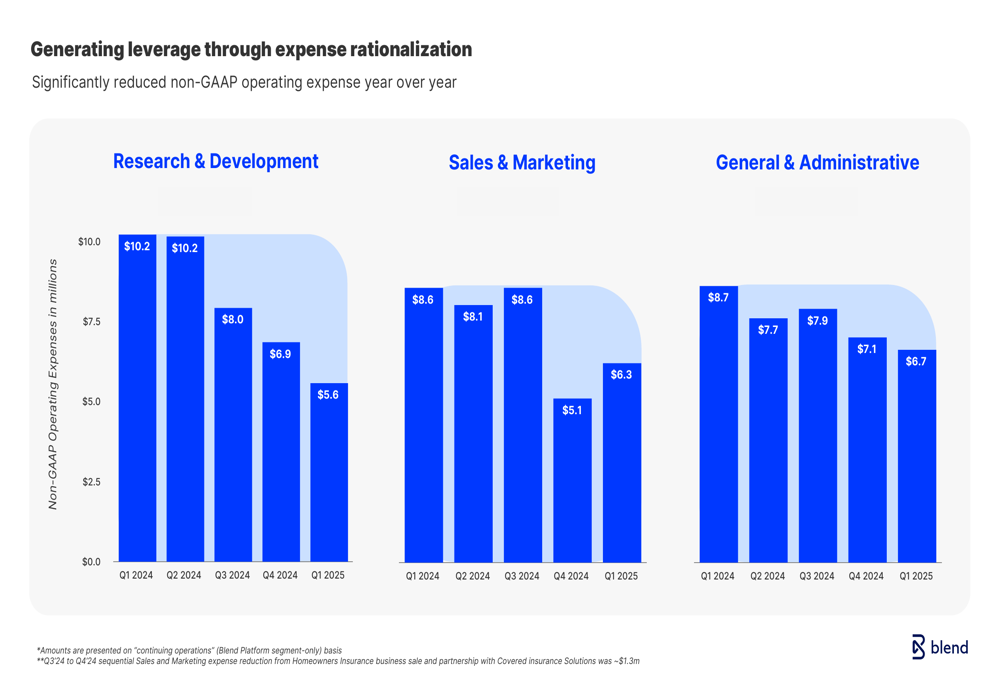
The company has also made substantial progress in reducing operating expenses across all departments. Research & Development expenses decreased from $10.2 million in Q1 2024 to $5.6 million in Q1 2025, Sales & Marketing expenses fell from $8.6 million to $6.3 million, and General & Administrative expenses declined from $8.7 million to $6.7 million.
The following chart shows the company’s operating expense rationalization:
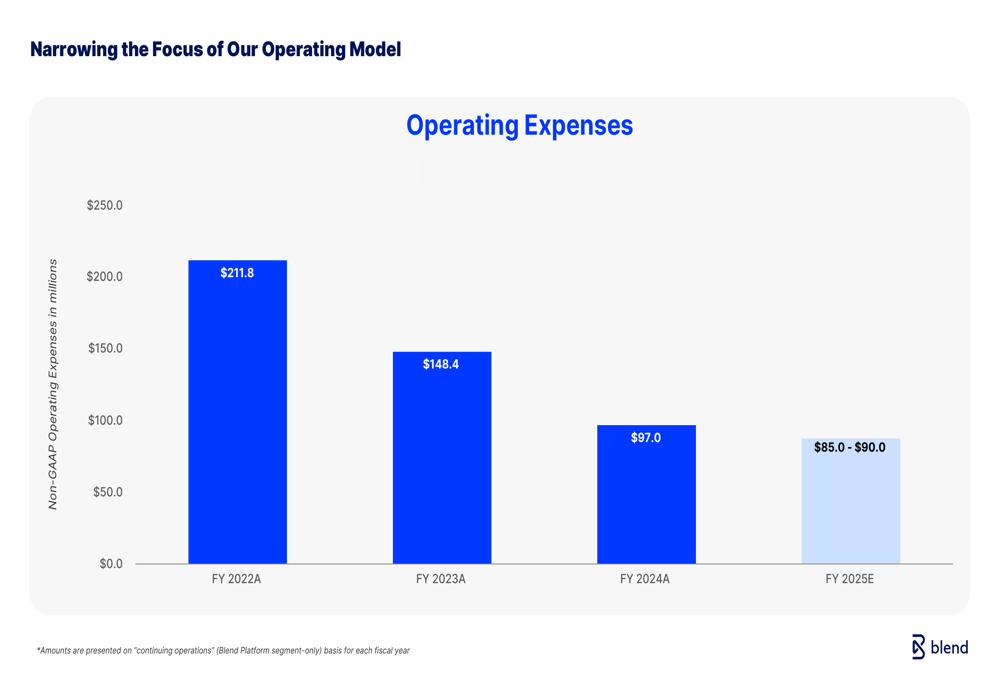
This expense reduction is part of a multi-year strategy to narrow the focus of Blend’s operating model. Non-GAAP operating expenses have decreased from $211.8 million in FY 2022 to a projected $85.0-$90.0 million in FY 2025, representing a nearly 60% reduction over three years.
The long-term operating expense trend is shown here:
Financial Outlook
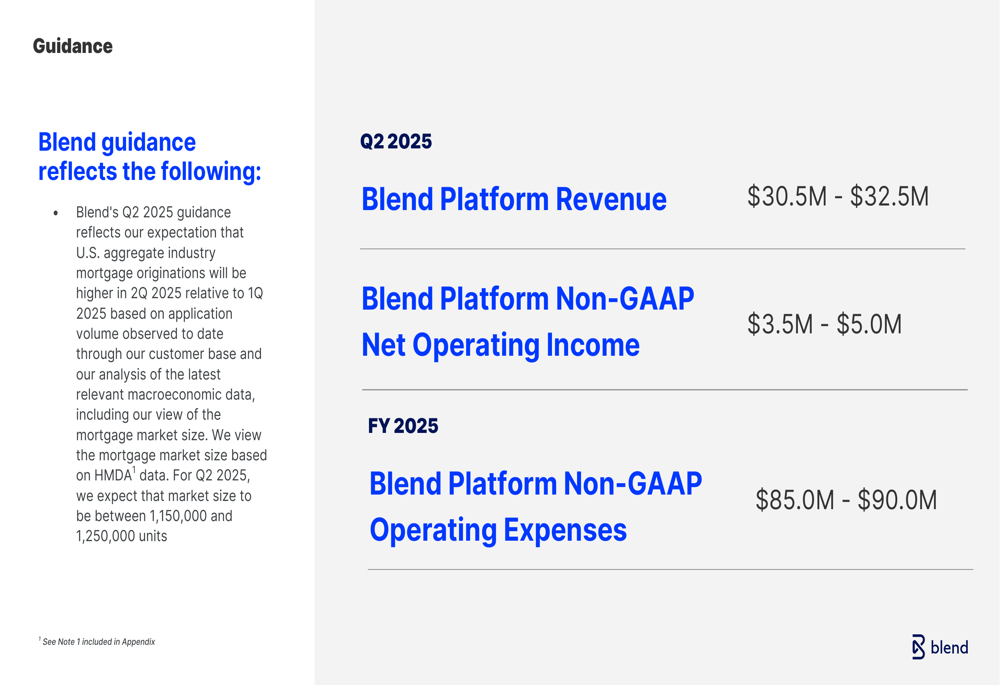
Looking ahead to Q2 2025, Blend provided guidance for Platform Revenue of $30.5-$32.5 million and Non-GAAP Net Operating Income of $3.5-$5.0 million. The company also maintained its full-year 2025 guidance for Platform Non-GAAP Operating Expenses of $85.0-$90.0 million.
The guidance reflects expectations for higher U.S. aggregate industry mortgage originations in Q2 2025 relative to Q1 2025, suggesting a potentially improving environment for the company’s Mortgage Suite.
The company’s detailed guidance is presented below:
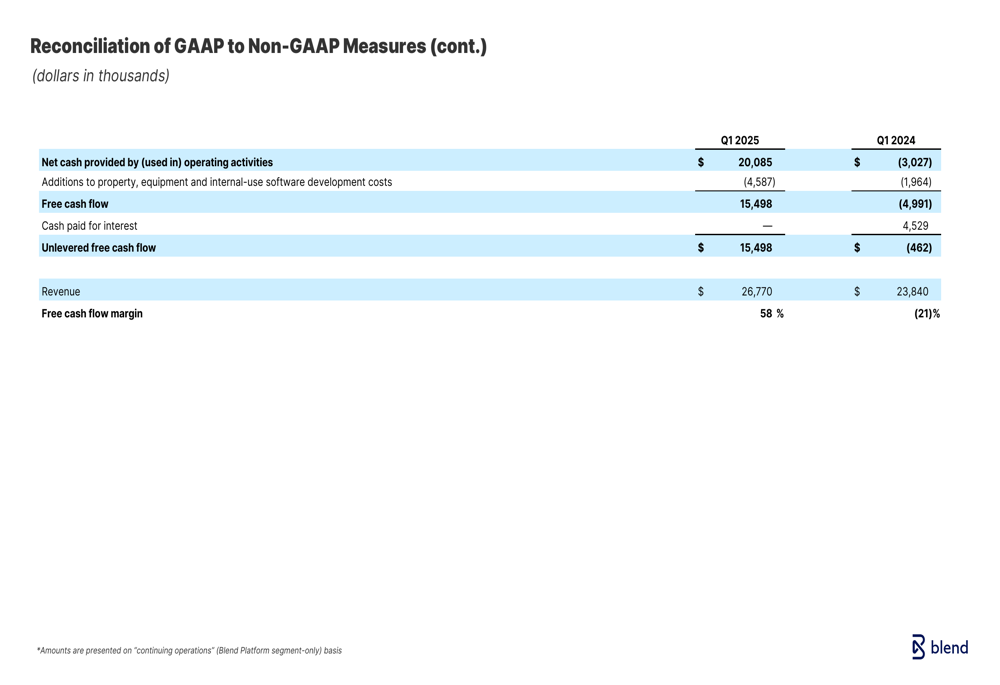
GAAP to Non-GAAP Reconciliation
Blend’s free cash flow generation has improved dramatically, with the company delivering $15.5 million in free cash flow during Q1 2025, compared to negative $10.9 million in Q1 2024. This improvement reflects both higher operating cash flow and reduced capital expenditures.
The reconciliation of GAAP to non-GAAP free cash flow is shown here:
Conclusion
Blend Labs’ Q1 2025 results demonstrate continued progress in its transformation from a mortgage-focused software provider to a diversified banking technology platform. The company’s third consecutive quarter of profitability, strong free cash flow generation, and improving margins suggest its strategy is working despite ongoing challenges in the mortgage market.
The positive aftermarket stock reaction indicates investors are encouraged by Blend’s execution and outlook. With Consumer Banking revenue growth offsetting mortgage volatility and operating expenses continuing to decline, Blend appears well-positioned to build on its recent momentum through the remainder of 2025.
Full presentation:
This article was generated with the support of AI and reviewed by an editor. For more information see our T&C.