Futures slip, bank earnings ahead, Powell to speak - what’s moving markets

Introduction & Market Context
Block Inc. (NYSE:SQ) released its Q1 2025 investor presentation on May 1, showing mixed results that triggered a sharp 17.84% aftermarket stock plunge to $48.05, despite reporting its highest-ever quarterly adjusted operating income.
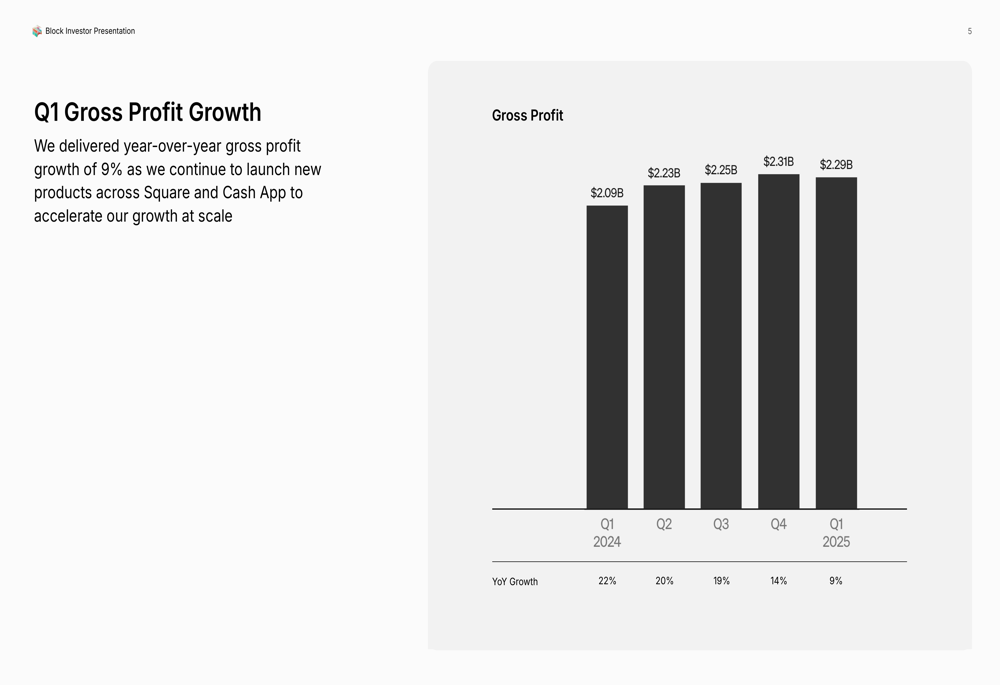
The financial technology company, which operates the Square and Cash App ecosystems, reported 9% year-over-year gross profit growth to $2.31 billion, continuing a decelerating growth trend from previous quarters while emphasizing improvements in profitability metrics.
This marks a significant deceleration from the 22% growth rate Block achieved in Q1 2024, raising concerns among investors about the company’s ability to maintain momentum in an increasingly competitive fintech landscape.
Quarterly Performance Highlights
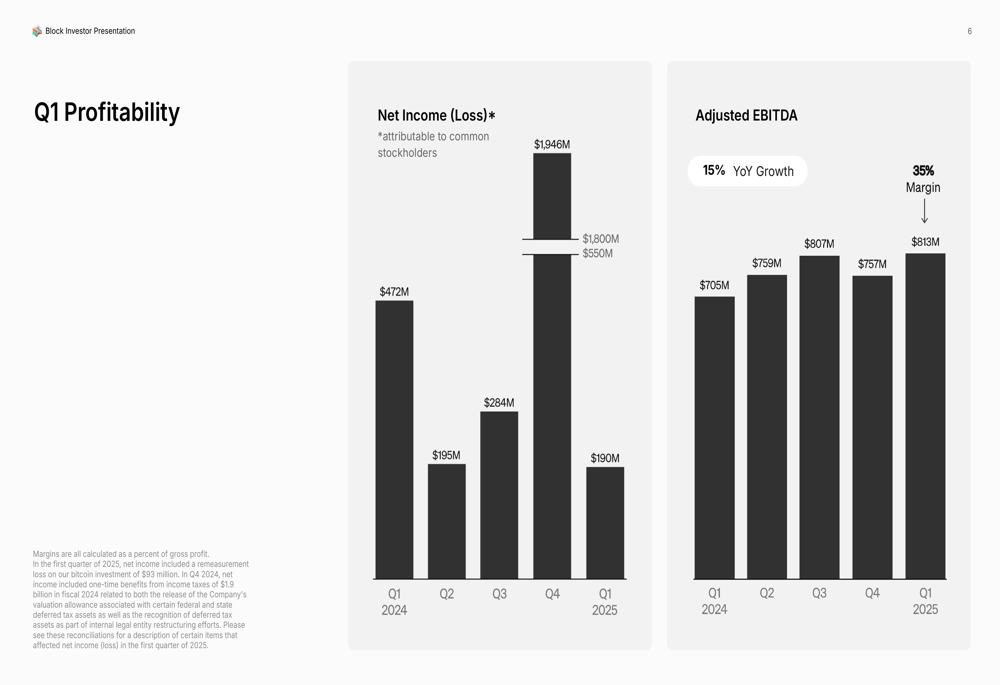
Block’s Q1 2025 results show a company prioritizing profitability while managing slowing growth. The company achieved record adjusted operating income of $466 million, representing 28% year-over-year growth and a 20% margin.
As shown in the following chart of quarterly gross profit growth, Block has experienced a consistent deceleration over the past five quarters:
The company’s adjusted EBITDA reached $813 million in Q1 2025, up 15% year-over-year with a 35% margin, demonstrating Block’s focus on operational efficiency despite moderating top-line growth.
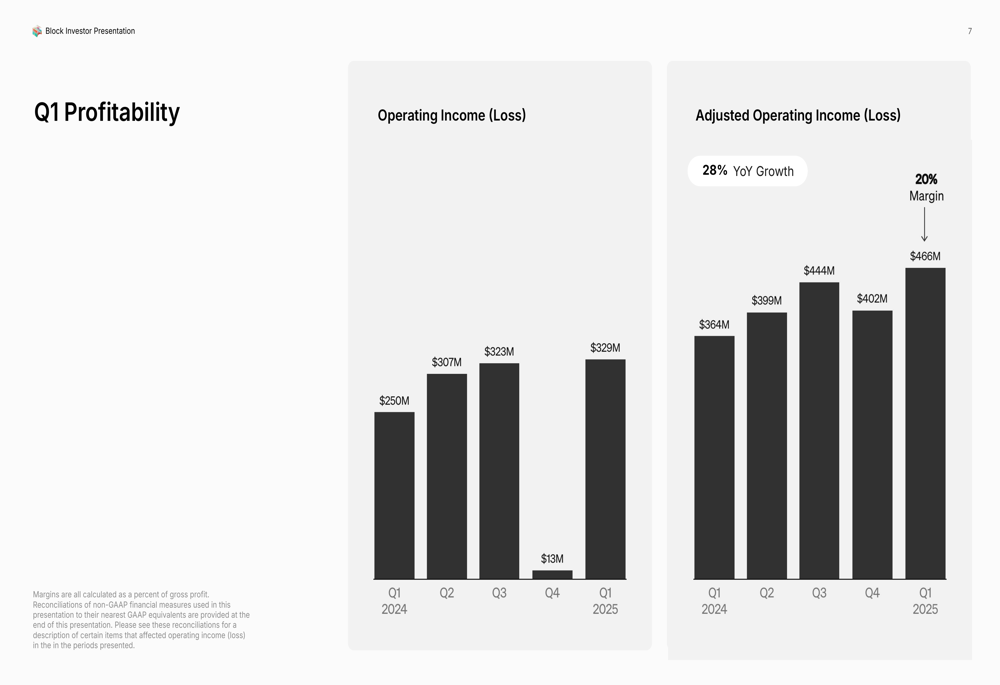
The improvement in operating income is even more pronounced, with adjusted operating income increasing 28% year-over-year to $466 million:
This performance comes after Block missed analyst expectations in Q4 2024, when the company reported EPS of $0.71 versus the forecasted $0.86, and revenue of $6.03 billion against expectations of $6.24 billion.
Cash App Performance
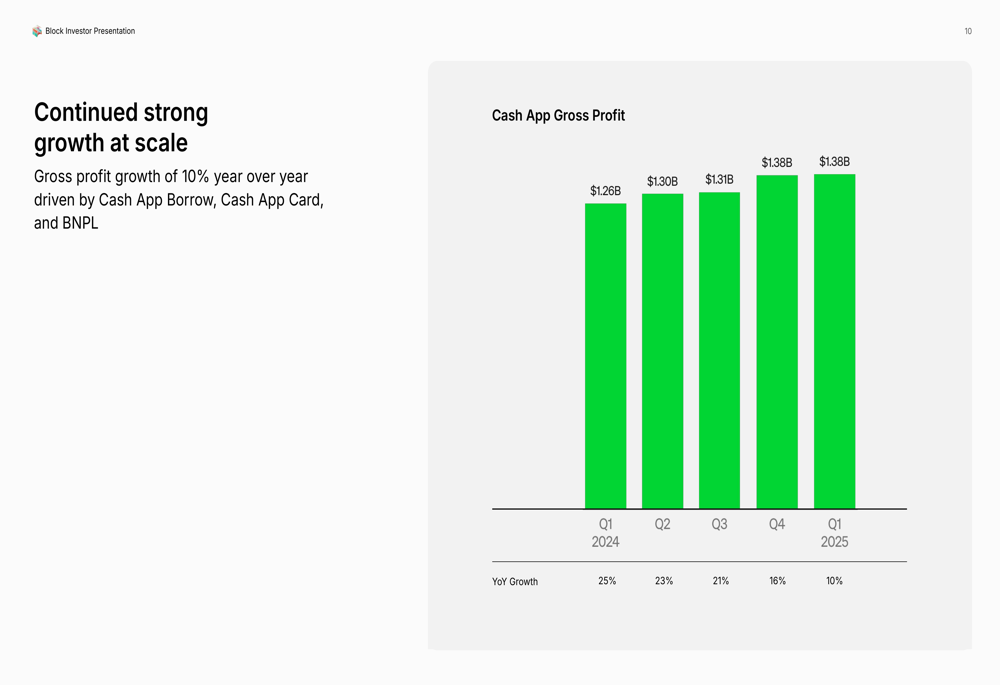
Cash App, Block’s consumer-focused payment and financial services platform, delivered gross profit of $1.39 billion in Q1 2025, representing 10% year-over-year growth. This segment has also experienced a gradual slowdown from the 25% growth rate achieved in Q1 2024.
The following chart illustrates Cash App’s gross profit trajectory over the past five quarters:
Despite the slowing growth rate, Cash App continues to show improving monetization metrics. Gross profit per monthly transacting active reached $81 in Q1 on an annualized basis, up 9% year-over-year:
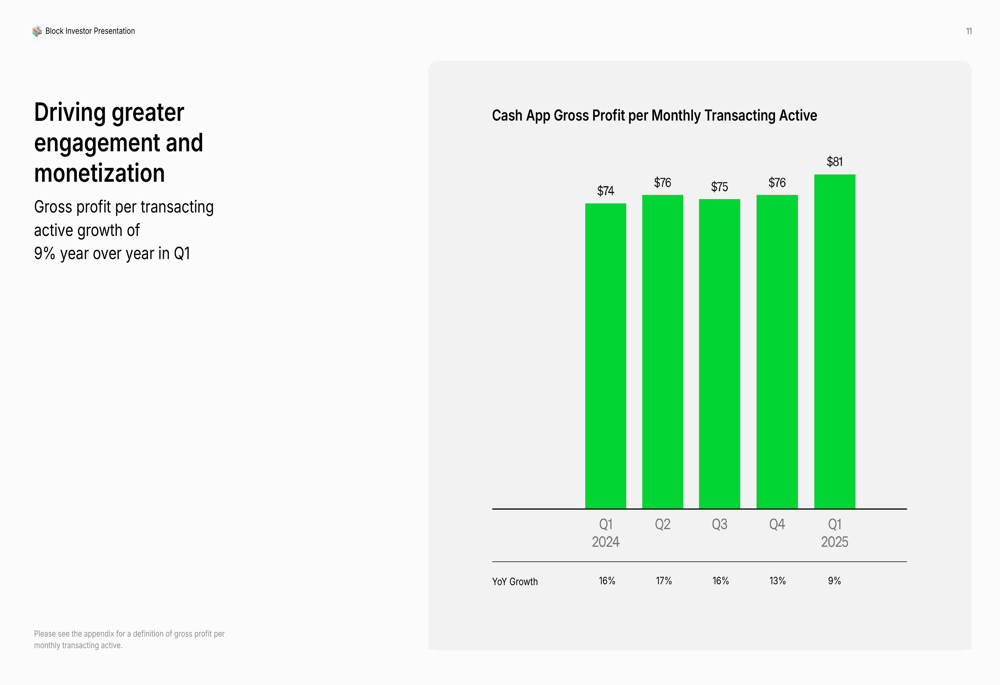
Block highlighted its success in driving deeper engagement, with Cash App Card monthly actives growing to 45% of overall Cash App actives as of March 2025. The company reported 25 million Cash App Card monthly actives, underscoring its progress in expanding financial services adoption among its user base.
Cash App inflows per transacting active increased 8% year-over-year to $1,355 in Q1 2025, which the company attributed to more customers using direct deposit services.
Square Business Segment
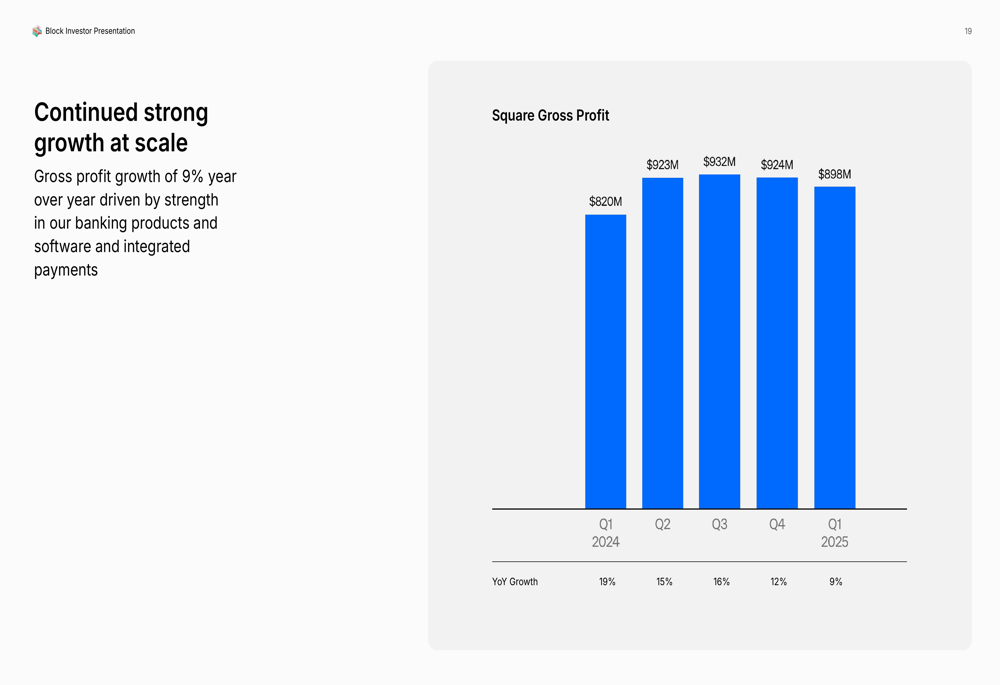
Block’s merchant-focused Square segment generated $898 million in gross profit during Q1 2025, representing 9% year-over-year growth. Similar to Cash App, Square has experienced a gradual deceleration from the 19% growth rate in Q1 2024.
The following chart shows Square’s gross profit performance over the past five quarters:
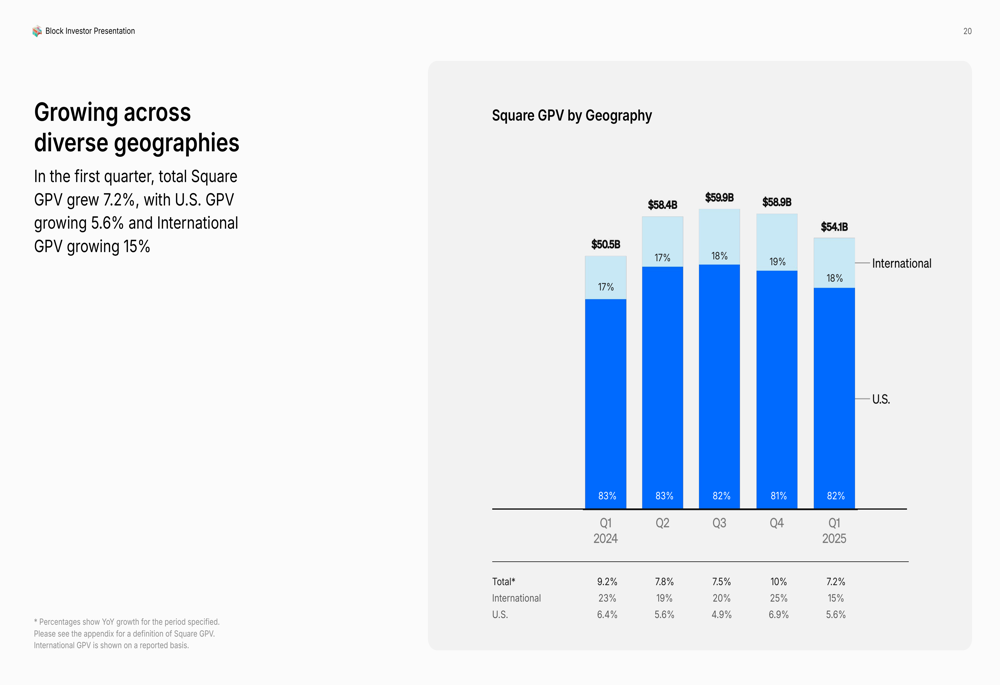
A key bright spot for Square has been its international expansion, with international gross payment volume (GPV) growing 15% year-over-year, significantly outpacing US GPV growth of 5.6%. Overall, Square GPV increased 7.2% to $54.1 billion in Q1 2025.
As illustrated in this geographical breakdown of Square’s payment volume:
Block also highlighted its progress in moving upmarket, with mid-market sellers (those processing over $500,000 annually) now accounting for 41% of Square’s total GPV, up from 39% in Q1 2024:
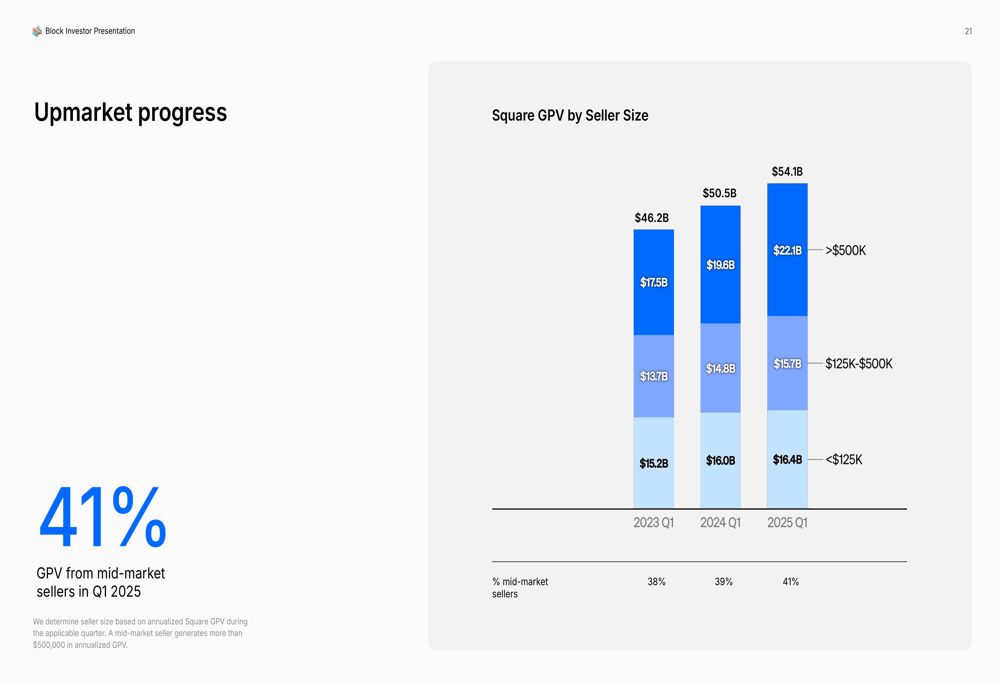
This upmarket shift aligns with Block’s strategic priority of providing "a local experience to sellers of all sizes" while focusing on higher-value merchant relationships that typically generate more stable revenue streams.
Forward Guidance and Outlook
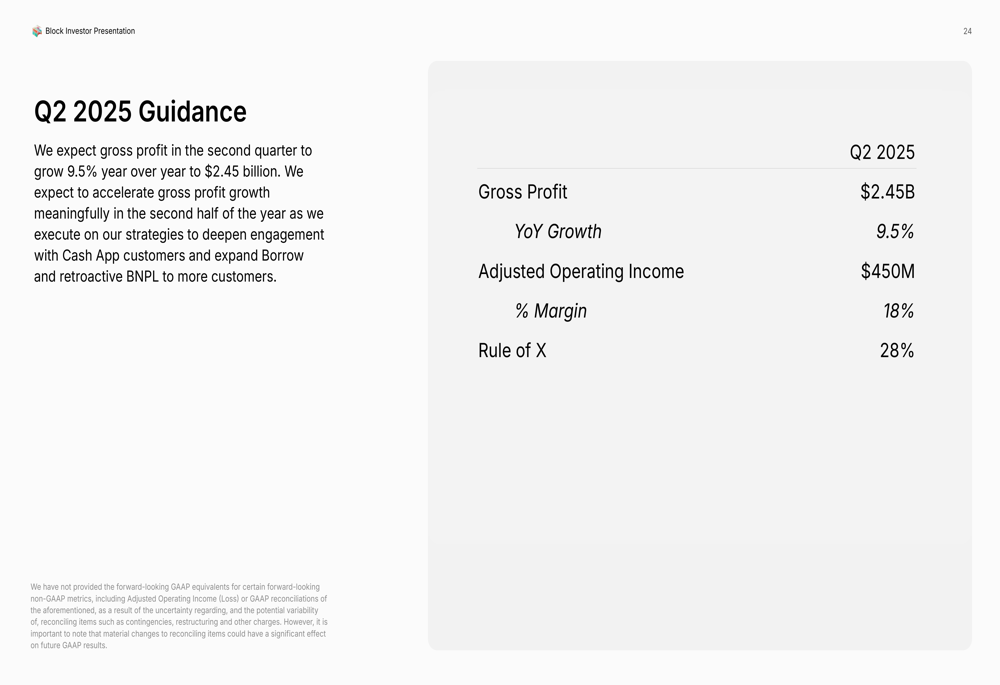
For Q2 2025, Block expects gross profit of $2.45 billion, representing 9.5% year-over-year growth, with adjusted operating income of $450 million and an 18% margin:
Looking at the full year 2025, Block projects gross profit of $9.96 billion, representing 12% year-over-year growth, and adjusted operating income of $1.90 billion with a 19% margin:
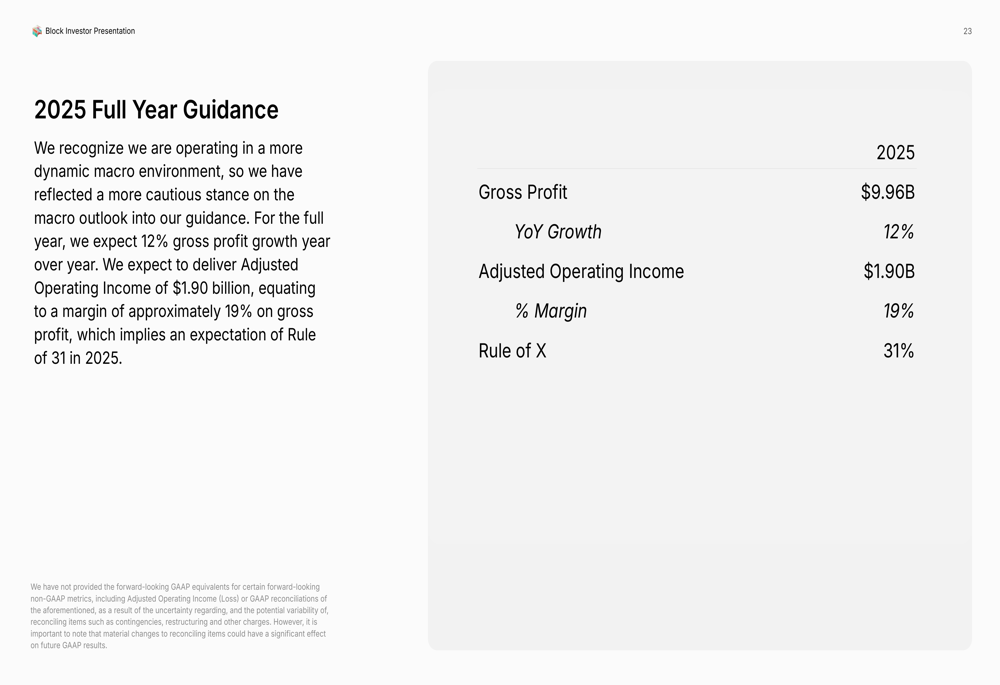
The company anticipates accelerating gross profit growth in the second half of the year across both Square and Cash App, with mid-teens growth expected by the fourth quarter. Block also emphasized its commitment to the "Rule of 40" financial framework, which combines growth rate and profit margin as a performance metric.
Despite these positive projections, the market’s sharp negative reaction suggests investors remain concerned about Block’s growth trajectory and competitive positioning in an increasingly crowded fintech market. The contrast between the company’s optimistic outlook and the stock’s performance highlights the challenges Block faces in convincing investors that its strategic priorities will deliver the growth they expect.
Full presentation:
This article was generated with the support of AI and reviewed by an editor. For more information see our T&C.