Is this U.S.-China selloff a buy? A top Wall Street voice weighs in

Charter Communications (NASDAQ:CHTR) presented its first quarter 2025 results on April 25, showing modest revenue growth but significant improvement in profitability driven by mobile segment expansion and operational efficiencies. The company’s stock rose 4.32% in premarket trading following the release.
Quarterly Performance Highlights
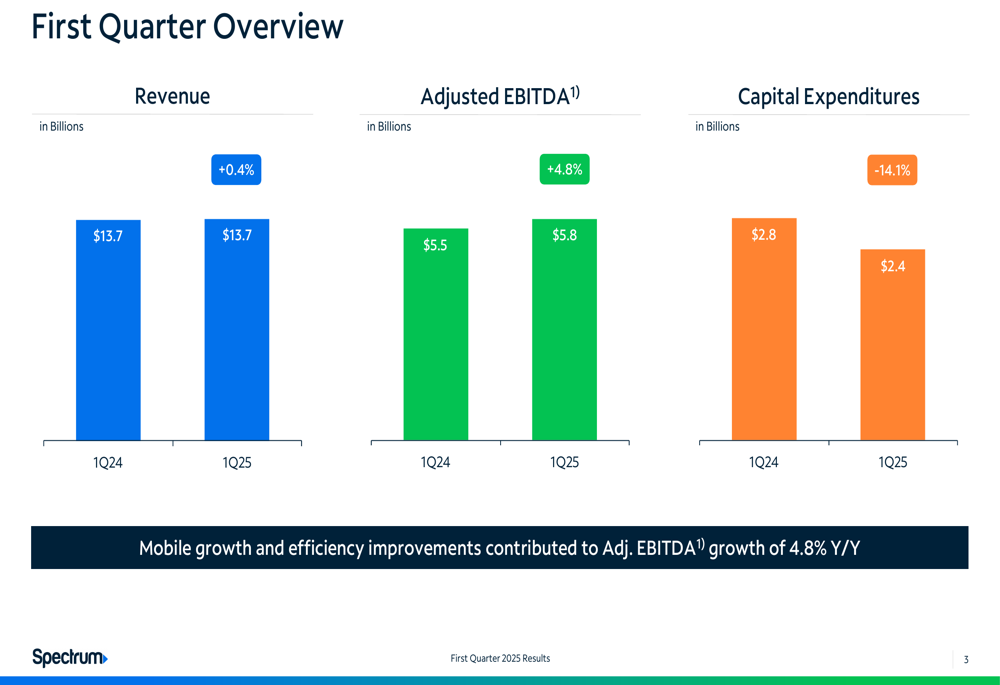
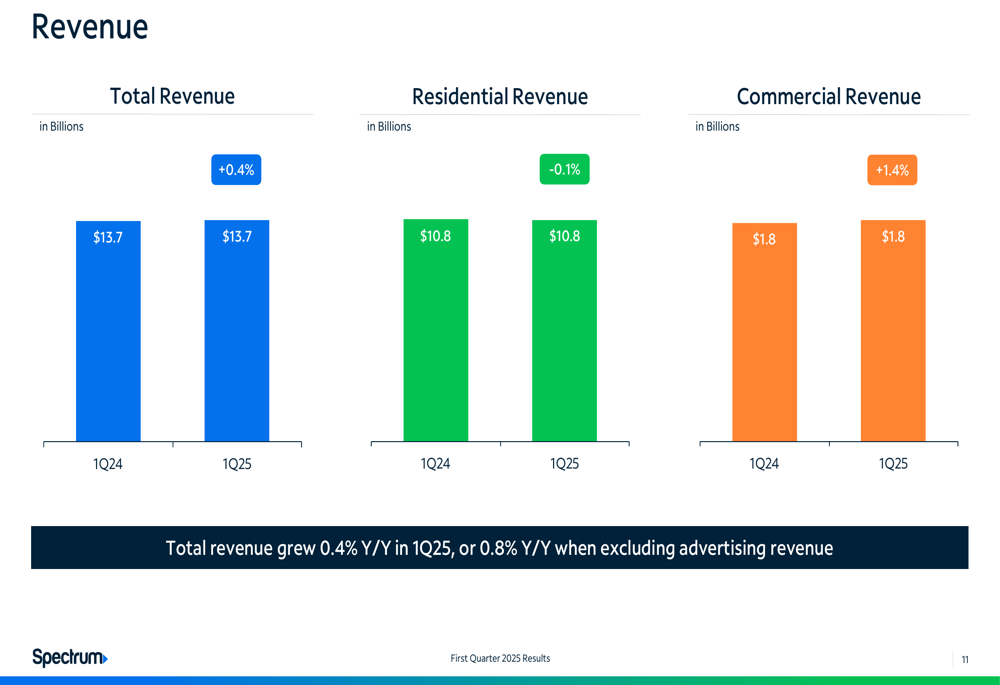
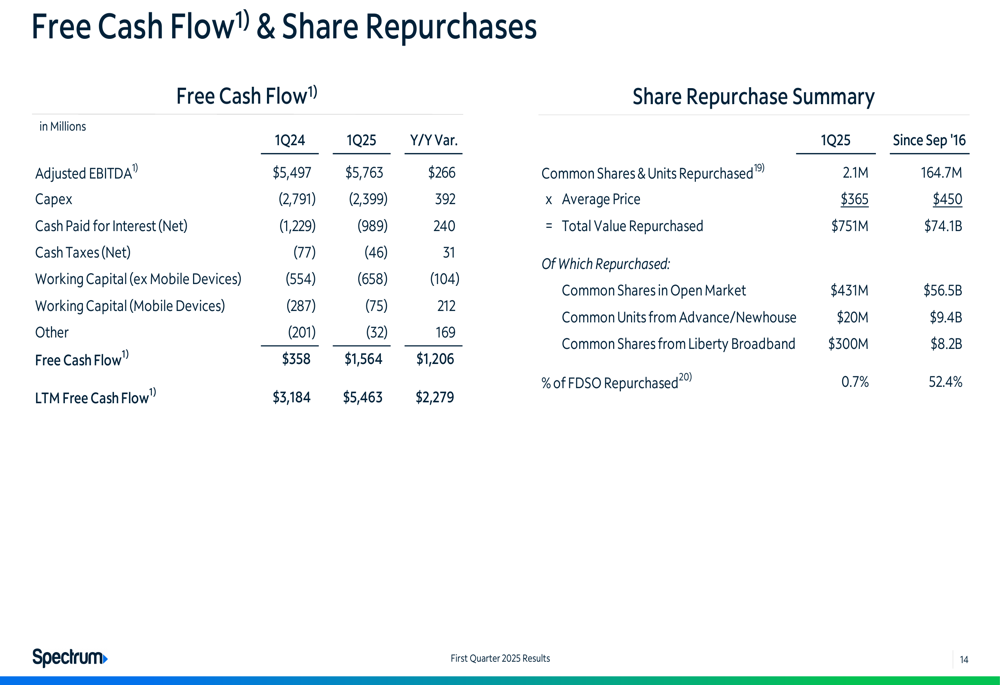
Charter reported Q1 2025 revenue of $13.7 billion, representing a slight increase of 0.4% year-over-year. However, when excluding advertising revenue, growth improved to 0.8%. The company’s Adjusted EBITDA showed more substantial improvement, rising 4.8% to $5.8 billion compared to the same period last year.
Capital expenditures decreased significantly by 14.1% year-over-year to $2.4 billion, reflecting a potential maturation of the company’s investment cycle. Management highlighted that mobile growth and efficiency improvements were key contributors to the Adjusted EBITDA growth.
As shown in the following chart detailing Charter’s quarterly financial performance:
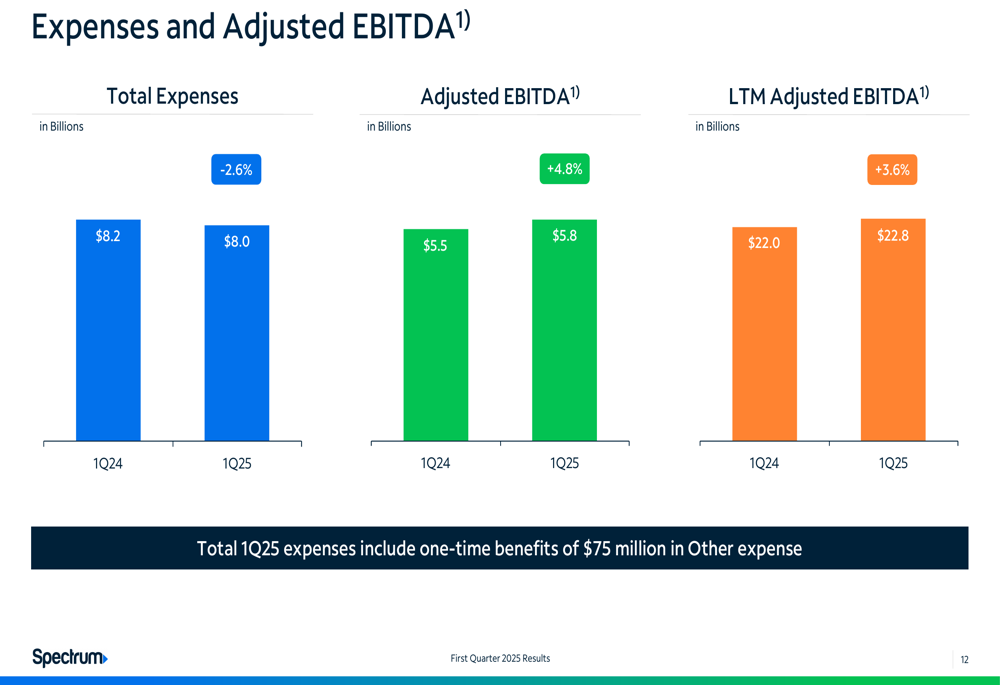
The company’s last twelve months (LTM) Adjusted EBITDA reached $22.8 billion, representing a 3.6% increase compared to the prior year period. Total (EPA:TTEF) expenses in Q1 2025 decreased by 2.6% to $8.0 billion, which included one-time benefits of $75 million in the "Other expense" category.
Customer Trends and Segment Performance
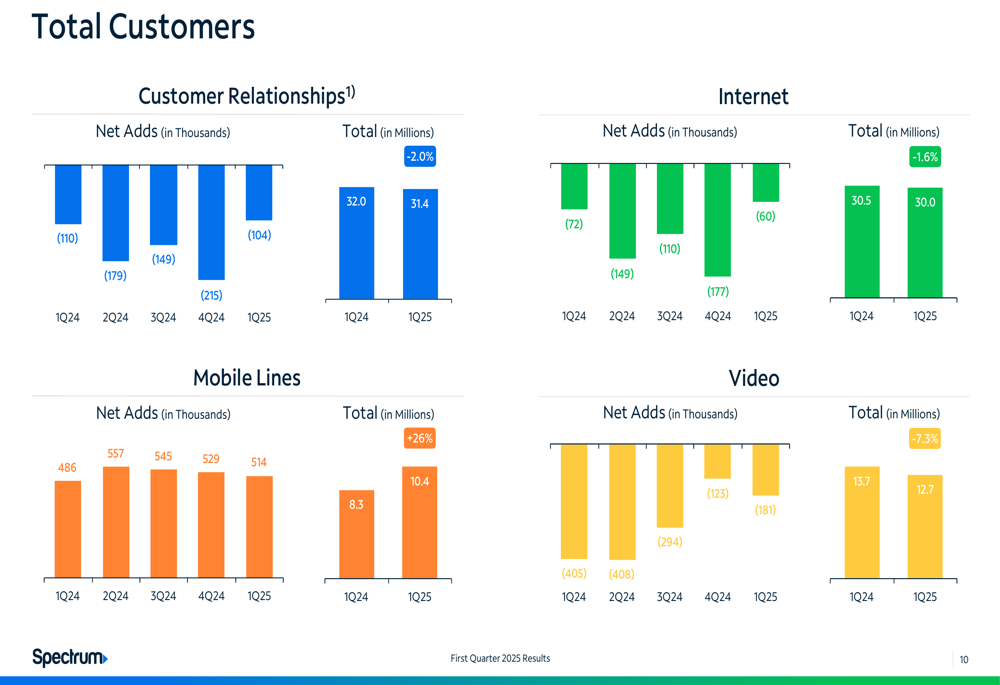
Charter’s customer metrics revealed contrasting trends across its business segments. Total customer relationships declined 2.0% year-over-year to 31.4 million, while internet customers decreased 1.6% to 30.0 million. Video customers continued their downward trajectory, falling 7.3% to 12.7 million.
The standout performer was the mobile segment, which grew substantially with a 26% year-over-year increase to 10.4 million lines. This growth in mobile lines has become increasingly important to Charter’s overall strategy and financial performance.
The following chart illustrates these customer trends across segments:
Revenue performance by segment showed mixed results. Residential revenue was essentially flat at $10.8 billion (-0.1% year-over-year), while commercial revenue increased by 1.4% to $1.8 billion.
Competitive Positioning
Charter emphasized its competitive advantages in the presentation, particularly regarding network capabilities and pricing. The company highlighted its 57 million gig-capable wireline passings compared to AT&T (NYSE:T)’s 30 million, Verizon (NYSE:VZ)’s 26 million, and T-Mobile’s 2 million.
The presentation showcased Charter’s seamless connectivity capabilities, claiming 100% current and future coverage compared to significantly lower percentages for competitors:
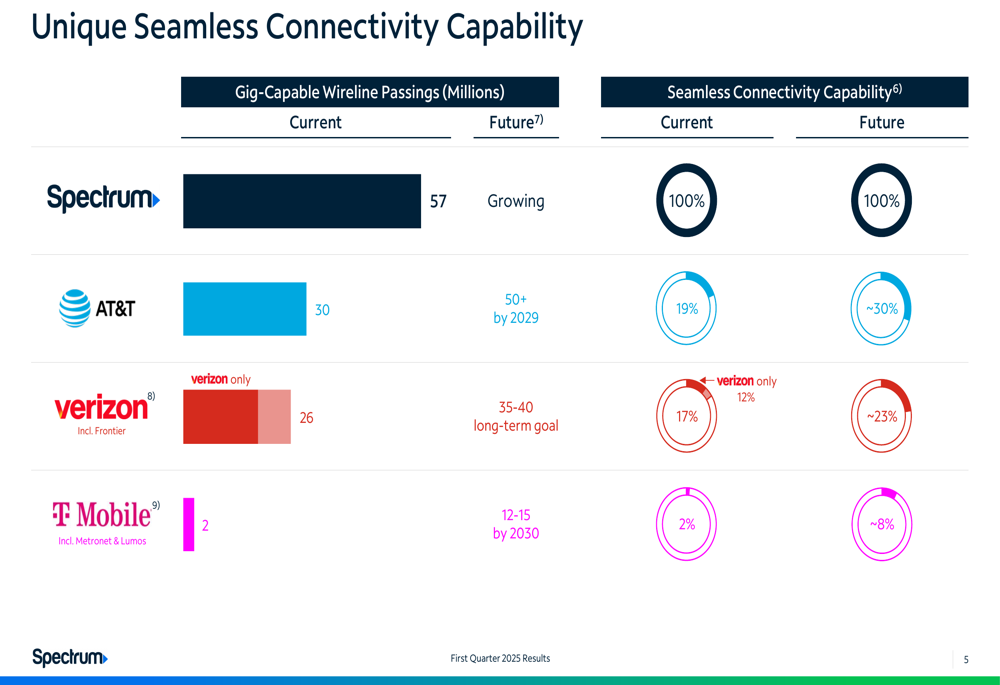
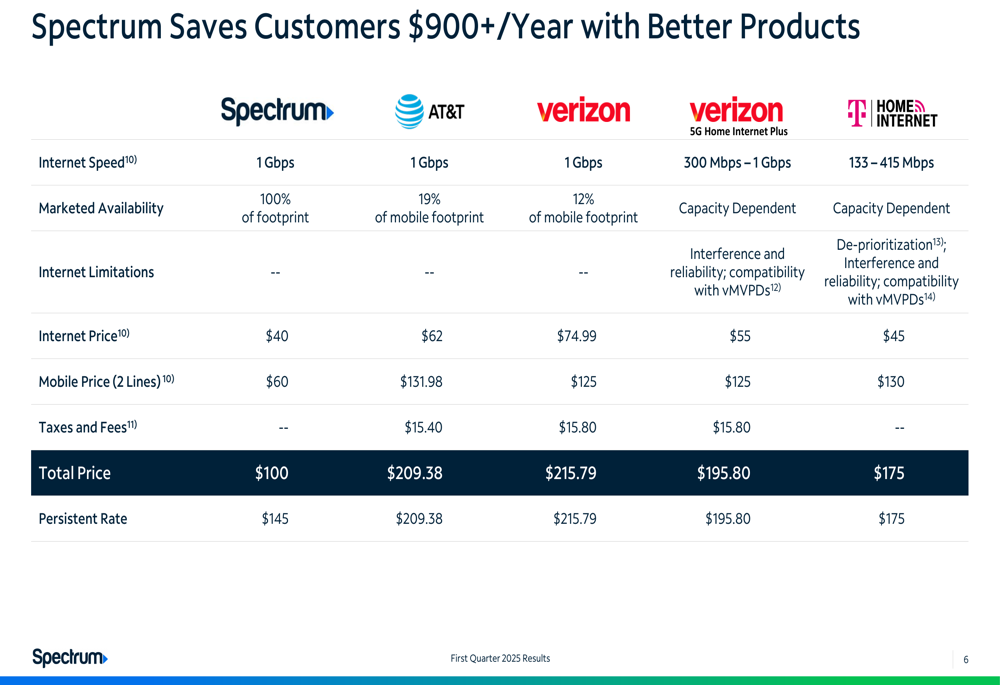
Charter also positioned its pricing as more competitive than rivals, showcasing a combined internet and mobile offering at $100 including taxes and fees, compared to AT&T ($209.38), Verizon ($215.79), and T-Mobile ($175). The company’s 1 Gbps internet service is priced at $40, substantially lower than competitors’ offerings.
The following chart details Charter’s value proposition compared to competitors:
Capital Allocation and Financial Strategy
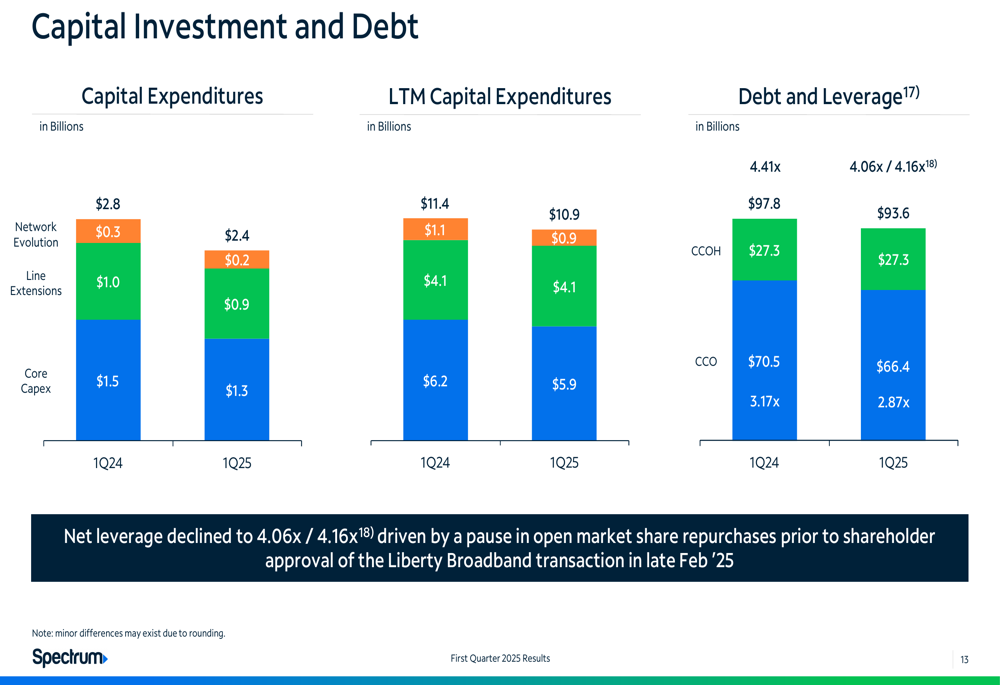
Charter’s capital expenditures for Q1 2025 totaled $2.4 billion, down from $2.8 billion in Q1 2024. The breakdown included $0.2 billion for network evolution, $0.9 billion for line extensions, and $1.3 billion for core capex. Last twelve months capital expenditures were $10.9 billion, compared to $11.4 billion in the prior period.
The company’s debt leverage improved to 4.06x/4.16x in Q1 2025, down from 4.41x in Q1 2024. Charter noted that net leverage declined due to a pause in open market share repurchases prior to shareholder approval of the Liberty Broadband (NASDAQ:LBRDA) transaction.
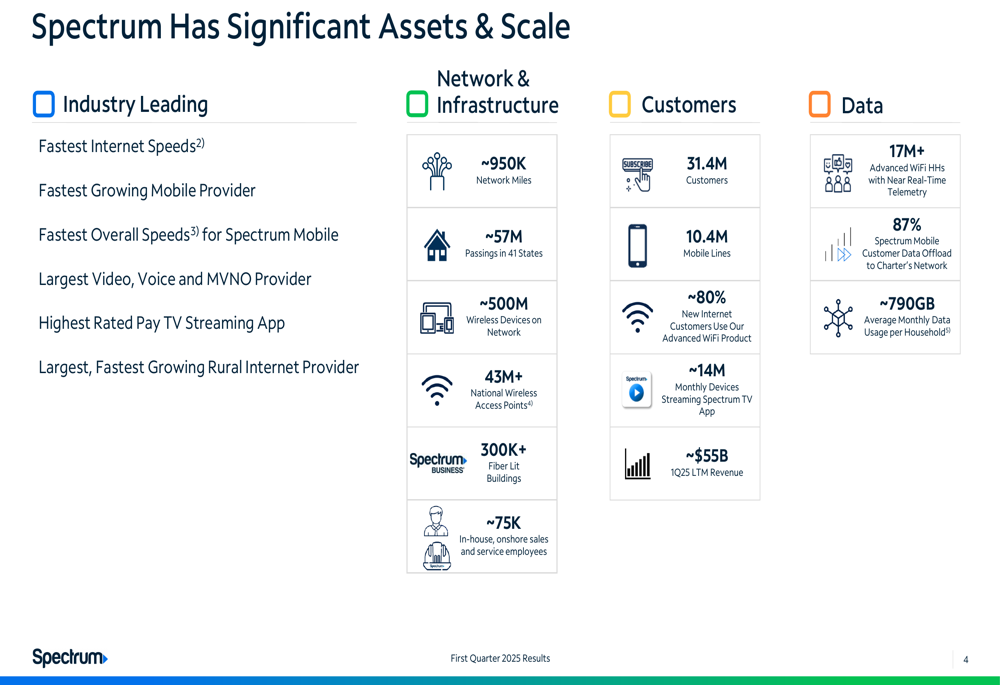
Charter’s extensive network assets and scale were highlighted as key competitive advantages, with approximately 950,000 network miles, 57 million passings in 41 states, and over 31.4 million customers.
Strategic Initiatives and Forward Outlook
Charter outlined its strategy to drive long-term value, focusing on three key areas: Operating Strategy, Strategic Initiatives, and Shareholder Value. The operating strategy emphasizes high-quality products, unique customer value, commitment to service, and ties to local communities. Strategic initiatives include evolution, expansion, and execution, while shareholder value is expected to be driven by long-term revenue growth, long-term cash flow growth, and levered equity returns.
The company also highlighted its entertainment offerings through integration with Xumo, providing access to streaming apps such as Max, Disney+, ESPN+, Paramount+, and others, with an estimated customer value of $60-$82.
Based on the previous earnings call, Charter projects capital expenditures of approximately $12 billion for 2025, with expectations for these to decline to under $8 billion by 2028. The company has maintained its focus on growing EBITDA in 2025 while continuing network expansion and evolution.
With the mobile segment showing strong growth and operational efficiencies driving improved profitability, Charter appears positioned to navigate the ongoing shifts in its traditional business segments while capitalizing on new growth opportunities.
Full presentation:
This article was generated with the support of AI and reviewed by an editor. For more information see our T&C.