Top U.S. Defense Stocks to Watch According to Jefferies Analysis

Executive Summary
CNA Financial Corporation (NYSE:CNA) reported a 3% increase in core income to $335 million for the second quarter of 2025, despite a decrease in net income to $299 million from $317 million in the prior year quarter. The insurance company’s results, presented on August 4, 2025, showed strong performance in its Property & Casualty (P&C) operations and investment portfolio, which helped offset challenges in other segments.
Net investment income rose 7% year-over-year to $662 million, while the P&C combined ratio improved to 94.1% from 94.8% in the prior year quarter. The company’s board declared a regular quarterly cash dividend of $0.46 per share.
"P&C core income of $448 million versus $380 million reflects higher net investment income and improved current accident year underwriting results," the company stated in its presentation.
Quarterly Performance Highlights
CNA’s second quarter financial results showed mixed performance across key metrics. While core income increased, net income decreased by 5.7% compared to Q2 2024. Core income per share rose to $1.23 from $1.19 in the prior year quarter, while net income per share fell to $1.10 from $1.17.
As shown in the following comprehensive financial performance table:
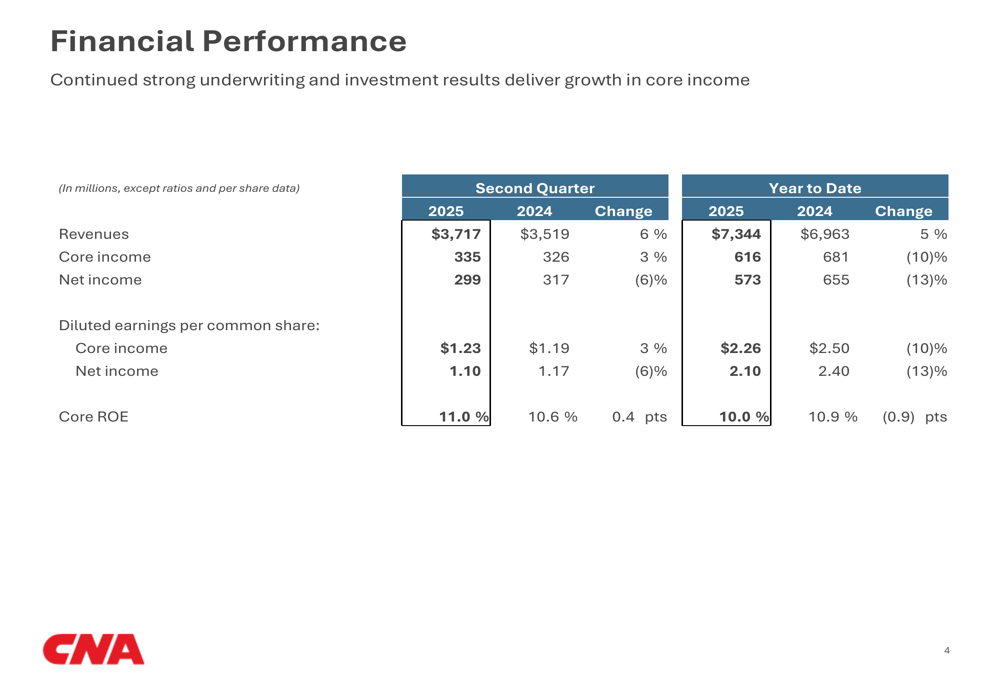
The company’s revenues increased by 5.6% to $3,717 million in Q2 2025 from $3,519 million in Q2 2024. However, year-to-date core income declined to $616 million from $681 million in the prior year period, representing a 9.5% decrease.
Catastrophe losses decreased to $62 million pretax in Q2 2025 from $82 million in Q2 2024, contributing to the improved P&C combined ratio. The P&C underlying combined ratio remained relatively stable at 91.7% compared to 91.6% in the prior year quarter.
Segment Analysis
CNA’s three main P&C segments - Specialty, Commercial, and International - showed varying performance in the second quarter.
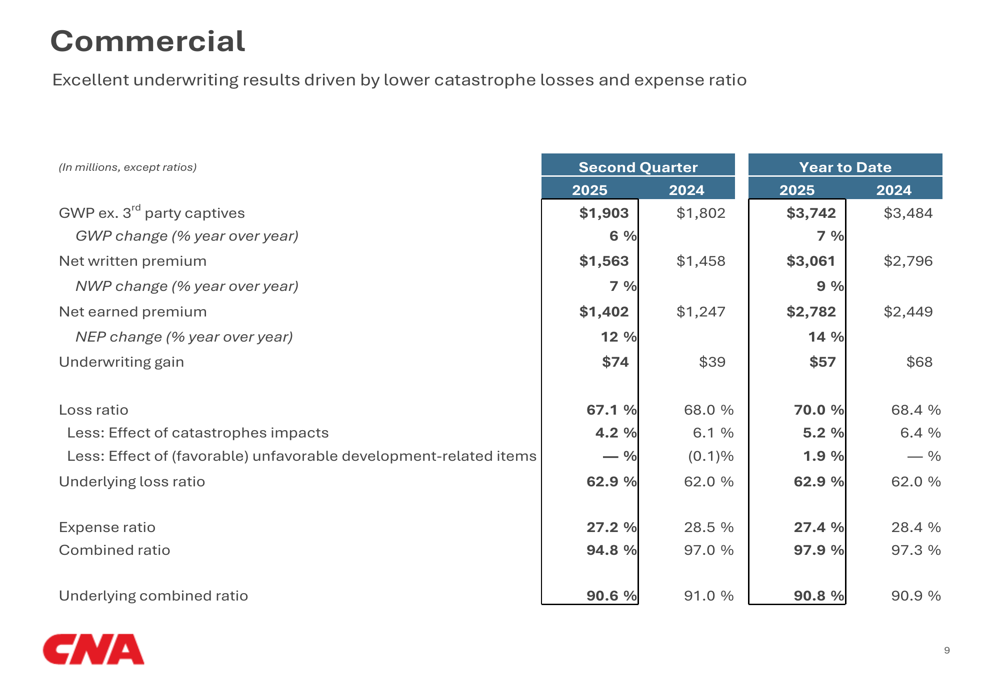
The Commercial segment demonstrated the strongest growth, with gross written premiums increasing by 6% year-over-year to $1,903 million and net written premiums rising by 7% to $1,563 million. The segment’s combined ratio improved to 94.8% from 97.0% in the prior year quarter, while its underlying combined ratio improved slightly to 90.6% from 91.0%.
As shown in the detailed Commercial segment results:
The Specialty segment showed more modest growth, with gross written premiums increasing by 3% year-over-year to $1,013 million and net written premiums rising by 4% to $892 million. However, the segment’s combined ratio deteriorated to 93.6% from 92.7% in the prior year quarter.
The International segment reported 5% growth in gross written premiums to $437 million and 9% growth in net written premiums to $391 million. Similar to the Specialty segment, its combined ratio worsened slightly to 92.8% from 91.9% in the prior year quarter.
The company’s rate and retention metrics across segments show varying pricing dynamics:
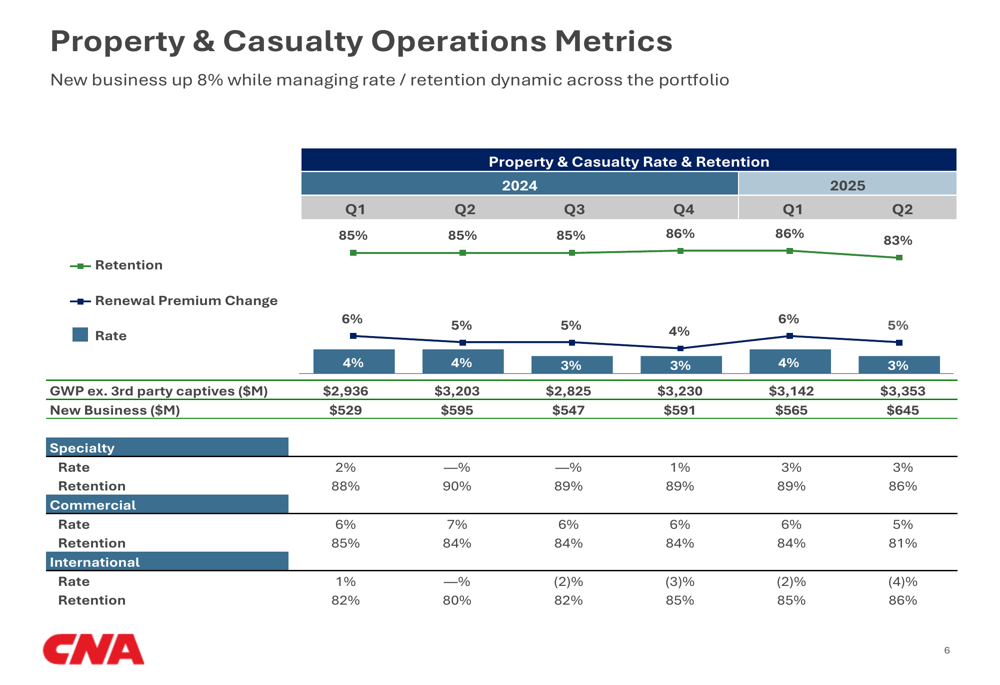
Commercial lines showed the strongest rate increases, particularly in Construction (8-10%) and National Accounts (0-8%), while International rates were flat to slightly negative. Specialty rates varied by subsegment, with Medical (TASE:BLWV) Malpractice showing the strongest increases (7-9%).
Investment Portfolio and Income
A key driver of CNA’s improved Q2 results was its strong investment performance. Net investment income increased by 7% year-over-year to $662 million, with fixed income securities contributing $544 million (up from $520 million in Q2 2024) and limited partnerships and common stock contributing $100 million (up from $78 million).
The following chart illustrates the consistent growth in pretax net investment income over the past five quarters:
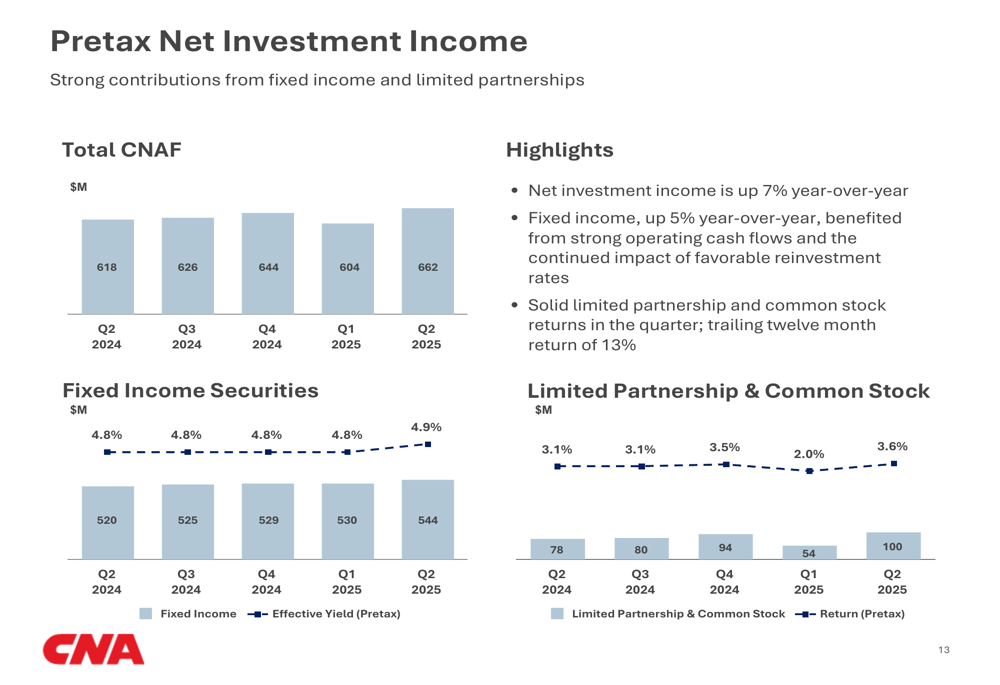
The effective yield on fixed income securities improved slightly to 4.9% from 4.8% in the prior year quarter, while the trailing twelve-month return on limited partnerships and common stock increased to 3.6% from 3.1%.
CNA’s investment portfolio remains conservatively positioned, with a strong focus on fixed income securities. The portfolio composition and credit quality are illustrated in the following chart:
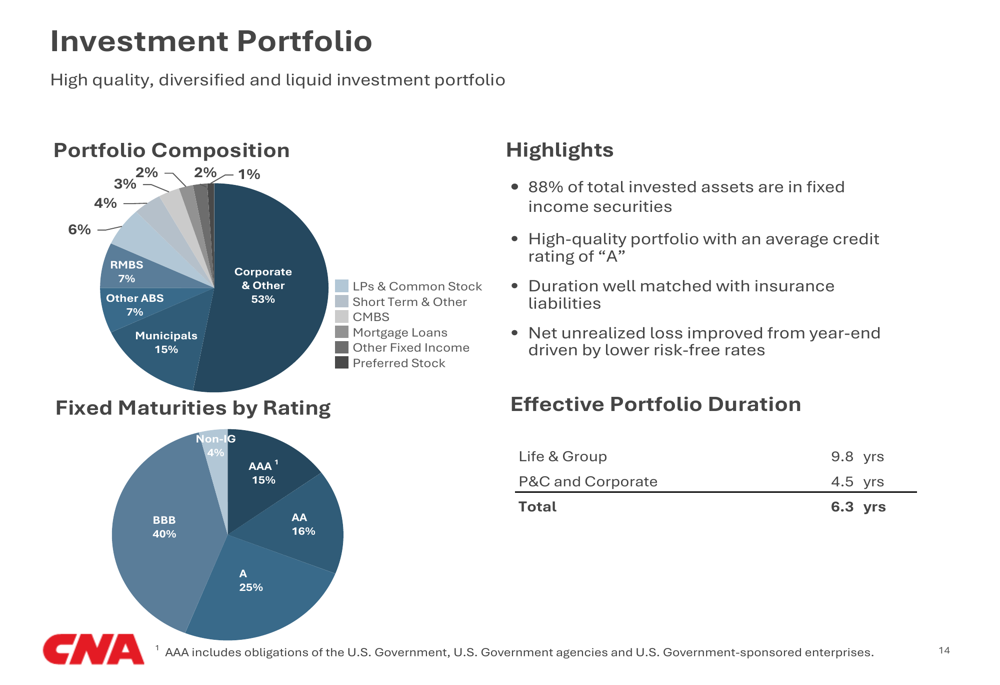
Corporate bonds represent the largest allocation at 53% of the portfolio, followed by municipals at 15%. The fixed maturity portfolio is predominantly investment grade, with only 4% rated below investment grade. The effective duration of the P&C and Corporate portfolio is 4.5 years, while the Life & Group portfolio has a longer duration of 9.8 years, reflecting the longer-term nature of those liabilities.
Financial Strength and Outlook
CNA maintains a strong financial position, with stockholders’ equity of $10,661 million as of June 30, 2025, up from $10,513 million at year-end 2024. The company’s debt-to-capital ratio improved slightly to 21.8% from 22.0% at year-end.
The following table summarizes CNA’s key financial strength metrics:
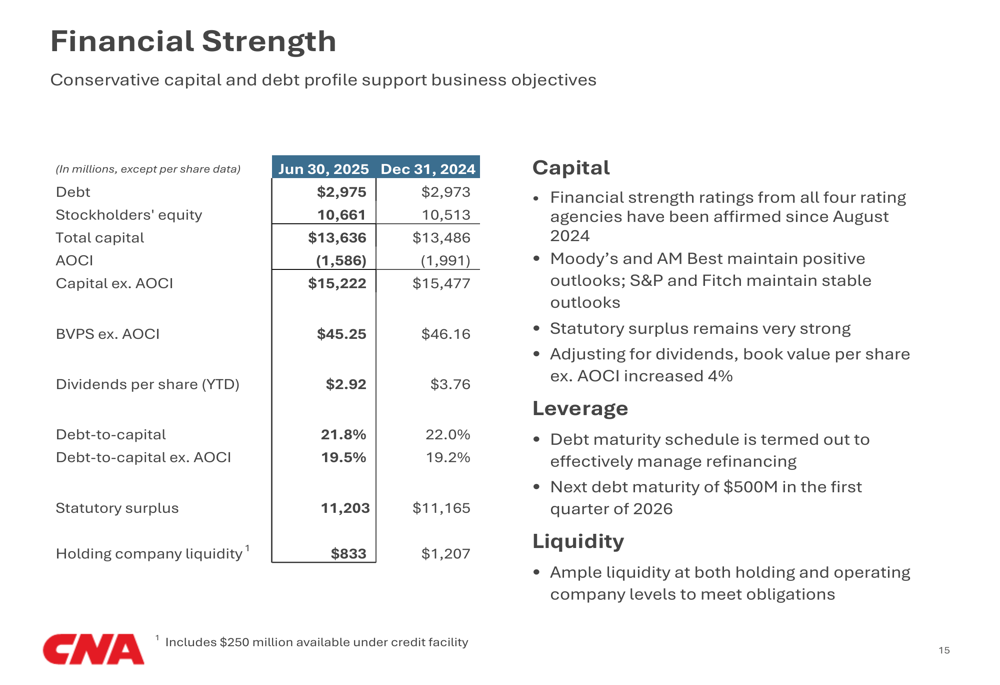
Book value per share excluding accumulated other comprehensive income (AOCI) was $45.25, representing a 4% increase from year-end 2024 after adjusting for $2.92 of dividends per share paid. Statutory surplus remained strong at $11,203 million, providing a solid foundation for the company’s operations.
The company noted that financial strength ratings from all four major rating agencies have been affirmed since August 2024, with Moody’s and AM Best maintaining positive outlooks, while S&P and Fitch maintain stable outlooks.
CNA’s next debt maturity of $500 million is scheduled for the first quarter of 2026, and the company maintains ample liquidity at both holding and operating company levels to meet its obligations.
Life & Group and Corporate Segments
While the P&C segments showed generally positive results, the Life & Group segment reported a modest core income of $1 million in Q2 2025, compared to a core loss of $1 million in the prior year quarter. Net investment income in this segment decreased slightly to $235 million from $239 million.
The Corporate & Other segment reported a core loss of $114 million, significantly worse than the $53 million core loss in Q2 2024. This included an $88 million after-tax charge related to unfavorable prior period development associated with legacy mass tort, compared with a $28 million after-tax charge in Q2 2024.
In conclusion, CNA Financial’s Q2 2025 results demonstrate the company’s ability to generate improved core income despite challenges in certain segments. Strong investment performance and solid P&C underwriting results helped offset these challenges, while the company maintains a strong financial position with ample liquidity and capital.
Full presentation:
This article was generated with the support of AI and reviewed by an editor. For more information see our T&C.