U.S. stocks edge higher with consumer sentiment data, AI boom in focus

Introduction & Market Context
CNO Financial Group (NYSE:CNO) presented its second quarter 2025 financial results on July 28, 2025, highlighting consistent growth across its business segments while maintaining a strong capital position. The company’s stock closed at $37.82, down 0.63% for the day, with a slight recovery of 0.37% in after-hours trading.
The results come after a challenging first quarter where the stock dropped 6.34% despite meeting earnings expectations, suggesting investors remain cautious about the broader economic environment despite CNO’s solid operational performance.
Quarterly Performance Highlights
CNO reported operating earnings per share of $0.87 for Q2 2025, demonstrating solid underlying business performance despite a year-over-year decrease from $1.05 in Q2 2024. The company highlighted its 12th consecutive quarter of strong sales momentum across multiple product lines.
As shown in the following comprehensive growth scorecard, CNO achieved double-digit growth in several key metrics:
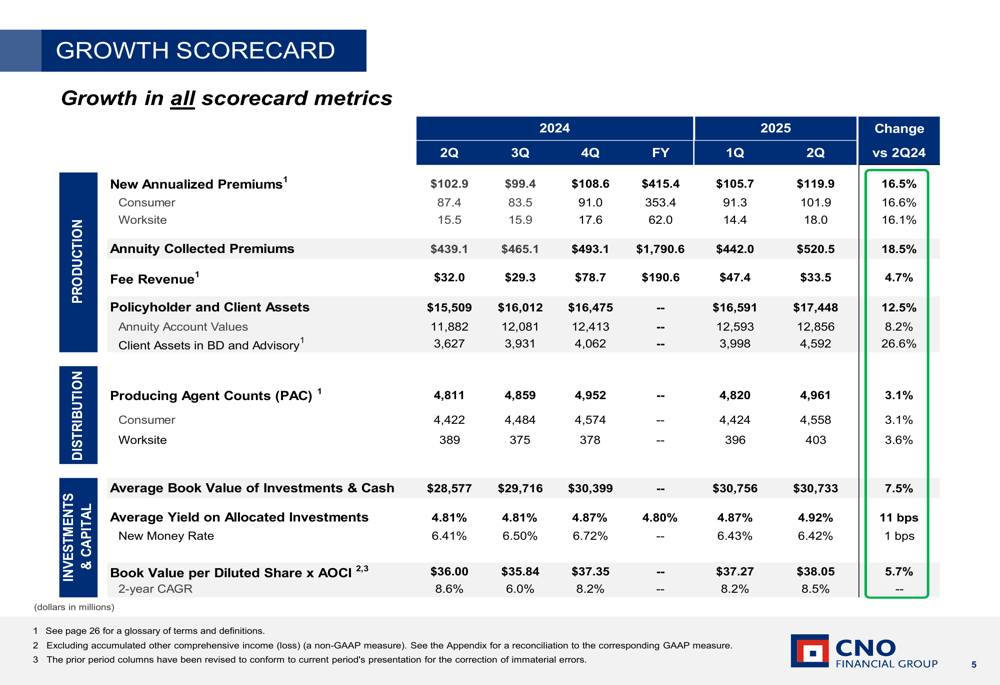
Total (EPA:TTEF) new annualized premiums increased 16.5% year-over-year to $119.9 million, with the Consumer division growing 16.6% and the Worksite division up 16.1%. Annuity collected premiums rose 18.5% to $520.5 million, while policyholder and client assets grew 12.5% to $17,448 million.
The company’s operating return on equity excluding significant items was 11.2%, supporting its long-term target of improving run-rate operating ROE by 150 basis points through 2027. Book value per diluted share excluding AOCI increased 5.7% to $38.05.
CNO’s financial performance was driven by both operational growth and capital management, as illustrated in this earnings summary:
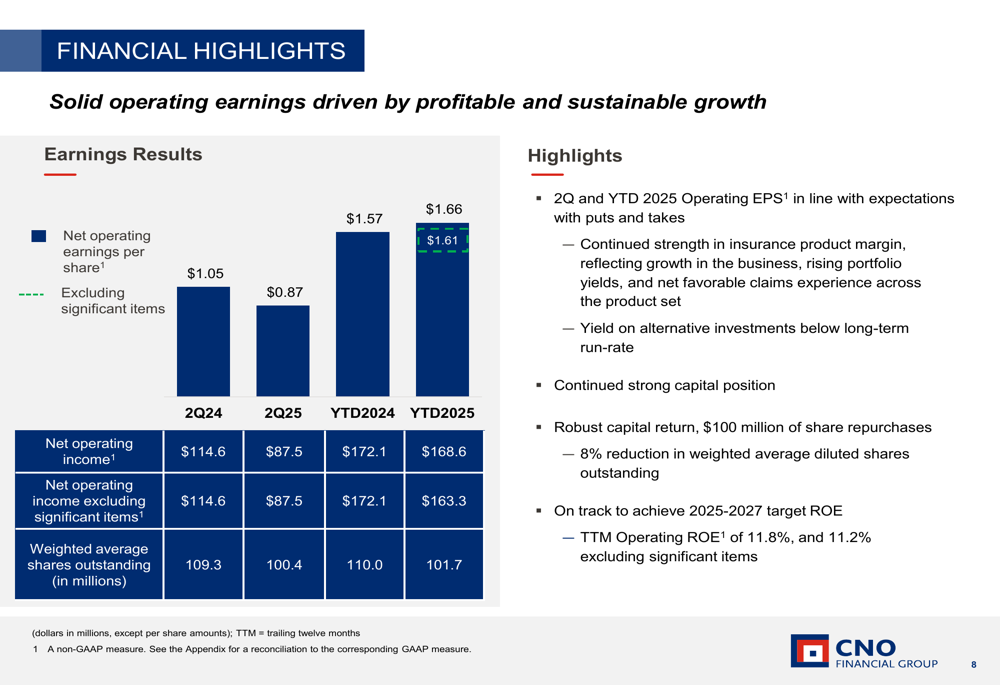
The company returned $117 million to shareholders during the quarter, including $100 million in share repurchases, bringing the year-to-date total to $234 million. This contributed to an 8% reduction in weighted average diluted shares outstanding compared to the prior year.
Distribution and Product Performance
CNO’s Consumer division delivered its 11th consecutive quarter of sustained growth, with nearly all products experiencing double-digit increases. The division achieved record annuity collected premiums (up 19%) and record client assets in brokerage and advisory (up 27%).
The following slide details the Consumer division’s impressive performance across multiple product lines:
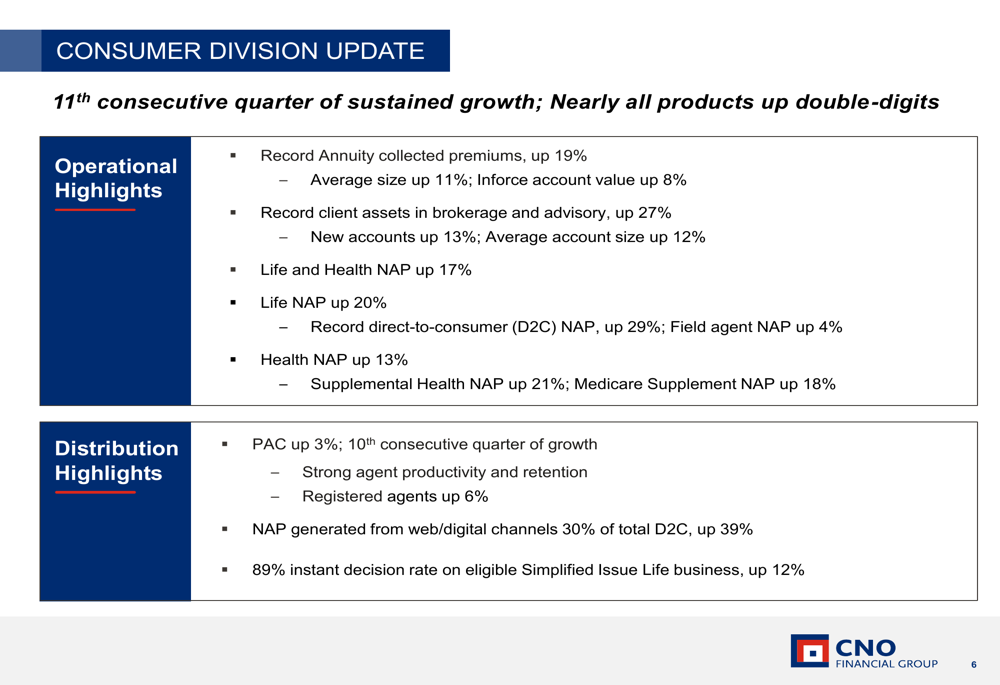
Life NAP grew 20%, with direct-to-consumer NAP up 29% and field agent NAP up 4%. Health NAP increased 13%, with supplemental health NAP up 21% and Medicare Supplement NAP up 18%. The division also reported its 10th consecutive quarter of growth in producing agent counts, up 3% year-over-year.
Similarly, the Worksite division recorded its 13th consecutive quarter of NAP growth, with double-digit growth in 11 of the last 13 quarters:
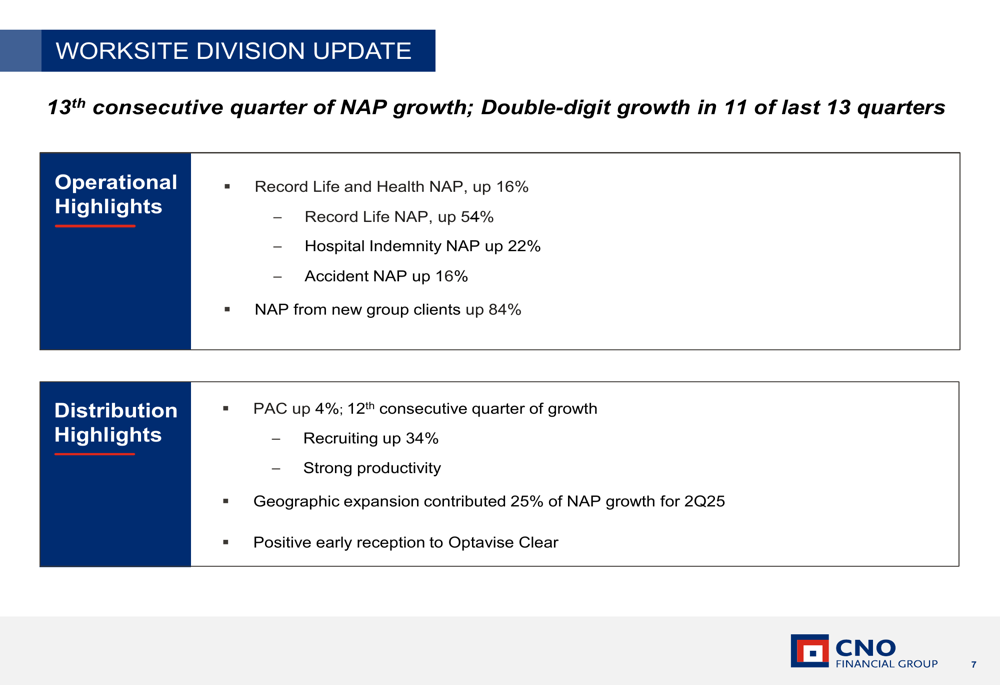
Worksite achieved record Life and Health NAP, up 16% year-over-year, with Life NAP increasing by an impressive 54%. The division also reported strong growth in new group clients, with NAP from this segment up 84%. Geographic expansion contributed 25% of NAP growth for the quarter.
Investment and Capital Position
CNO’s investment portfolio continued to perform well, with the company reporting its 7th consecutive quarter of growth in net investment income. Investment income allocated to product lines increased 7% year-over-year to $269.0 million, while total net investment income rose 2% to $302.8 million.
The company’s investment results are summarized in the following slide:
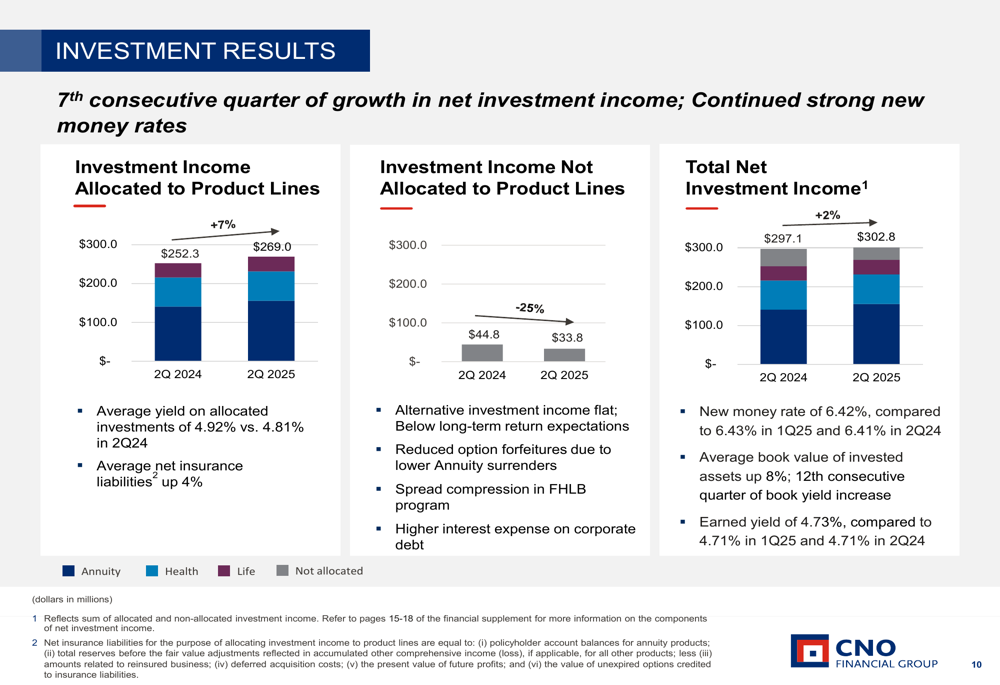
The average yield on allocated investments improved to 4.92%, up from 4.81% in Q2 2024. CNO maintained a strong new money rate of 6.42%, marking the 10th consecutive quarter above 6%. This consistent performance has helped support the company’s overall financial results.
CNO’s $29 billion investment portfolio remains high-quality and well-diversified, as illustrated below:
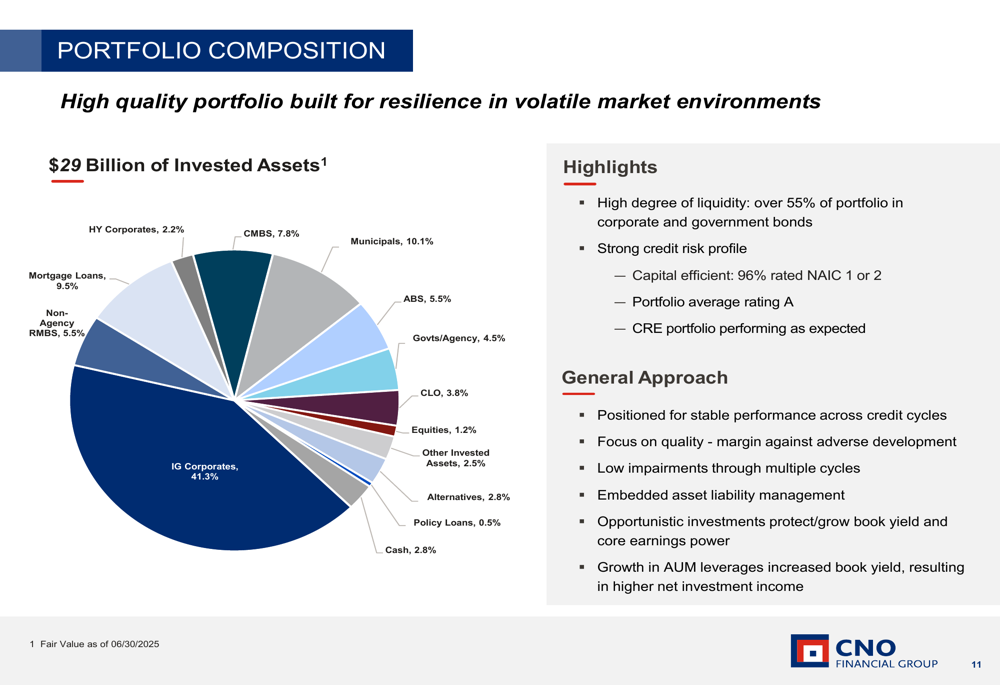
The portfolio is built for resilience in volatile market environments, with 41.3% in investment-grade corporates, 10.1% in municipals, and 9.5% in mortgage loans. Over 55% of the portfolio is in highly liquid corporate and government bonds, reflecting the company’s conservative approach to risk management.
From a capital perspective, CNO remains well-positioned despite some metrics showing slight declines from previous periods:
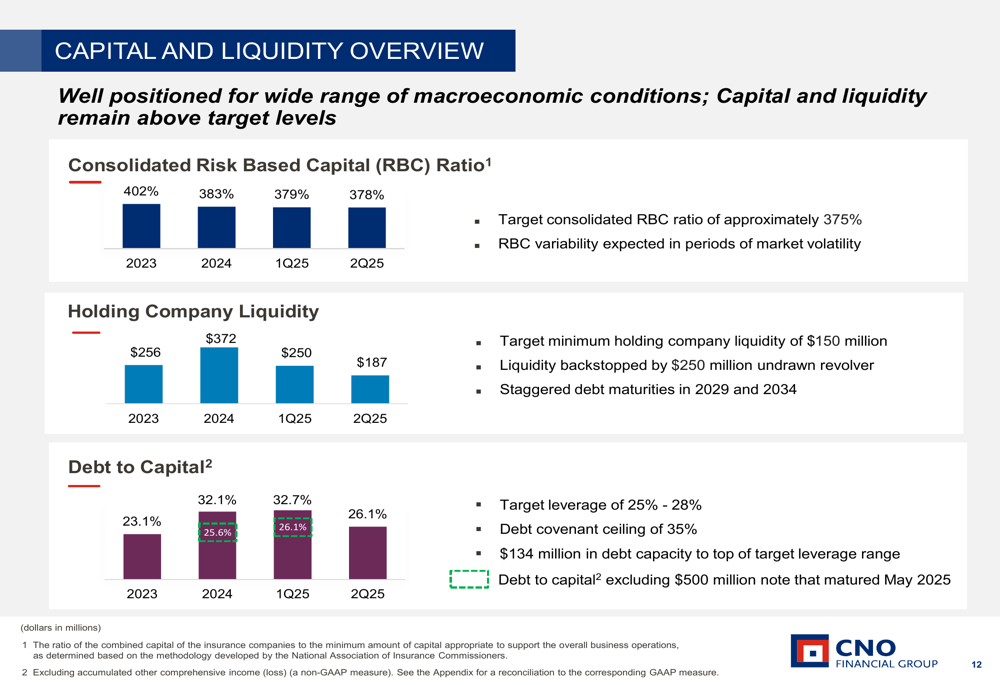
The consolidated Risk-Based Capital (RBC) ratio stood at 378%, down from 402% in 2023 but still well above regulatory requirements. Holding company liquidity was $187 million, while the debt-to-capital ratio increased to 26.1%, remaining within the target range of 25-28%.
Forward Guidance and Outlook
CNO reaffirmed its full-year 2025 guidance and three-year ROE targets, while narrowing its expense ratio range:
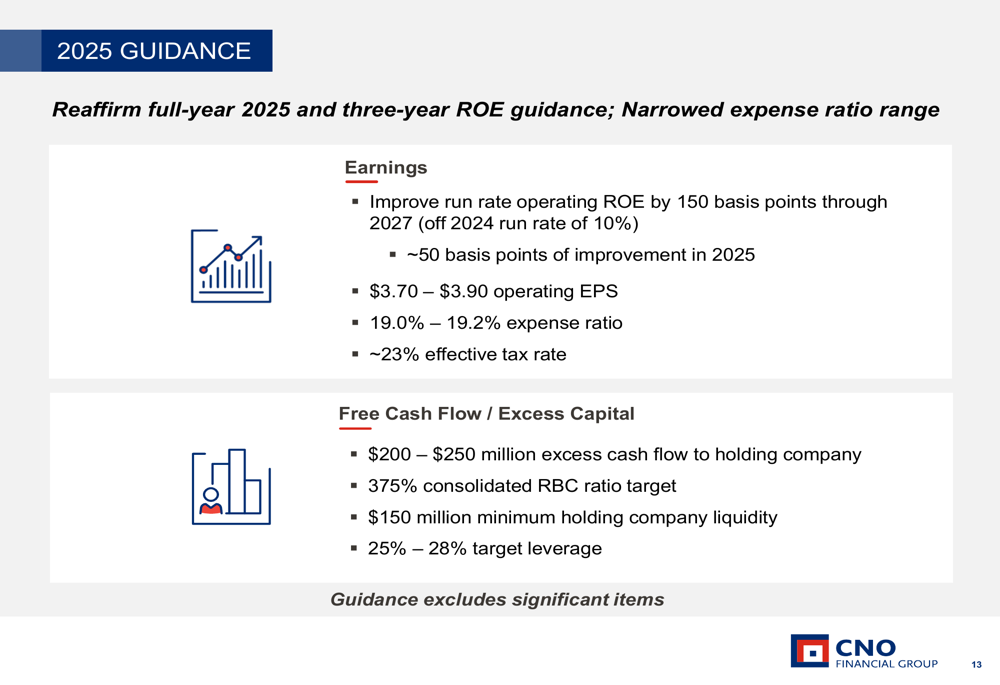
The company continues to target operating EPS of $3.70-$3.90 for 2025, with an expense ratio of 19.0-19.2% and an effective tax rate of approximately 23%. CNO expects to generate $200-250 million in excess cash flow to the holding company and maintain its 375% consolidated RBC ratio target.
Looking ahead, CNO emphasized several compelling reasons for investors to consider the company, including its exclusive focus on the underserved middle-income market, significant demographic tailwinds, and diverse distribution model combining in-person and virtual capabilities.
The company’s insurance product margin demonstrates the resilience of its diversified product set, with total margin slightly favorable to run-rate expectations:
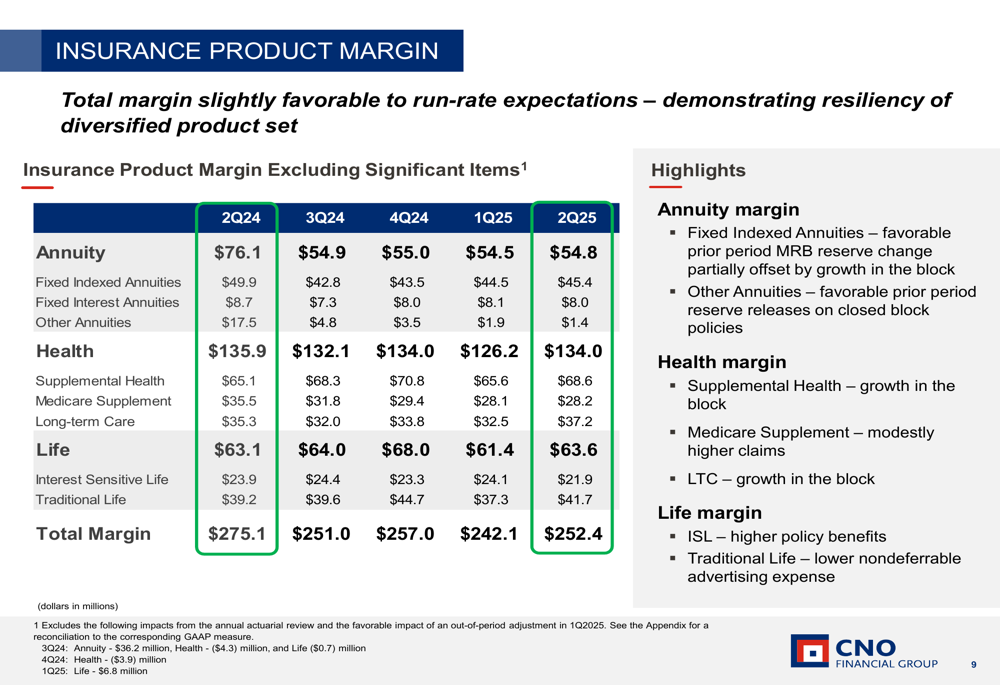
Total insurance product margin excluding significant items was $252.4 million in Q2 2025, with Health contributing $134.0 million, Life $63.6 million, and Annuity $54.8 million. This diversification helps insulate the company from volatility in any single product line.
CNO’s performance in the second quarter of 2025 reflects its continued execution of strategic initiatives focused on profitable growth and improved returns. Despite some challenges, the company’s consistent operational results and strong capital position provide a solid foundation for achieving its long-term objectives in serving the middle-income American market.
Full presentation:
This article was generated with the support of AI and reviewed by an editor. For more information see our T&C.