Hyperscale Data reduces debt by $30 million for AI, bitcoin expansion

Introduction & Market Context
Columbus (WA:CLC) A/S (CPH:COLUM) presented its Q1 2025 financial results on May 8, 2025, revealing a mixed performance characterized by declining revenue but significantly improved profitability. The company’s stock reacted negatively to the results, trading down 1.76% to DKK 11.35 following the presentation, despite the improved earnings metrics.
The IT services provider faced challenging conditions in Nordic markets while experiencing strong growth in the UK and US regions. This geographic divergence, combined with improved project execution and cost discipline, helped Columbus deliver substantial EBITDA growth despite the overall revenue decline.
Quarterly Performance Highlights
Columbus reported Q1 2025 revenue of DKK 434 million, representing a 2% decrease from DKK 444 million in Q1 2024. Despite this top-line decline, the company achieved significant improvements in profitability metrics, with contribution margin increasing to 25% from 23% in the prior year period.
Most notably, EBITDA surged by 32% to DKK 46 million compared to DKK 35 million in Q1 2024, reflecting enhanced operational efficiency and improved project execution. However, cash flow from operating activities decreased by 27% to DKK 17 million from DKK 23 million in the comparable period.
As shown in the following financial highlights chart:
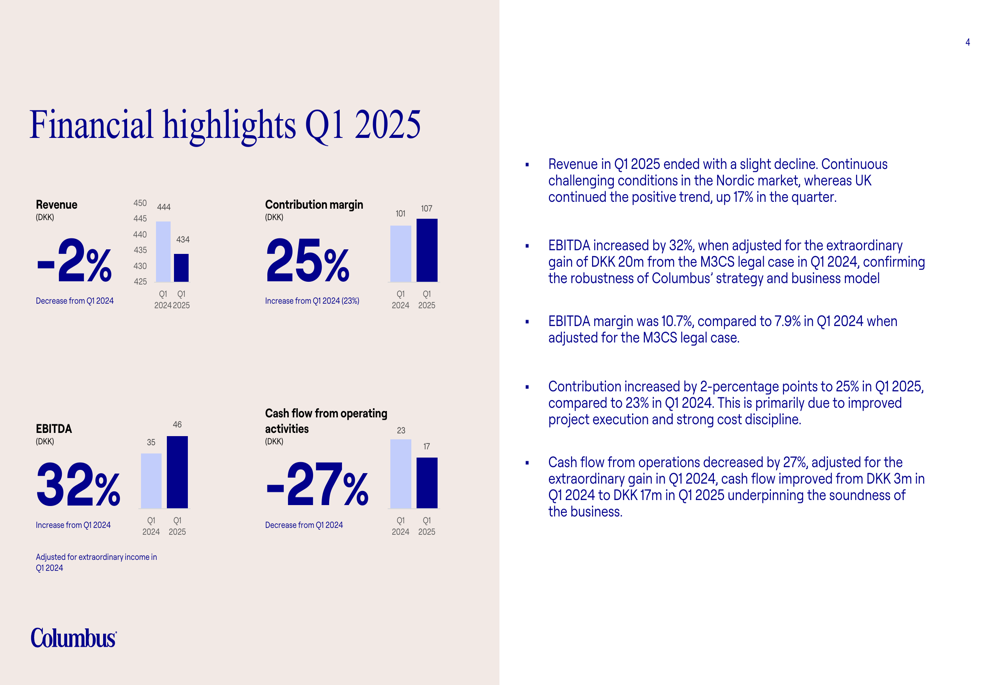
The company attributed its improved profitability to better project execution and strong cost discipline, which helped offset the revenue challenges. This represents a continuation of the positive EBITDA trend observed in Q4 2024, when the company reported a 30% increase in EBITDA.
Business Line Performance
Columbus’s business segments delivered mixed results in Q1 2025. The company’s Data & AI division emerged as the standout performer with 28% revenue growth, while traditional business lines experienced declines.
The service revenue breakdown by business line reveals the following performance:
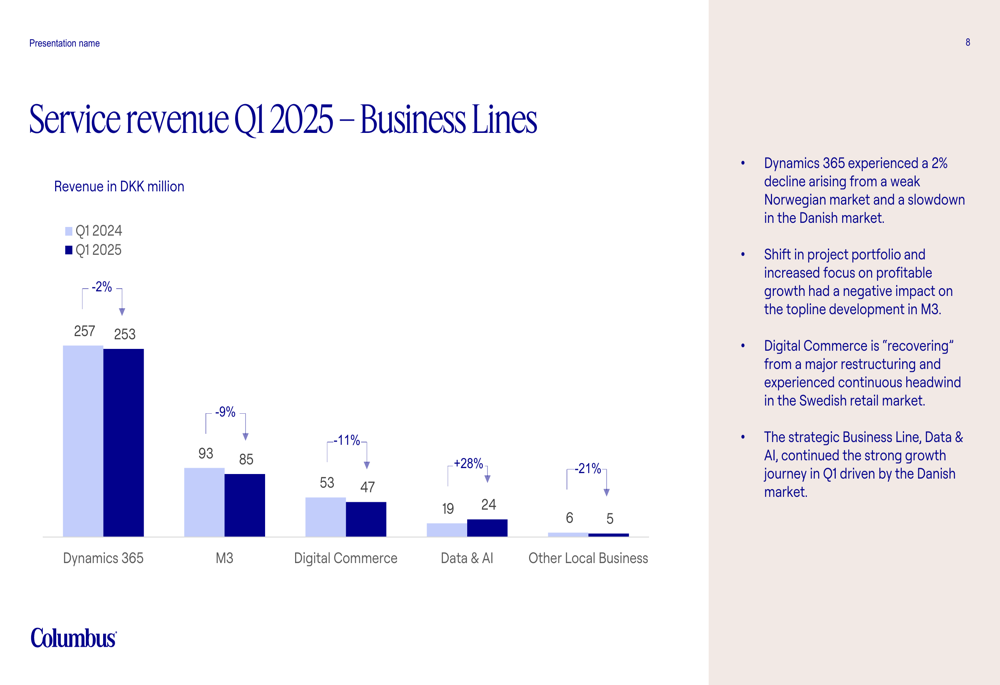
Dynamics 365, the company’s largest business segment, saw a modest 2% revenue decline to DKK 253 million but managed to improve its contribution margin by 1 percentage point to 26%. The M3 business line experienced a more significant 9% revenue drop to DKK 85 million with a corresponding 1 percentage point decrease in contribution margin to 25%.
Digital Commerce revenue fell by 11% to DKK 47 million while maintaining its contribution margin at 11%. The most dramatic improvement came from the Data & AI segment, which not only grew revenue by 28% to DKK 24 million but also increased its contribution margin by 21 percentage points to 22%.
The following chart illustrates the contribution margin developments across business lines:
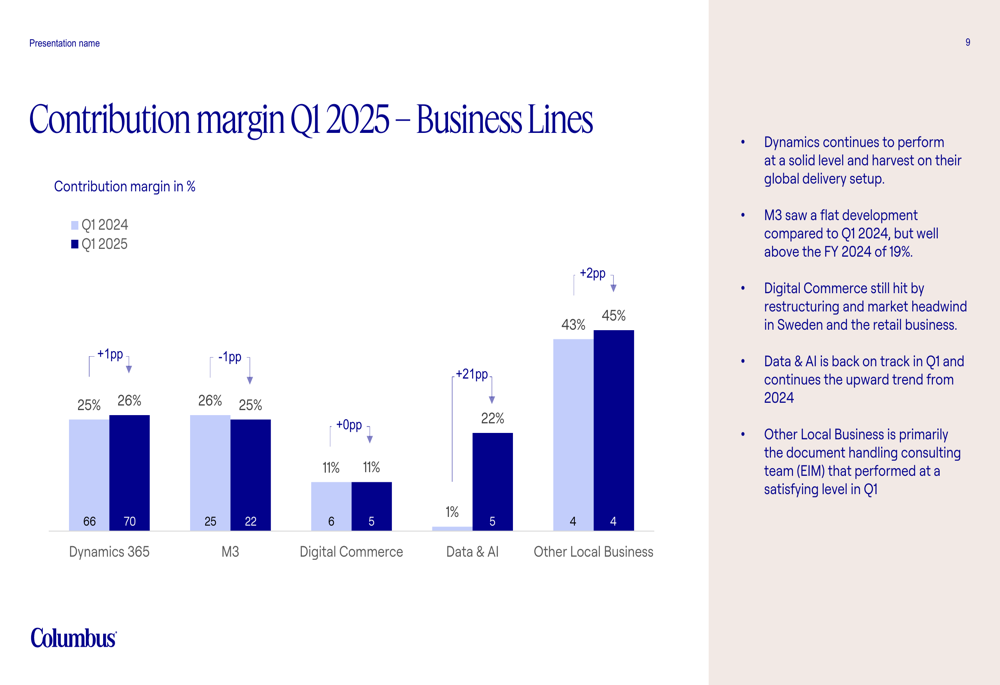
This divergence in business line performance suggests Columbus is successfully pivoting toward higher-growth areas like Data & AI while managing the maturation of its traditional ERP implementation services.
Geographic Market Analysis
Columbus’s Q1 2025 results revealed stark geographic contrasts, with Nordic markets underperforming while the UK and US delivered strong growth. This regional divergence is clearly illustrated in the service revenue breakdown by market units:
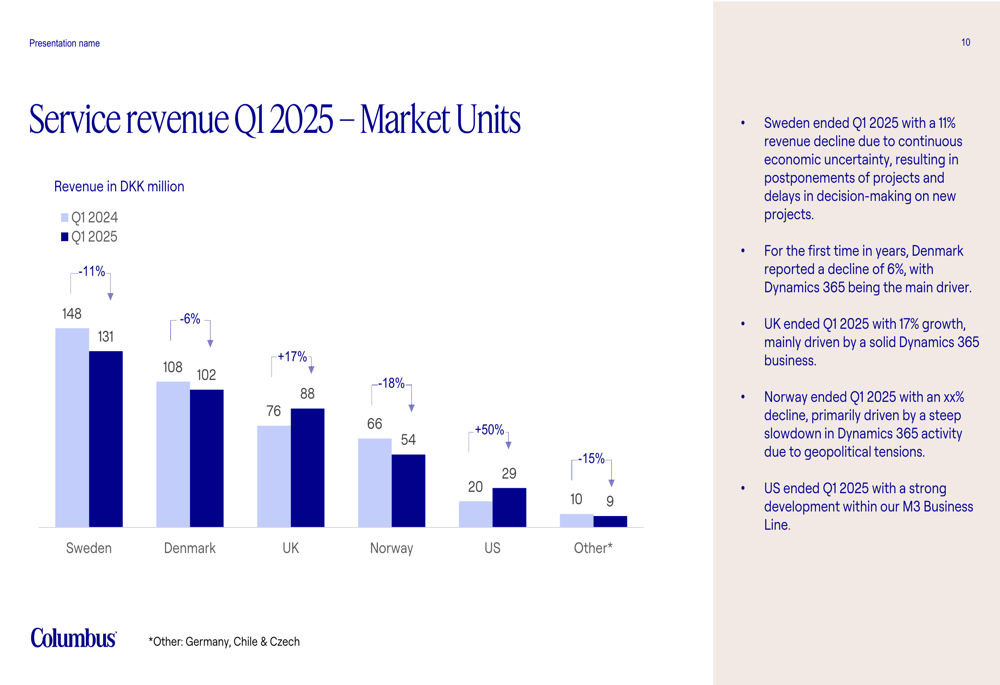
The Nordic markets collectively underperformed, with Sweden experiencing an 11% revenue decline to DKK 131 million, Denmark down 6% to DKK 102 million, and Norway posting the steepest drop of 18% to DKK 54 million. These declines align with the "challenging conditions in the Nordic market" highlighted in the company’s presentation.
In contrast, the UK market grew by 17% to DKK 88 million, while the US market delivered exceptional 50% growth to reach DKK 29 million. These growth markets partially offset the Nordic weakness, helping to limit the overall revenue decline to 2%.
This geographic performance represents a continuation of trends observed in Q4 2024, when the company also reported challenges in the Swedish market while capitalizing on opportunities in the UK and US.
Strategic Initiatives and Outlook
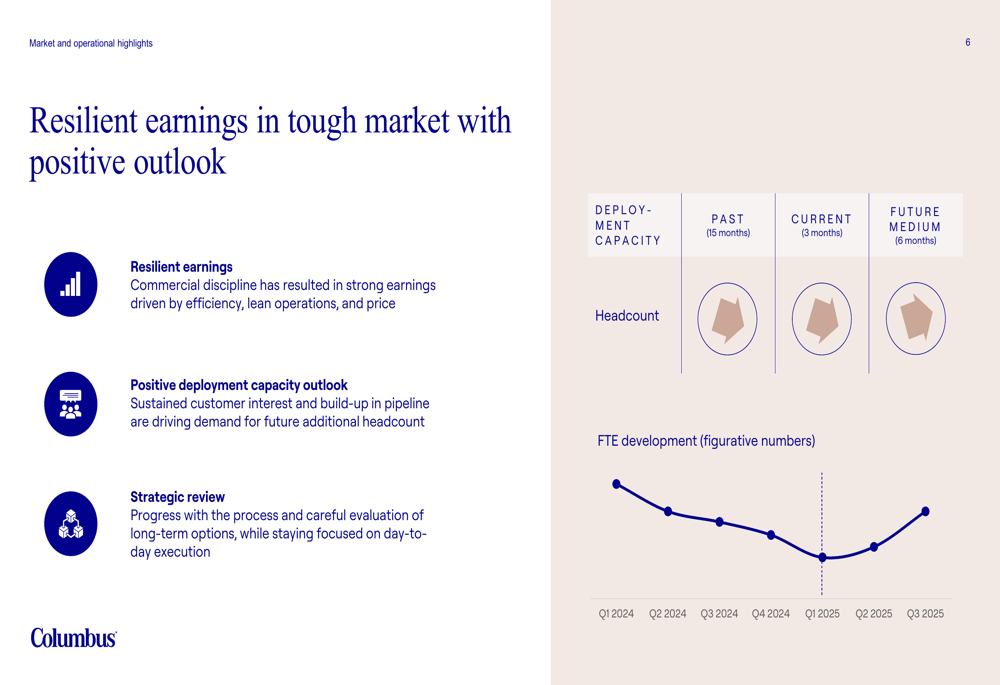
Columbus highlighted its resilient earnings despite market challenges and pointed to a positive deployment capacity outlook driven by customer interest and pipeline growth. The company is also making progress on a strategic review with careful evaluation of long-term options.
The following chart illustrates the company’s deployment capacity and FTE development:
Despite the Q1 revenue challenges, Columbus maintained its full-year guidance for 2025, projecting organic revenue growth of 7-9% and an EBITDA margin of 10-12%. This guidance, initially announced on January 17, 2025, suggests management expects improved performance in the remaining quarters of the year.
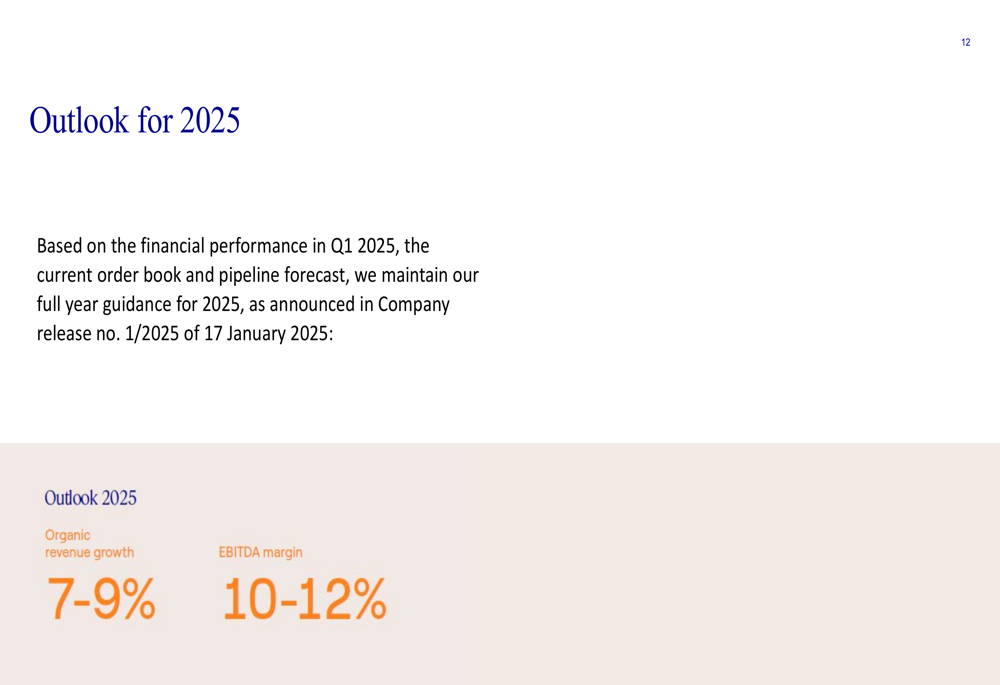
The maintained guidance aligns with the company’s Q4 2024 outlook, though it falls short of the longer-term target mentioned in previous communications of achieving 10% year-on-year organic growth and a 15% EBITDA margin by 2026.
Columbus’s ability to deliver on its 2025 guidance will likely depend on whether the positive trends in the UK and US markets can continue to offset the challenges in the Nordic region, and whether the company can successfully execute its strategic initiatives to drive growth in high-margin segments like Data & AI.
Full presentation:
This article was generated with the support of AI and reviewed by an editor. For more information see our T&C.