Is this U.S.-China selloff a buy? A top Wall Street voice weighs in

Introduction & Market Context
Crescent Capital BDC Inc (NASDAQ:CCAP) released its second quarter 2025 earnings presentation on August 14, showing modest sequential improvement following a disappointing first quarter. The business development company, which focuses on lending to private U.S. middle-market companies, reported net investment income of $0.46 per share, slightly up from $0.45 in the previous quarter but still below historical levels.
The presentation comes as CCAP’s stock continues to trade at a significant discount to its net asset value (NAV), closing at $14.60 on August 13, representing a 25% discount to the reported NAV of $19.55 per share. This discount reflects ongoing investor concerns about the sustainability of earnings and dividends in a changing interest rate environment.
Quarterly Performance Highlights
CCAP reported net income of $0.41 per share for Q2 2025, a substantial improvement from $0.11 in Q1, primarily driven by lower net unrealized losses. The company’s net asset value per share declined slightly to $19.55 from $19.62 in the previous quarter and $20.30 a year earlier.
As shown in the following financial highlights table, CCAP has experienced a gradual decline in net investment income over the past year, from $0.59 per share in Q2 2024 to the current $0.46:
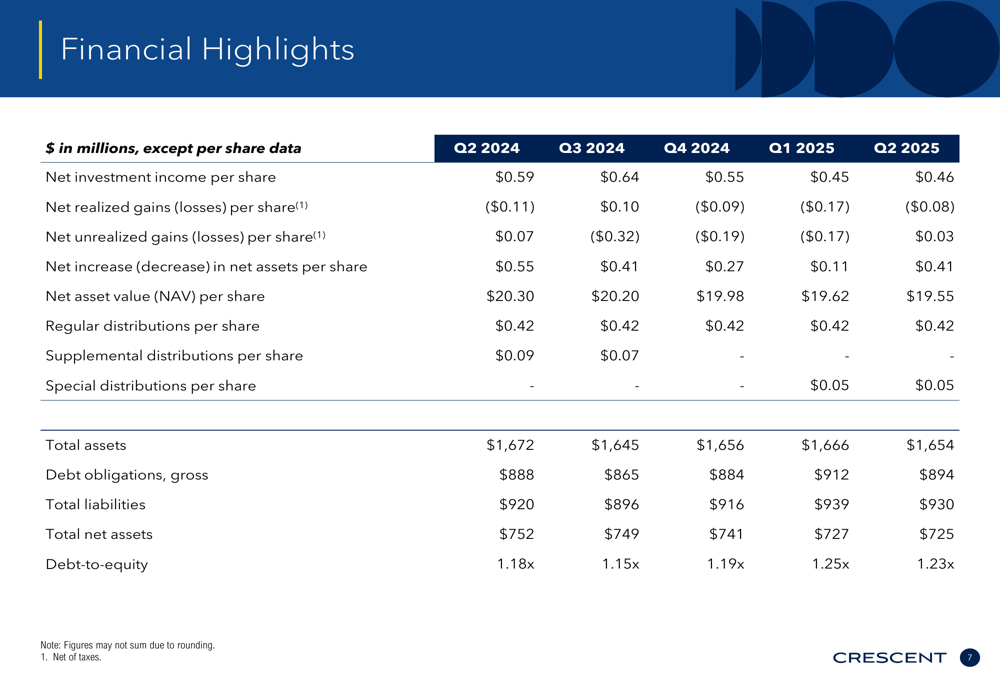
The company’s total assets stood at $1.65 billion at quarter-end, with debt obligations of $894 million resulting in a debt-to-equity ratio of 1.23x, slightly down from 1.25x in the previous quarter but up from 1.18x a year ago.
The following NAV bridge illustrates the components affecting the quarter’s NAV performance:
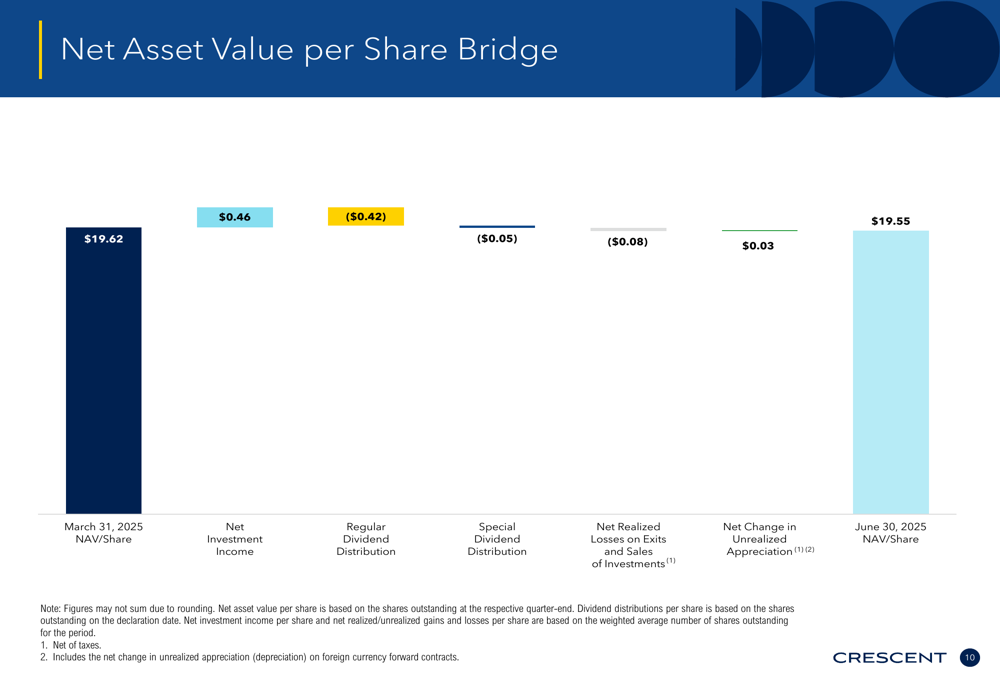
This visualization shows how net investment income of $0.46 was offset by regular and special dividend distributions totaling $0.47, along with net realized losses of $0.08, partially offset by unrealized appreciation of $0.03.
Portfolio Composition & Investment Activity
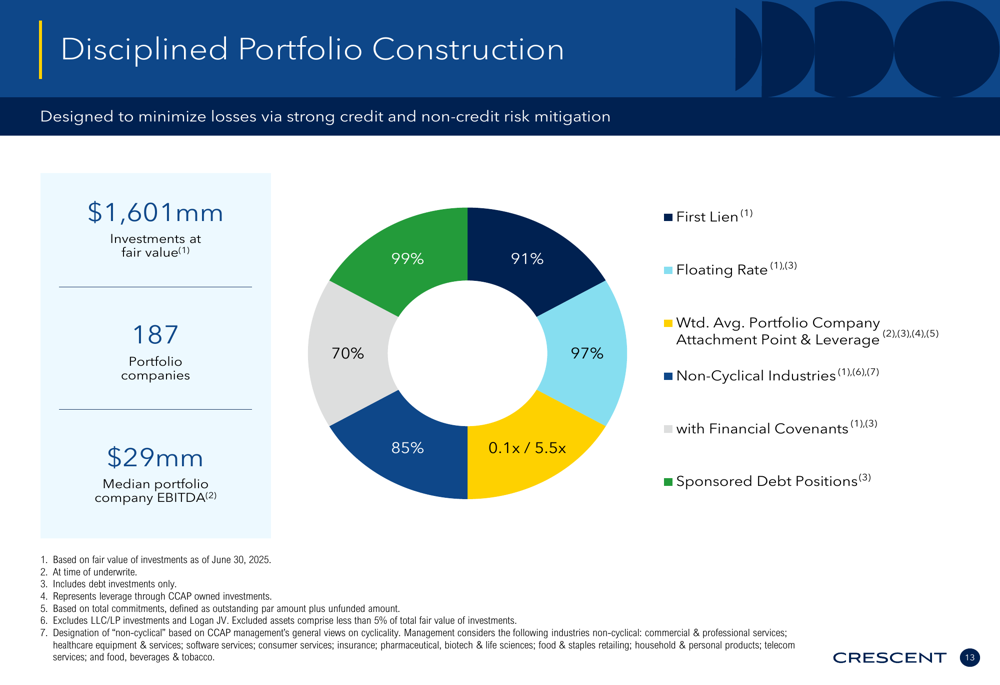
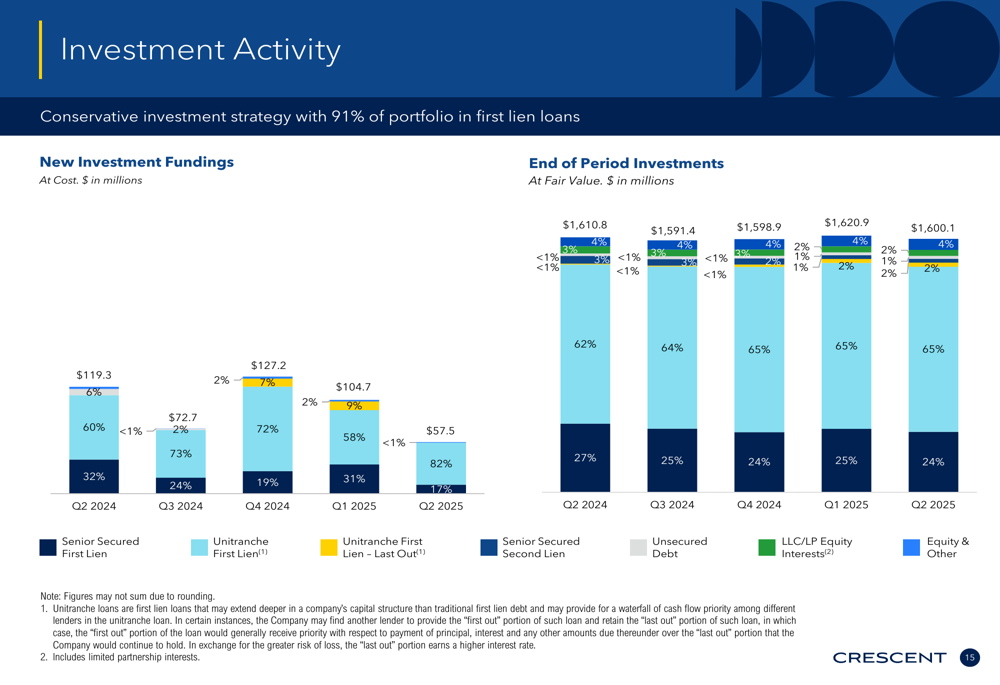
CCAP maintains a defensively positioned portfolio valued at $1.60 billion across 187 portfolio companies. The portfolio remains heavily weighted toward senior secured investments, with 91% in first lien and unitranche first lien positions.
The following chart illustrates the company’s disciplined portfolio construction approach:
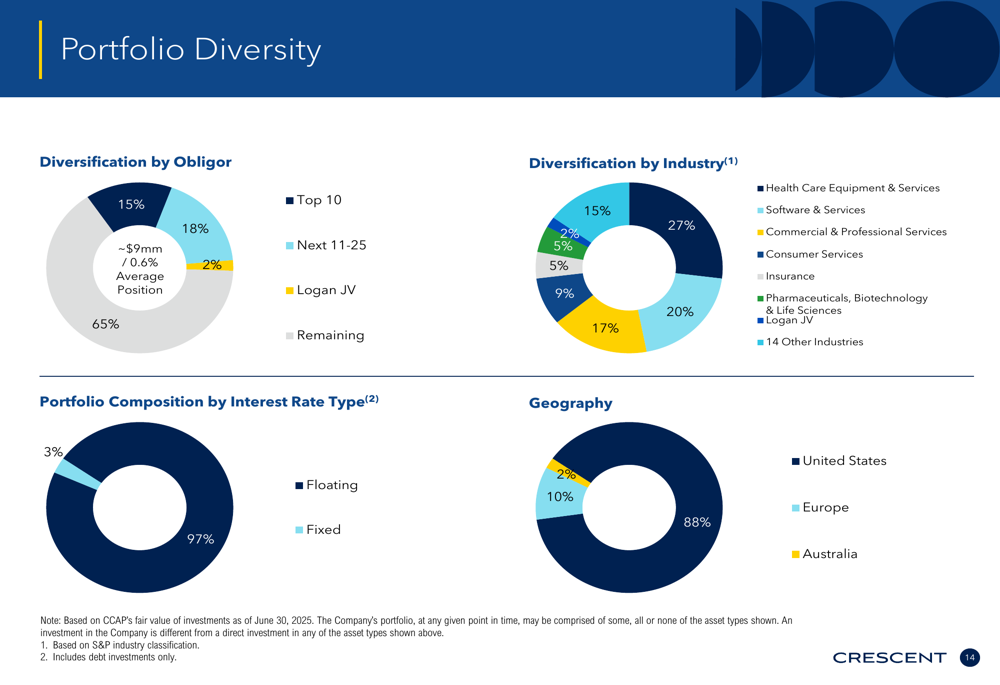
The portfolio is well-diversified across industries, with significant concentrations in software & services (27%), pharmaceuticals & biotechnology (20%), and healthcare equipment & services (15%). This industry diversification, combined with the focus on senior secured positions, reflects CCAP’s defensive strategy in an uncertain economic environment.
As shown in the following portfolio diversity breakdown:
New investment activity slowed in Q2 2025, with $57.5 million in new fundings, down from $104.7 million in Q1 2025 and $119.3 million in Q2 2024. The company reported net funded investment activity of -$35.2 million, indicating more repayments than new investments during the quarter.
A significant challenge for CCAP has been the declining yield on its portfolio, as illustrated in the following chart:
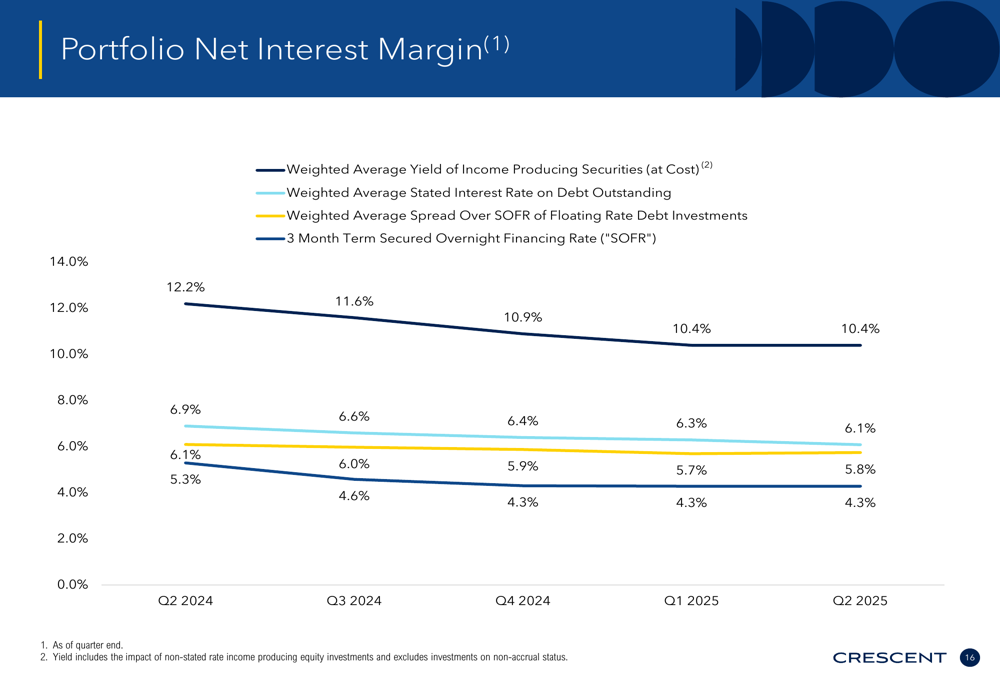
The weighted average yield on income-producing securities declined to 10.4% in Q2 2025 from 12.2% a year earlier, primarily due to Federal Reserve interest rate cuts affecting the floating rate portfolio, which comprises 97.2% of debt investments.
Dividend Strategy & Capital Structure
CCAP declared a regular dividend of $0.42 per share for Q3 2025, maintaining its consistent dividend policy. Additionally, the company paid the second of three previously announced special dividends of $0.05 per share in Q2 2025, with the final special dividend scheduled for Q3.
The company’s dividend coverage remains tight, with the $0.46 NII per share just covering the combined regular and special dividends of $0.47 for the quarter. This represents a challenge going forward, especially if portfolio yields continue to decline.
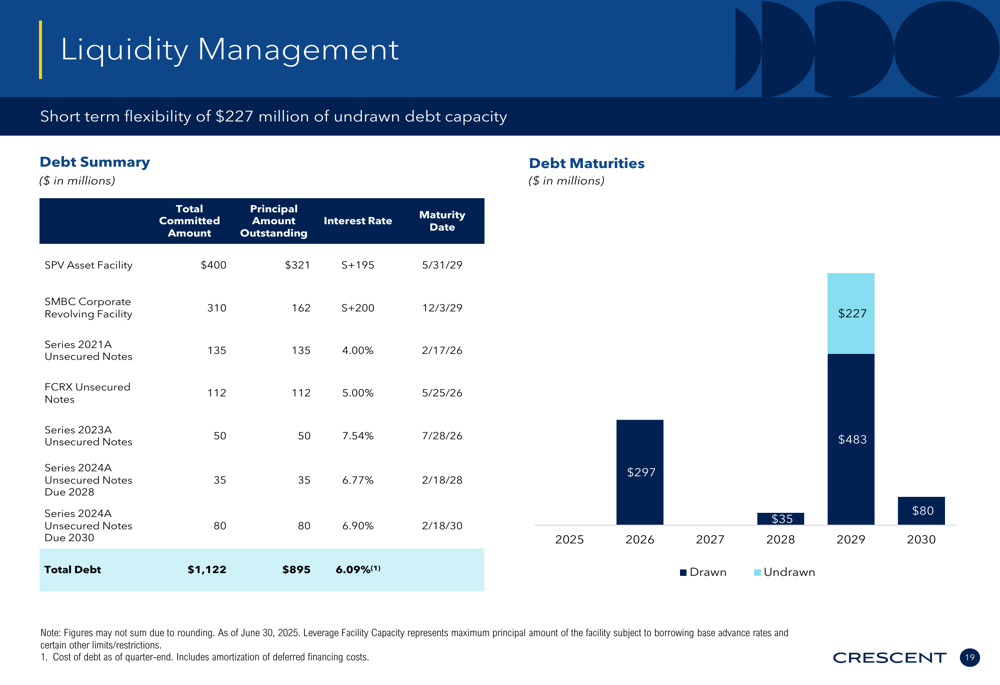
CCAP maintains a strong liquidity position with $26.1 million in cash and $227.2 million in undrawn debt capacity. The company’s debt structure and maturity schedule provide flexibility, with no significant maturities until 2026:
Forward Outlook & Challenges
While CCAP showed sequential improvement in Q2 2025, several challenges remain. The company’s portfolio quality metrics bear watching, with non-accruals ranging from 1.6% to 3.9% of debt investments at cost. Additionally, the percentage of investments performing at or above expectations (internal performance ratings 1 & 2) has remained between 86% and 90%.
The declining yield environment presents a significant headwind for CCAP, as 97.2% of its debt investments are floating rate. Further interest rate cuts by the Federal Reserve could put additional pressure on net investment income and dividend coverage.
The substantial discount to NAV at which CCAP’s stock trades suggests continued investor skepticism about the company’s ability to maintain its current dividend level and preserve NAV in the long term. However, the company’s defensive portfolio positioning, with its focus on senior secured investments and non-cyclical industries, provides some protection against economic uncertainty.
Management’s focus on capital preservation and NAV stability, rather than chasing yield through riskier investments, appears to be a prudent strategy in the current environment, though it may limit near-term earnings growth potential.
Full presentation:
This article was generated with the support of AI and reviewed by an editor. For more information see our T&C.