Novo Nordisk, Eli Lilly fall after Trump comments on weight loss drug pricing

Introduction & Market Context
Fastenal Company (NASDAQ:FAST) reported strong third-quarter 2025 results on October 13, highlighted by double-digit sales growth and improved profitability. Despite the positive performance metrics, Fastenal shares were down 4.52% in premarket trading to $43.71, suggesting investors may have had even higher expectations or concerns about future growth.
The industrial distributor achieved these results against a challenging manufacturing backdrop, with the U.S. Purchasing Managers’ Index (PMI) averaging 48.6 in Q3 2025, indicating contraction in the manufacturing sector. Despite this headwind, Fastenal managed to deliver significant growth, pointing to market share gains and successful execution of its digital transformation strategy.
Quarterly Performance Highlights
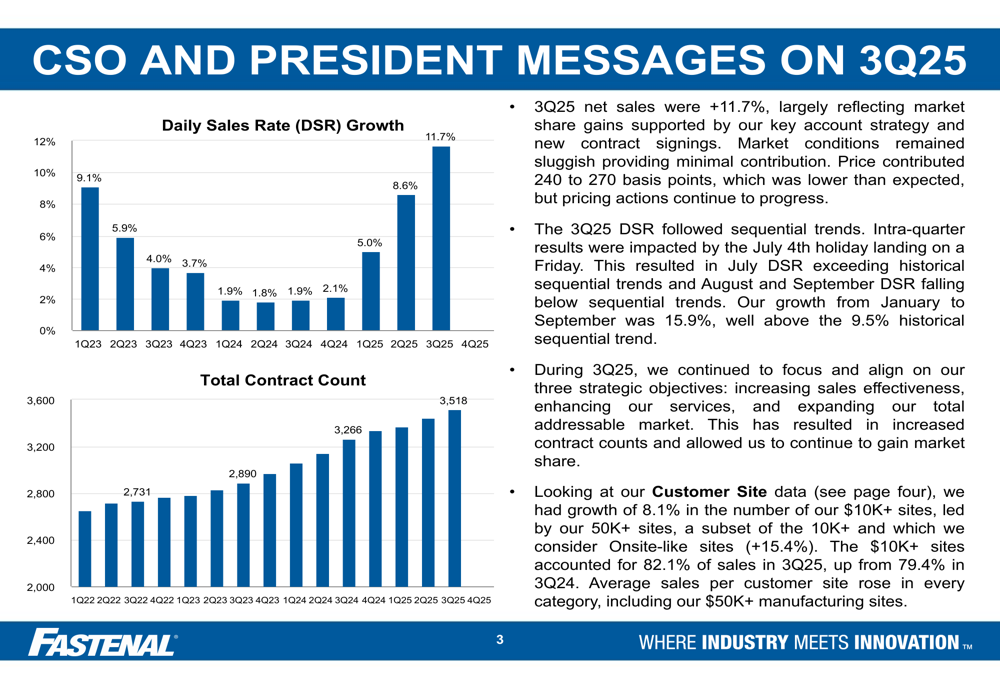
Fastenal reported Q3 2025 net sales growth of 11.7% year-over-year, continuing an acceleration from 8.6% in Q2 2025 and 5.0% in Q1 2025. This growth was primarily driven by market share gains supported by the company’s key account strategy and new contract signings.
As shown in the following chart of daily sales rate growth and contract count:
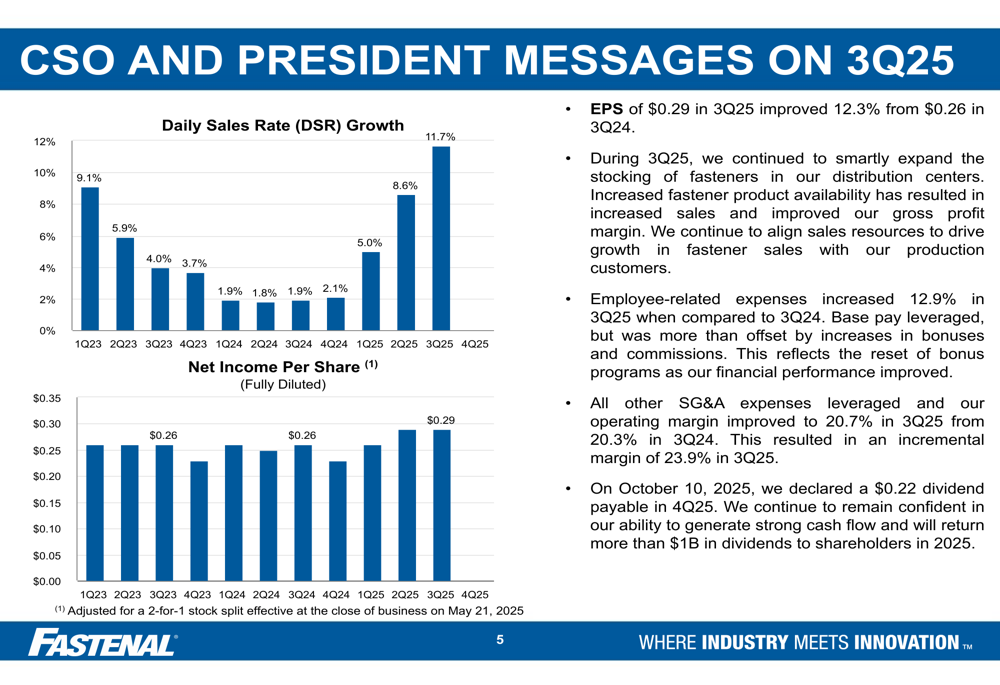
Earnings per share reached $0.29 in Q3 2025, a 12.3% improvement from $0.26 in Q3 2024. This matches the company’s Q2 2025 EPS, which also came in at $0.29. The operating margin expanded to 20.7% from 20.3% in the prior-year period, with an incremental margin of 23.9%.
The following chart illustrates Fastenal’s earnings per share progression:
Fastenal’s gross margin increased to 45.3% in Q3 2025 from 44.9% in Q3 2024, which the company attributed to improved fastener product availability resulting in increased sales. Meanwhile, SG&A expenses remained controlled at 24.6% of net sales, consistent with the prior year.
Customer Performance & Market Penetration
A key driver of Fastenal’s growth has been its success in expanding relationships with larger customers. The company reported 8.1% growth in the number of $10K+ monthly customer sites, led by impressive 15.4% growth in $50K+ monthly sites. These high-value customer relationships now account for 82.1% of total sales.
The detailed breakdown of customer site performance reveals significant growth in both manufacturing and non-manufacturing sectors:
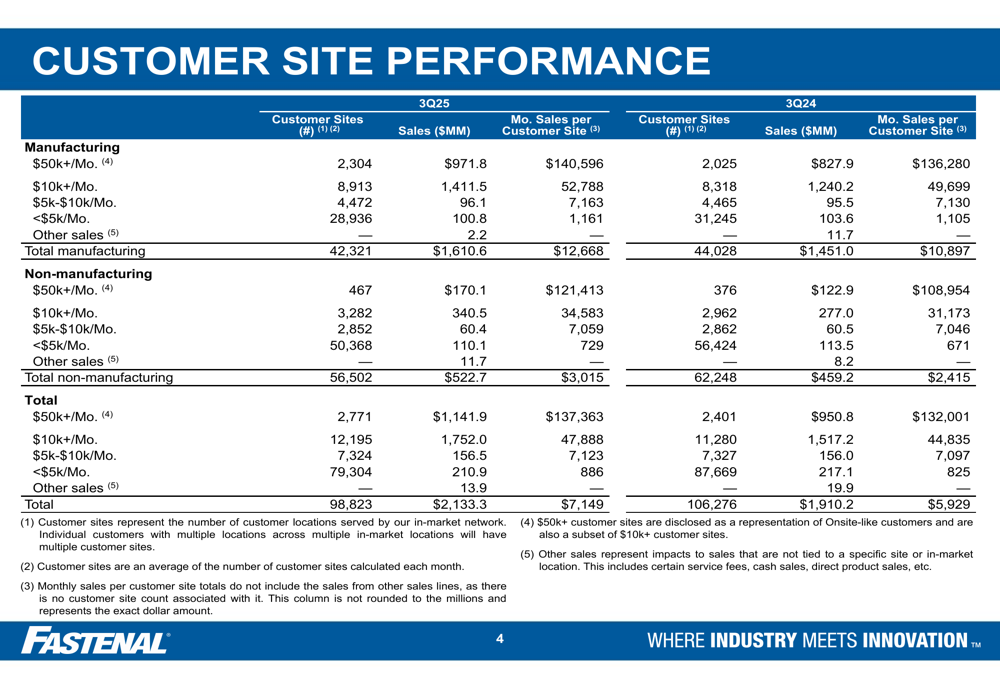
Particularly notable is the growth in the $50K+ monthly customer segment, which increased from 2,401 sites in Q3 2024 to 2,771 sites in Q3 2025, a 15.4% increase. Monthly sales per customer site across all segments improved from $5,929 to $7,149, reflecting Fastenal’s success in expanding wallet share with existing customers.
Digital Transformation Strategy
Fastenal’s digital initiatives continue to drive growth and operational efficiency. The company’s FMI (Fastenal Managed Inventory) Technology program signed 7,050 weighted devices in Q3 2025, maintaining a strong pace of 110 devices per day. The installed base grew to 133,910 units, an 8.7% increase from Q3 2024.
The following chart shows the progression of FMI device signings and eBusiness growth:
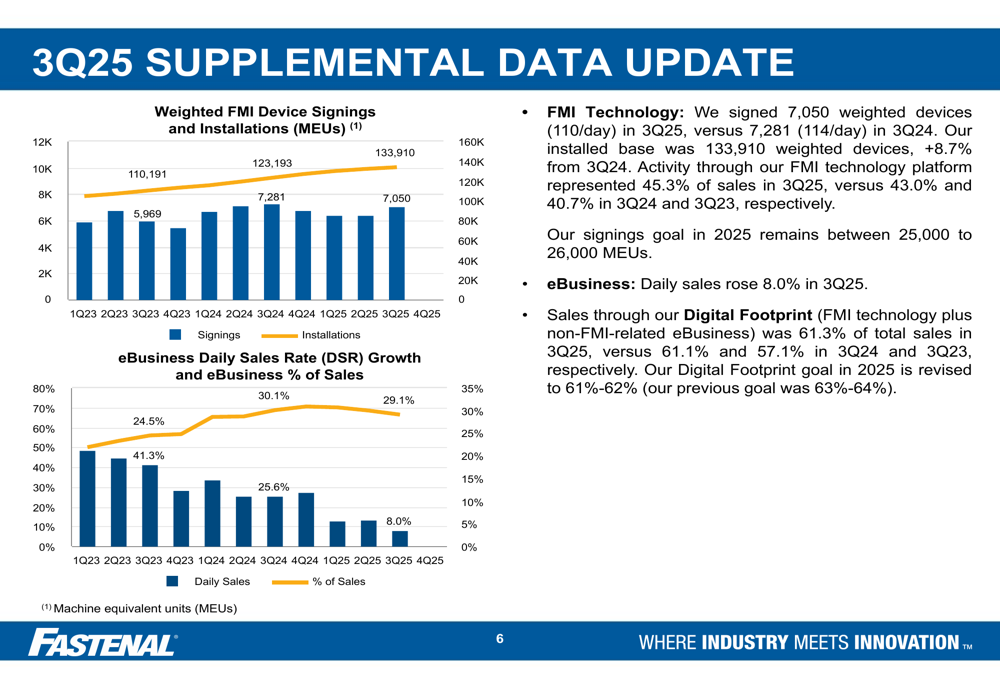
eBusiness daily sales rose 8.0% in Q3 2025, with eBusiness now representing 29.1% of total sales. Combined with FMI technology, Fastenal’s "Digital Footprint" reached 61.3% of total sales in Q3 2025. The company has revised its Digital Footprint goal for 2025 to 61%-62%, reflecting the success of these initiatives.
End Market & Product Performance
Fastenal’s performance varied across different end markets and product categories, with manufacturing sectors outperforming non-manufacturing. Heavy manufacturing led the way with 12.9% daily sales growth in Q3 2025, followed by other manufacturing at 12.4% and non-manufacturing markets at 8.4%.
The following chart illustrates the performance across end markets and product categories:
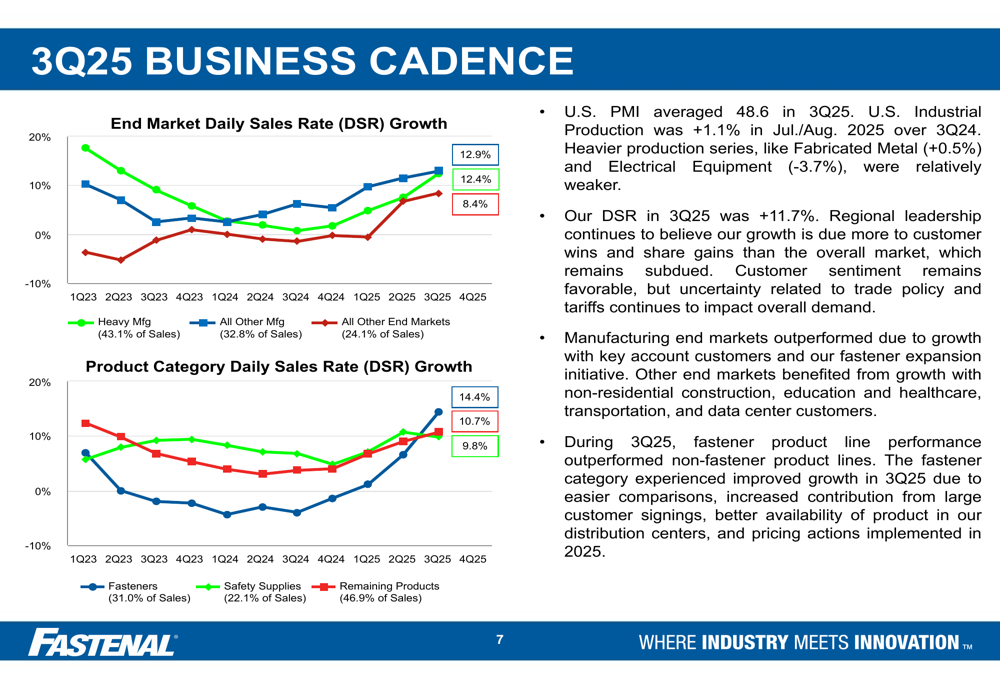
On the product side, fasteners showed the strongest growth at 14.4%, outpacing safety supplies (10.7%) and other products (9.8%). This performance is particularly notable given that fasteners are often considered a leading indicator of industrial activity.
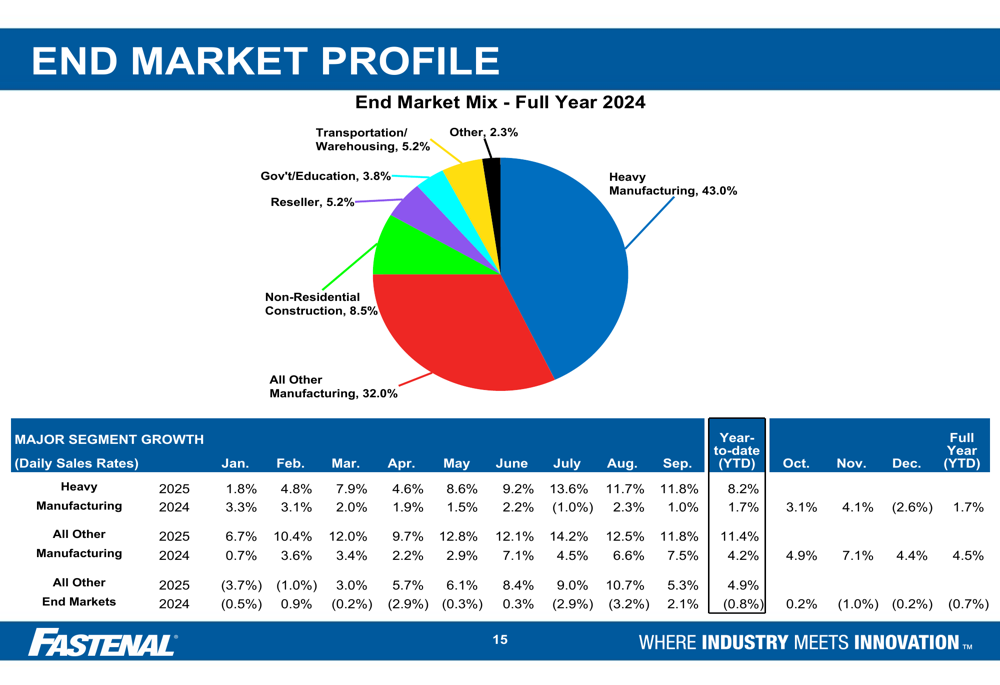
The company’s end market profile remains heavily weighted toward manufacturing, which accounts for 75% of total sales:
Financial Position & Cash Flow
Fastenal maintained strong cash generation in Q3 2025, with operating cash flow of $386.9 million, representing 115.3% of net income. This strong cash conversion allowed the company to fund its growth initiatives while returning significant capital to shareholders.
The following chart shows Fastenal’s operating cash flow and capital expenditure trends:
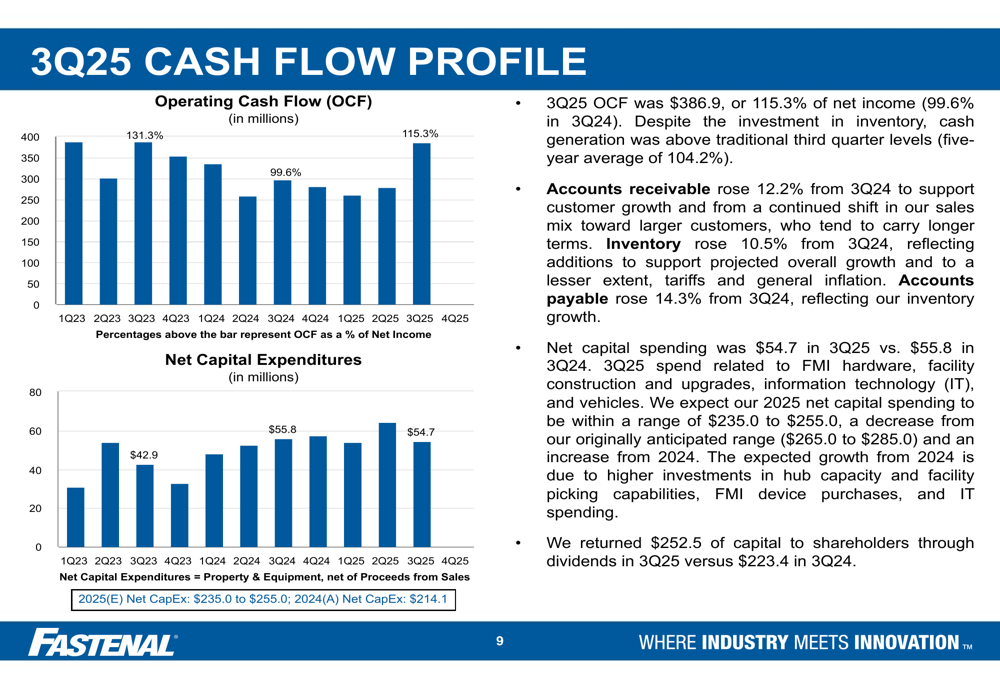
Working capital metrics showed increases aligned with sales growth, with accounts receivable up 12.2%, inventory up 10.5%, and accounts payable up 14.3% compared to Q3 2024. Net capital spending was $54.7 million in Q3 2025, and the company returned $252.5 million to shareholders through dividends.
Fastenal’s return on invested capital (ROIC) remained strong at 30.2% for the trailing twelve months ended Q3 2025, slightly up from 30.0% in the comparable prior-year period.
Strategic Initiatives & Forward Outlook
Looking ahead, Fastenal is migrating to a new product sales categorization system that distinguishes between direct and indirect materials. This change aims to provide better analytics and visibility into customer data, offering insights that can help the field team identify opportunities for wallet share expansion.
According to the presentation, direct materials currently account for 38.8% of year-to-date sales in 2025, with fasteners representing 20.9% and non-fasteners 17.9%. The company plans to provide additional information in its November press release of October sales results.
While Fastenal didn’t provide specific forward guidance in the presentation, the continued acceleration in sales growth and margin expansion suggests positive momentum heading into the final quarter of 2025. However, the negative premarket stock reaction indicates investors may be concerned about sustainability of growth rates or potential headwinds not fully addressed in the presentation.
The company’s ability to deliver double-digit growth despite a PMI reading below 50 demonstrates Fastenal’s resilience and effective execution of its strategy focused on digital transformation, key account growth, and market share gains.
Full presentation:
This article was generated with the support of AI and reviewed by an editor. For more information see our T&C.