Street Calls of the Week

Flagstar Financial Inc (NYSE:FLG), formerly known as New York Community Bancorp , released its first quarter 2025 results on April 25, showing continued progress in its strategic transformation despite posting a net loss. The company reported a net loss of $100 million, or $0.26 per diluted share, as it continues to reposition its balance sheet and strengthen its capital position.
Executive Summary
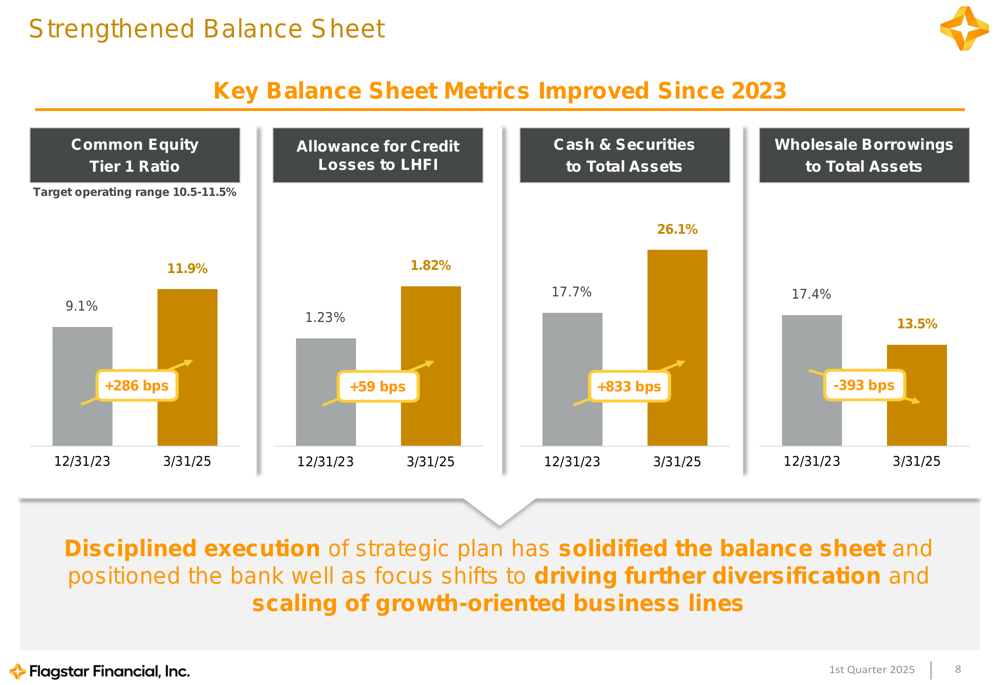
Flagstar reported an adjusted net loss of $86 million, or $0.23 per diluted share, for Q1 2025. While still operating at a loss, the company highlighted several positive developments, including a strengthened capital position with a Common Equity Tier 1 (CET1) ratio of 11.9%, significant expense reductions, and growing momentum in commercial banking.
"We’re focused on improving our earnings profile through NIM expansion, reducing funding costs, growing fee income, and reducing operating expenses by almost $600 million through operational efficiencies," the company stated in its presentation, noting that over 80% of these efficiencies have already been realized.
As shown in the following chart, Flagstar has significantly strengthened key balance sheet metrics since the end of 2023:
Quarterly Performance Highlights
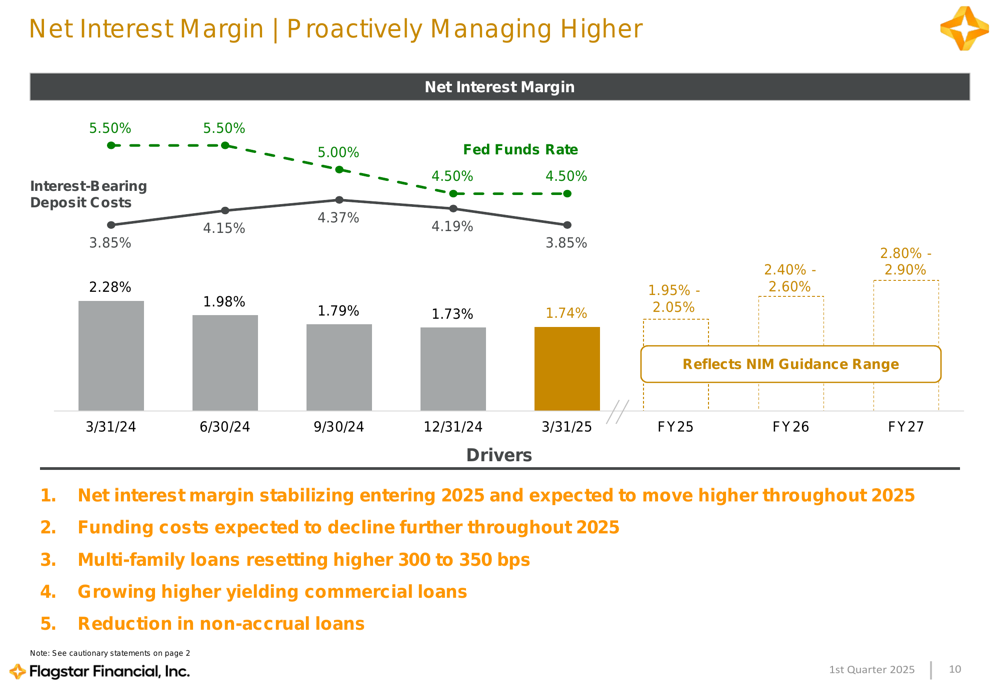
For Q1 2025, Flagstar reported total revenue of $490 million, with net interest income of $410 million and non-interest income of $80 million. The company’s net interest margin (NIM) stabilized at 1.74%, slightly up from 1.73% in the previous quarter, suggesting the margin compression may have bottomed out.
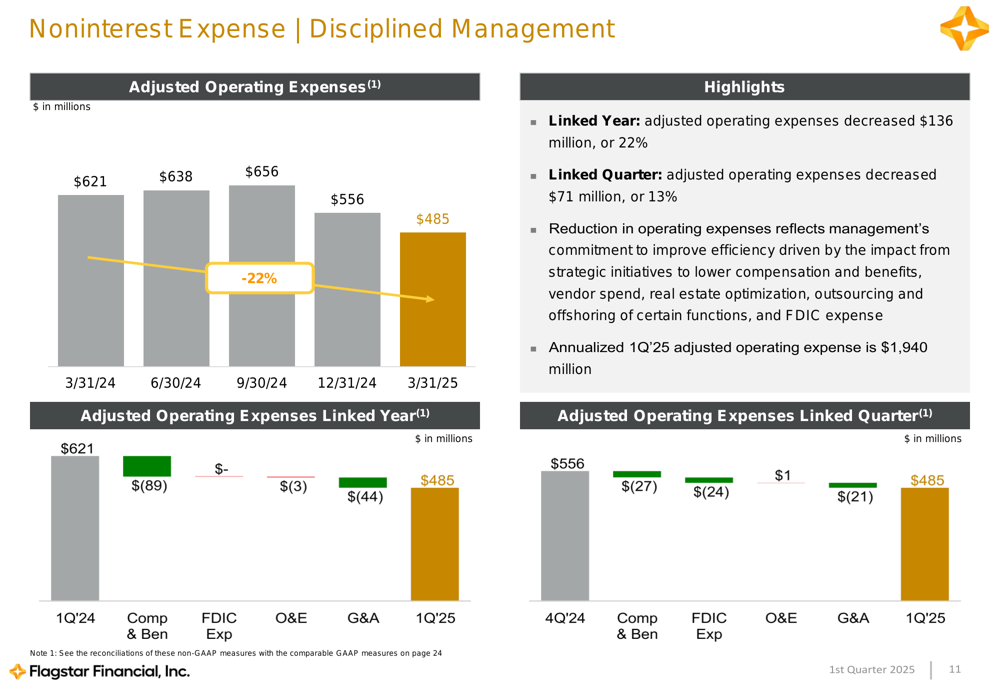
Notably, the company has made substantial progress in expense management, reducing adjusted operating expenses by $136 million, or 22% year-over-year, and by $71 million, or 13% quarter-over-quarter.
The following chart illustrates the company’s expense reduction progress:
Credit quality remains a focus area, with provision for credit losses at $79 million for the quarter. The allowance for credit losses to loans held for investment stood at 1.82%, up from 1.23% at the end of 2023, reflecting the company’s conservative approach to potential credit deterioration.
Strategic Initiatives
Flagstar’s transformation strategy centers on four key areas: improving its earnings profile, executing on C&I and private banking growth initiatives, proactively managing its CRE portfolio, and normalizing credit metrics.
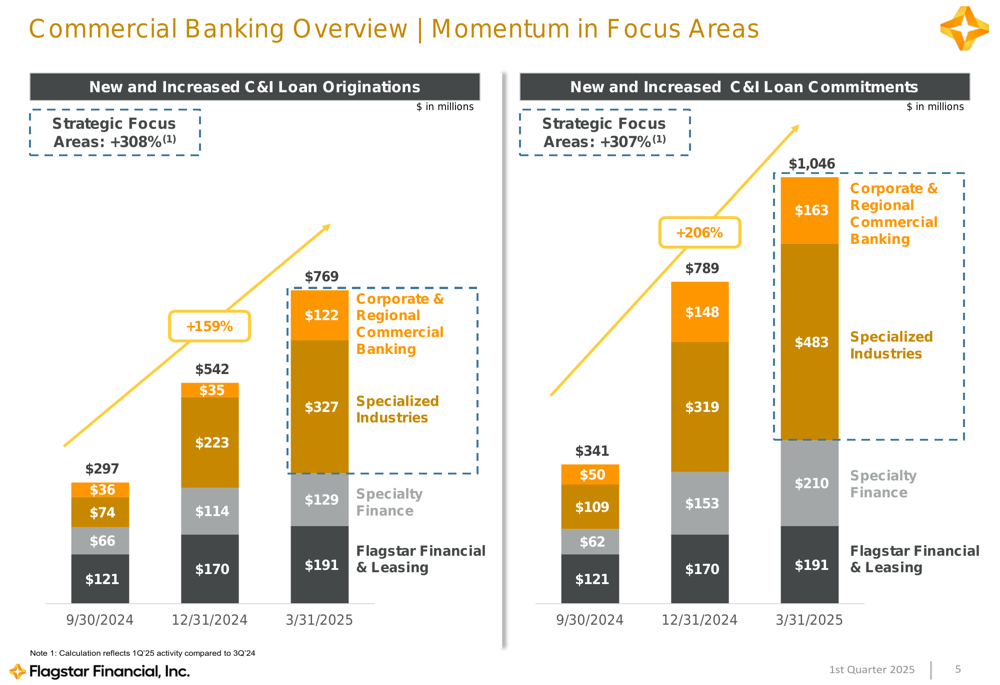
The commercial banking division showed strong momentum, with new credit commitments up 32% to $1.046 billion and new loan originations up 42% to $769 million in Q1 2025. The company continues to add commercial banking talent, hiring 75 new bankers since June 2024 and planning to add another 80-90.
This growth in commercial banking is illustrated in the following chart:
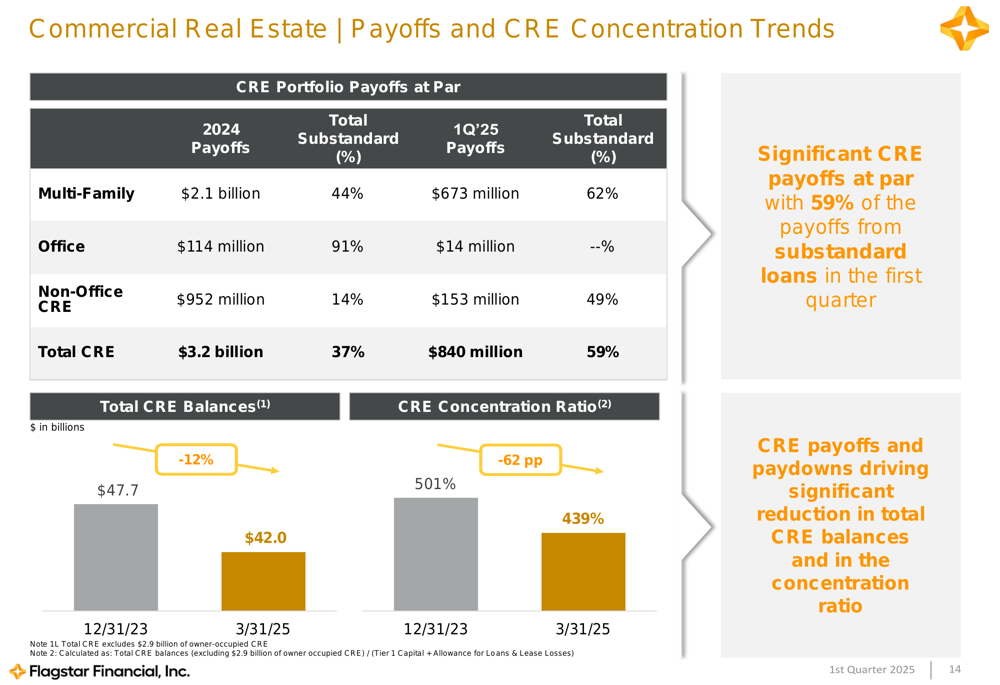
Simultaneously, Flagstar is deliberately reducing its commercial real estate exposure, particularly in higher-risk segments. The company’s CRE portfolio decreased by 12% since December 2023, from $47.7 billion to $42.0 billion, while its CRE concentration ratio improved from 501% to 439%.
The following chart details the company’s progress in reducing CRE exposure:
Forward-Looking Statements
Flagstar provided a comprehensive forecast for 2025-2027, projecting a return to profitability in 2026 with diluted core EPS of $0.75-$0.80, improving to $2.10-$2.20 by 2027. Net interest margin is expected to expand from 1.95-2.05% in 2025 to 2.80-2.90% by 2027.
The company’s NIM trajectory and key drivers are illustrated in this chart:
Management expects the efficiency ratio to improve from 85-90% in 2025 to approximately 50% by 2027, with long-term targets including a return on average assets (ROAA) of over 1% and return on average tangible common equity (ROATCE) of 11-12%.
Detailed Financial Analysis
Flagstar’s capital position continues to strengthen, with the CET1 ratio improving to 11.9% in Q1 2025, up from 9.4% a year earlier. This places the company in the "top quartile in peer group," according to management.
The company’s deposit base remains well-diversified, totaling $73.9 billion as of March 31, 2025, a decrease of 2.6% quarter-over-quarter primarily due to lower brokered deposits. Retail deposits accounted for $36.2 billion, while private banking deposits stood at $17.9 billion, up 14% year-over-year.
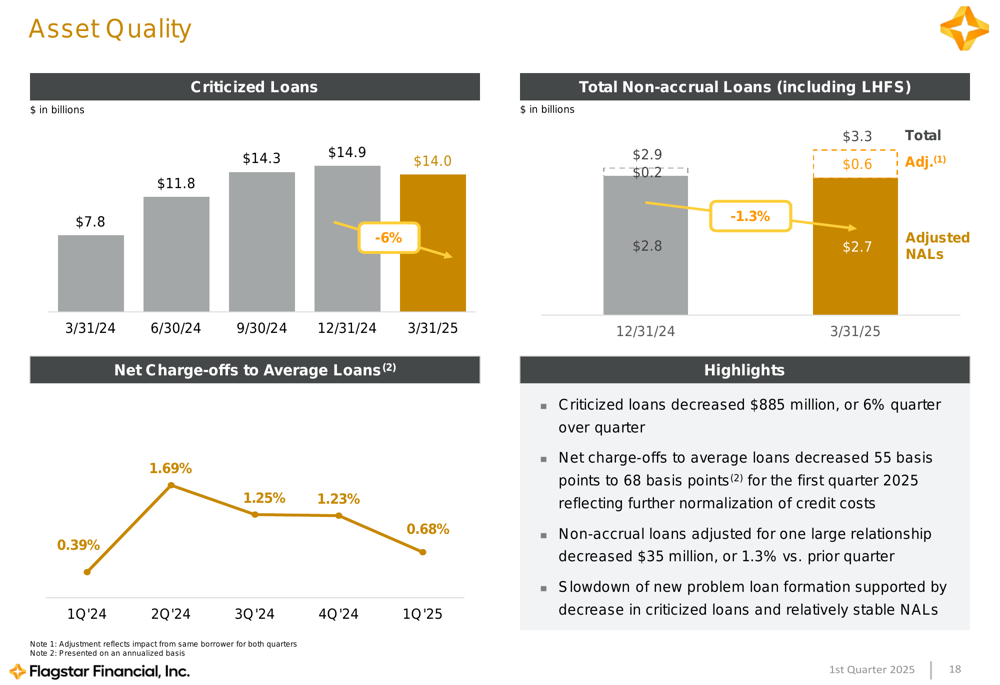
Asset quality metrics show some pressure, with criticized loans at $14.0 billion and non-accrual loans at $3.3 billion. Net charge-offs to average loans increased to 0.68% in Q1 2025 from 0.39% in Q1 2024.
The following chart illustrates the asset quality trends:
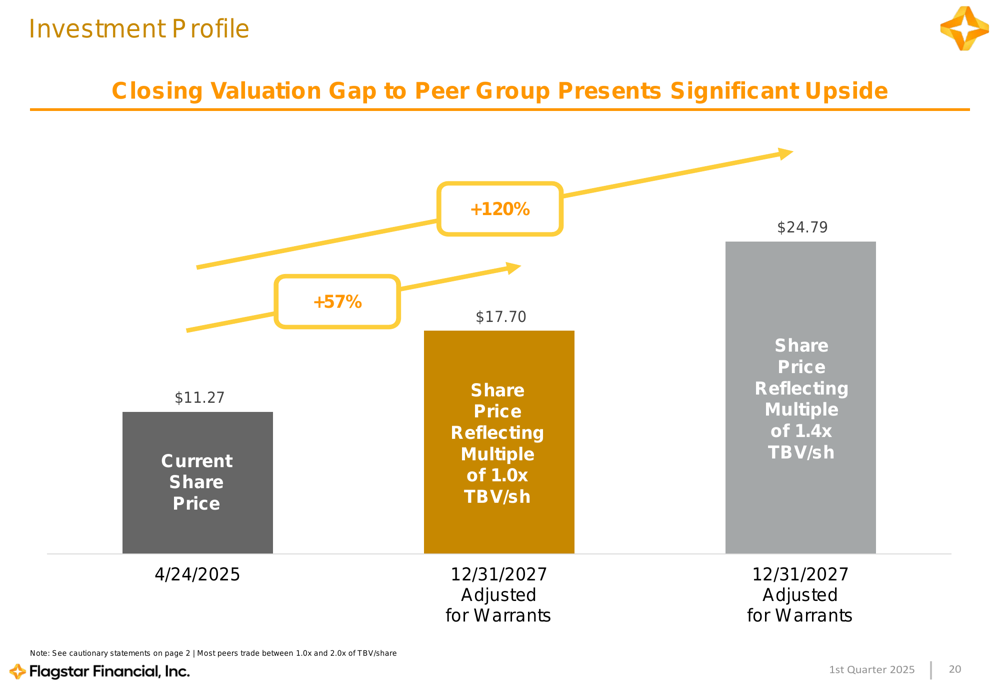
Management highlighted the potential upside in Flagstar’s valuation, noting that most peers trade between 1.0x and 2.0x tangible book value per share. With Flagstar trading at $11.27 as of April 24, 2025, management suggested potential upside to $17.70 (representing 1.0x TBV) or even $24.79 (at 1.4x TBV).
Market Context
Flagstar’s Q1 2025 results come amid its ongoing transformation from a CRE-focused lender to a more diversified regional bank. The company recently completed its rebranding from New York Community Bancorp to Flagstar Financial, now trading under the ticker FLG.
In premarket trading following the results, Flagstar shares were down 2.4% to $11.00, suggesting some investor caution despite the progress highlighted in the presentation. The stock has traded between $7.86 and $13.35 over the past 52 weeks.
While Flagstar continues to face challenges in returning to profitability, the Q1 2025 presentation demonstrates measurable progress in strengthening the balance sheet, diversifying the loan portfolio, and positioning the company for improved performance in 2026 and beyond.
Full presentation:
This article was generated with the support of AI and reviewed by an editor. For more information see our T&C.