5 big analyst AI moves: Nvidia, AMD upgraded; ASML seen on €1,000 path

Introduction & Market Context
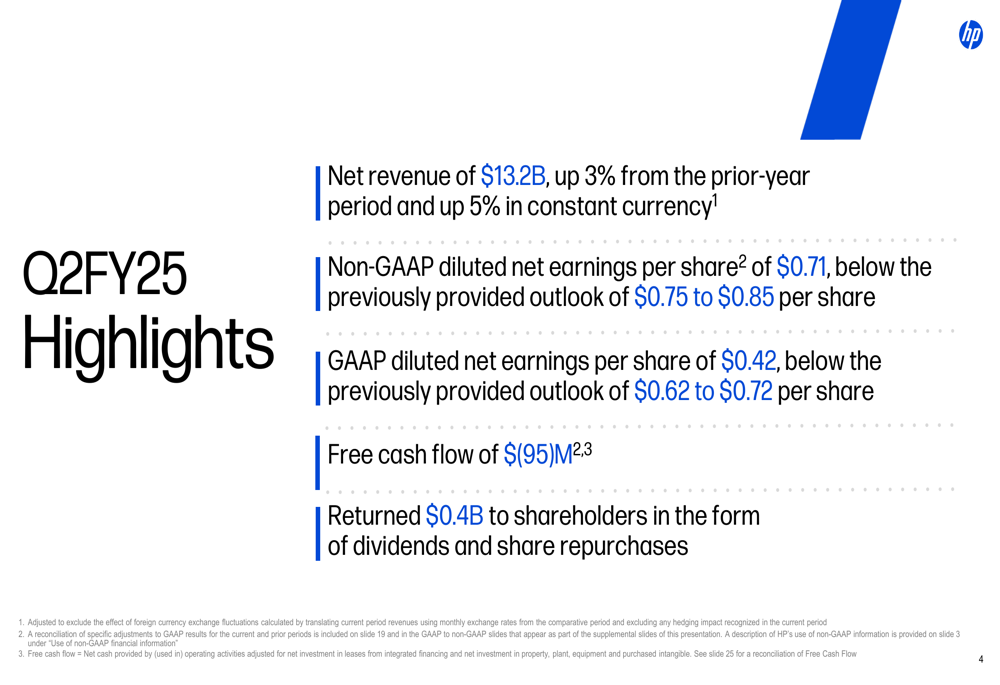
HP Inc (NYSE:HPQ) released its second-quarter fiscal 2025 earnings on May 28, revealing mixed results that fell short of the company’s previous guidance. Despite posting revenue growth, HP missed its earnings targets and significantly reduced its full-year outlook, triggering a sharp 14.78% decline in aftermarket trading to $23.18, according to market data.
The technology giant reported revenue growth of 3.3% year-over-year, reaching $13.2 billion, but delivered non-GAAP earnings per share of $0.71, below its previously provided outlook range of $0.75 to $0.85. The company’s performance was further complicated by negative free cash flow and rising debt levels, prompting a substantial downward revision to its full-year guidance.
Quarterly Performance Highlights
HP’s second quarter showed contrasting performance across its business segments. As illustrated in the following financial highlights, the company achieved modest revenue growth but fell short on profitability metrics:
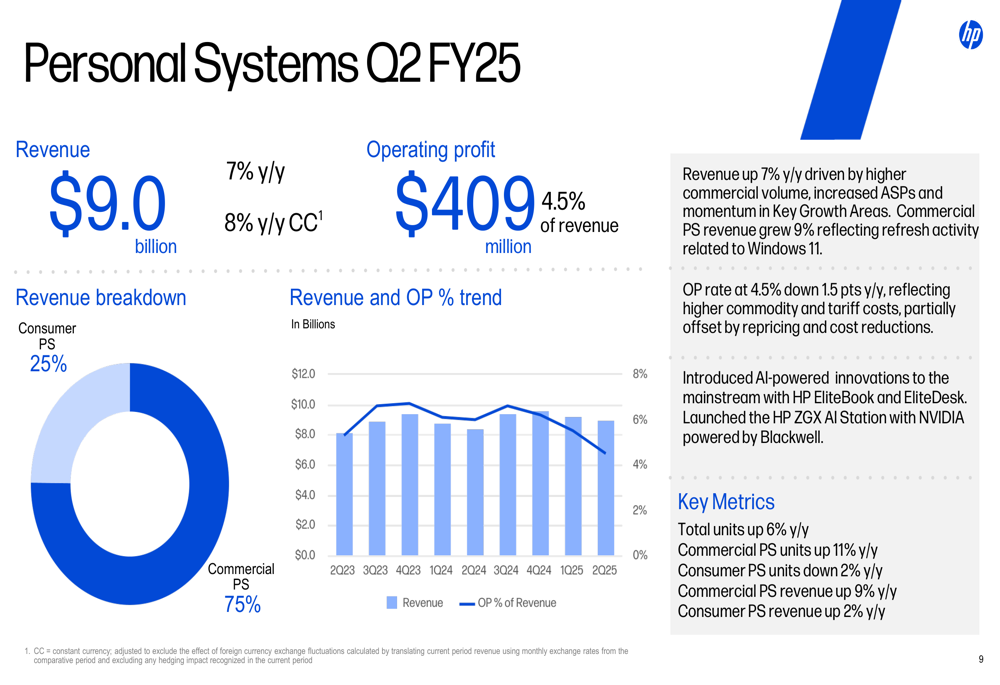
The Personal Systems segment, which accounts for 68% of HP’s total revenue, grew by 7.1% year-over-year to $9.0 billion. However, this growth came with margin pressure, as the segment’s operating profit declined by $99 million to $409 million, with operating margin falling 1.5 percentage points to 4.5%.
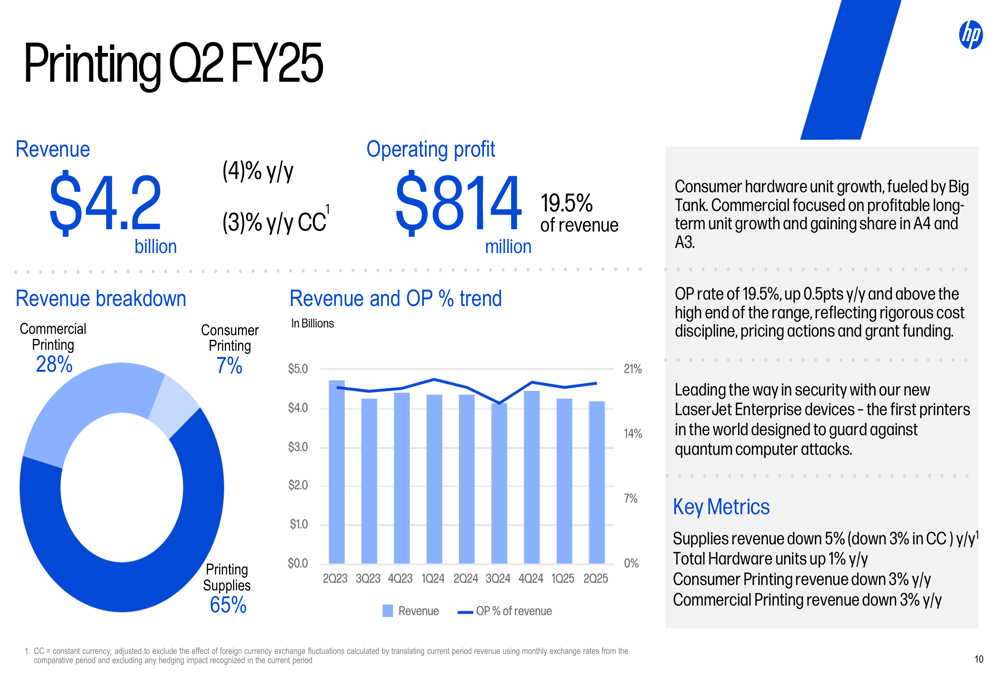
Conversely, the Printing business, representing 32% of revenue, saw a 4.3% decline to $4.2 billion but maintained strong profitability with a 19.5% operating margin, up 0.5 percentage points year-over-year. The following chart illustrates the revenue mix by segment and region:
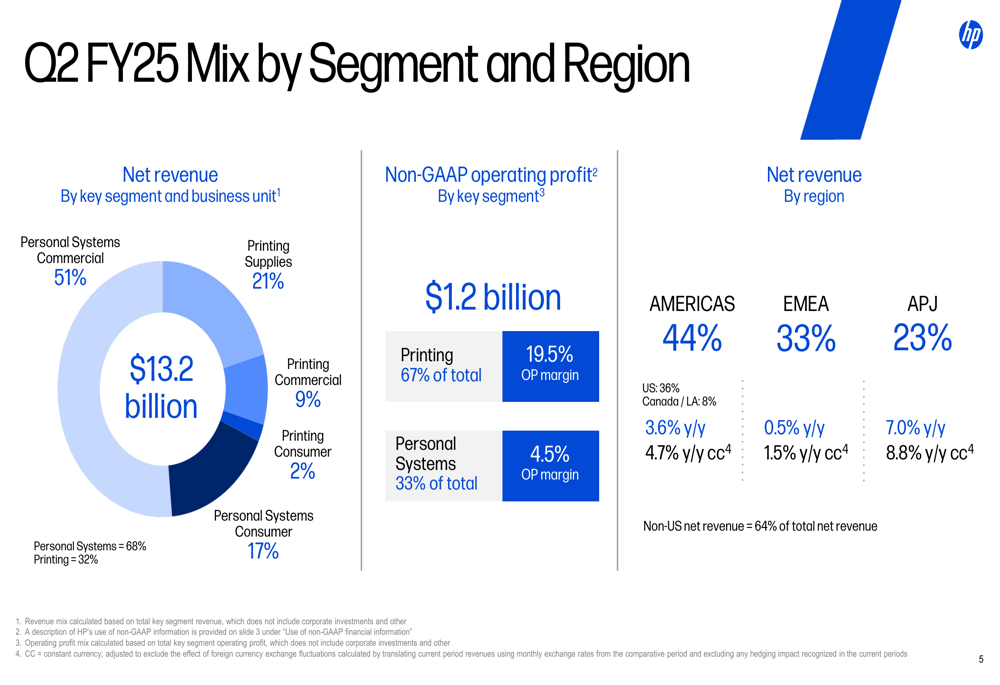
Regional performance varied significantly, with Asia Pacific and Japan (APJ) leading growth at 7.0% year-over-year (8.8% in constant currency), while Europe, Middle East, and Africa (EMEA) showed minimal growth at 0.5% (1.5% in constant currency). The Americas region grew by 3.6% (4.7% in constant currency).
Detailed Financial Analysis
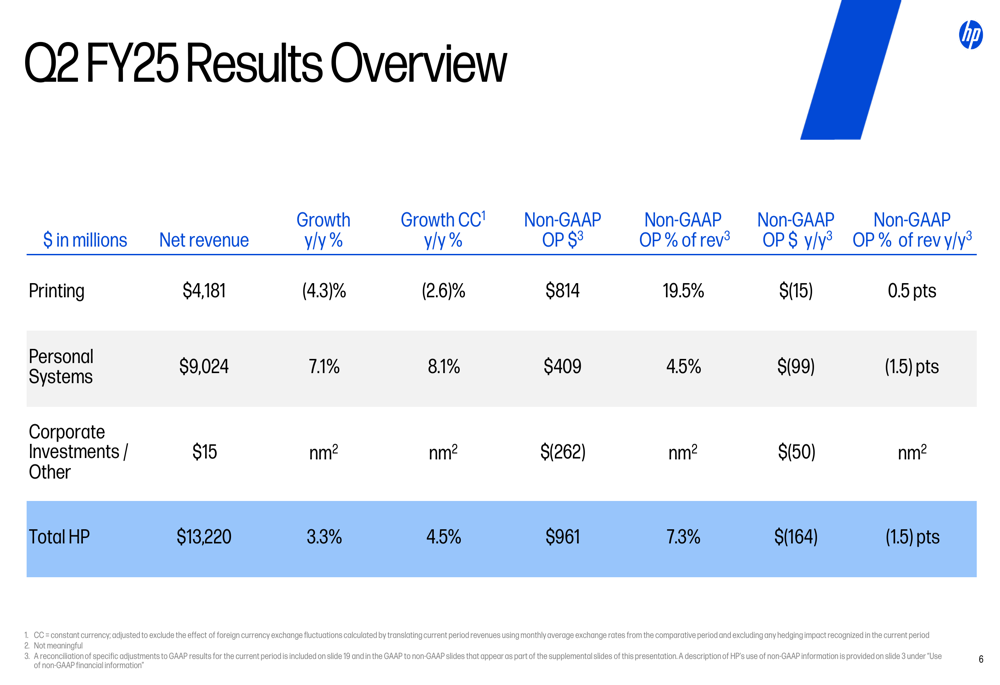
A closer examination of HP’s financial results reveals concerning trends in profitability and cash flow. The company’s overall non-GAAP operating profit declined by $164 million year-over-year to $961 million, with operating margin falling 1.5 percentage points to 7.3%:
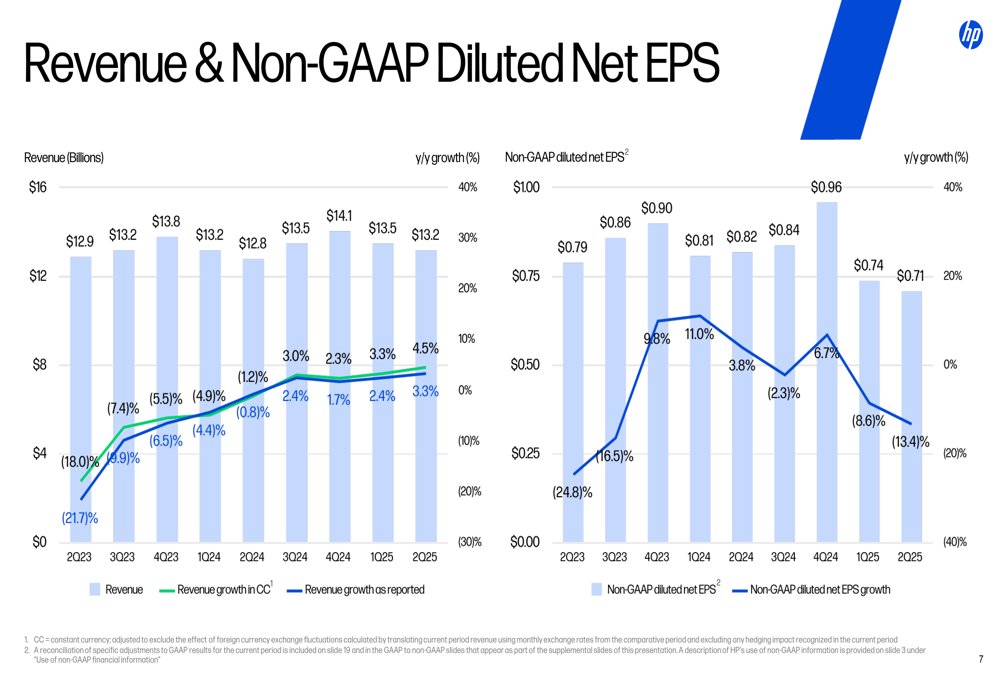
The historical trend of revenue and earnings per share shows volatility in recent quarters, with the current quarter marking a downturn in EPS performance:
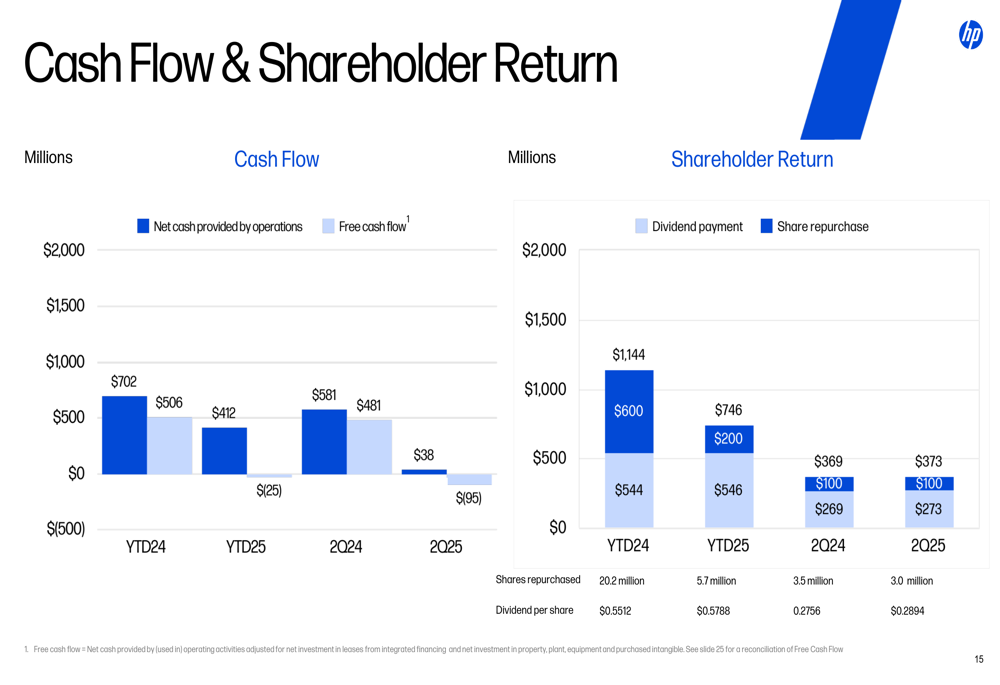
Particularly concerning is HP’s cash flow situation. The company reported negative free cash flow of $95 million for Q2 FY25, a significant deterioration from the positive $481 million reported in the same quarter last year:
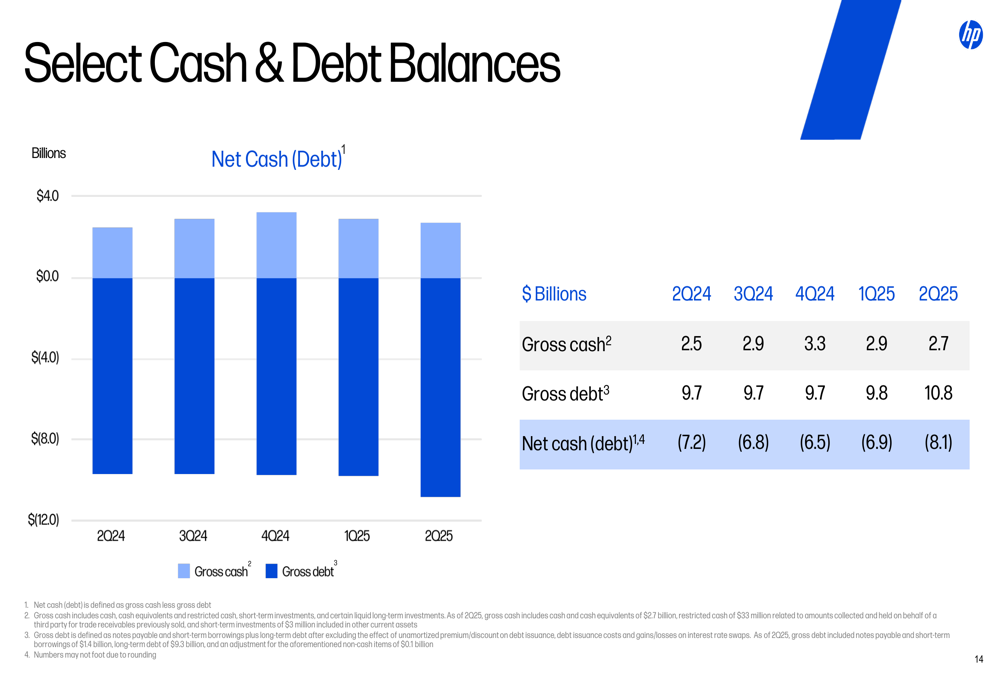
HP’s debt position has also worsened, with gross debt increasing to $10.8 billion in Q2 FY25 from $9.7 billion a year earlier, and net debt rising to $8.1 billion from $7.2 billion:
Strategic Initiatives
Despite the challenging quarter, HP highlighted several growth areas and strategic initiatives. The Personal Systems segment showed strength with total units up 6% year-over-year, driven by 11% growth in Commercial PS units, though Consumer PS units declined by 2%:
The Printing segment, while experiencing revenue decline, maintained its position as HP’s profit engine with a 19.5% operating margin. However, all key metrics within this segment showed year-over-year declines:
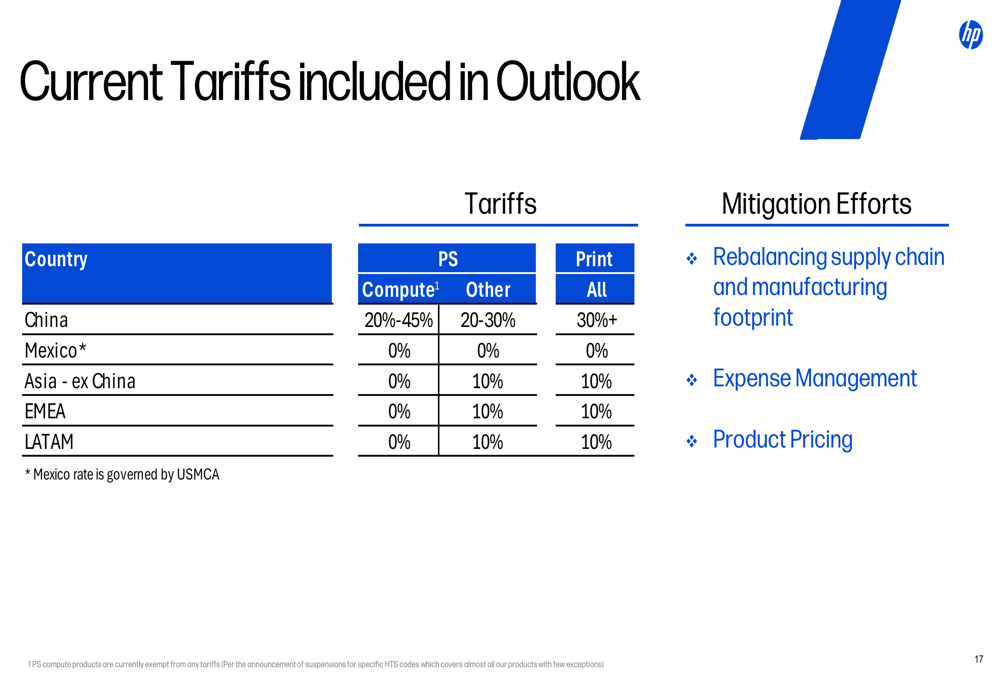
HP is actively addressing the impact of tariffs on its business, particularly for products manufactured in China. The company outlined its mitigation strategy, which includes rebalancing its supply chain, implementing expense management measures, and adjusting product pricing:
Forward-Looking Statements
In response to the quarter’s performance, HP significantly reduced its full-year outlook. The company lowered its FY25 non-GAAP EPS guidance from $3.45-$3.75 to $3.00-$3.30, and reduced its free cash flow guidance from $3.2-$3.6 billion to $2.6-$3.0 billion:
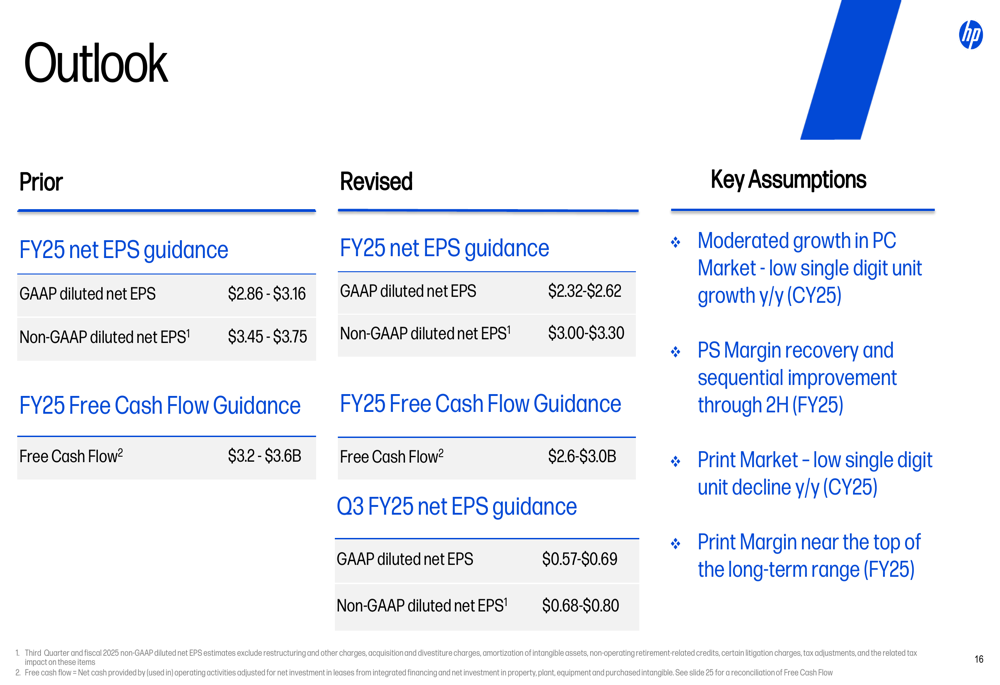
For the upcoming third quarter of fiscal 2025, HP expects GAAP diluted net EPS of $0.57-$0.69 and non-GAAP diluted net EPS of $0.68-$0.80.
The revised outlook is based on several key assumptions, including moderated growth in the PC market, Personal Systems margin recovery, continued decline in the Print market, and Print margins near the top of the long-term range. These projections, combined with the Q2 earnings miss, contributed to the sharp decline in HP’s stock price following the earnings release.
The substantial guidance reduction suggests HP faces significant headwinds in the coming quarters, as it navigates a challenging market environment, tariff impacts, and ongoing competitive pressures in both its Personal Systems and Printing businesses.
Full presentation:
This article was generated with the support of AI and reviewed by an editor. For more information see our T&C.