Bill Gross warns on gold momentum as regional bank stocks tumble
Introduction & Market Context
Indian Oil Corporation Ltd (NSE:IOC), India’s largest oil refiner and fuel retailer, presented its Q1 FY 2025-26 results on August 18, 2025, revealing a quarter-on-quarter decline in profitability despite modest operational improvements. The company’s stock closed at ₹140.13, well below its 52-week high of ₹184 but significantly above its 52-week low of ₹110.72, suggesting investors remain cautiously optimistic about the company’s prospects despite the quarterly profit dip.
The presentation, branded with the company’s "SPRINT" transformation project, highlighted both the challenges faced in the refining segment and the company’s continued focus on operational efficiency and long-term financial strength.
Quarterly Performance Highlights
Indian Oil reported a notable decline in profitability for Q1 FY 2025-26 compared to the previous quarter. Profit After Tax (PAT) fell to ₹5,689 crore from ₹7,265 crore in Q4 FY 2024-25, representing a 21.7% quarter-on-quarter decrease. This decline was primarily driven by a sharp reduction in Gross Refining Margins (GRM), which plummeted to $2.15 per barrel from $7.85 per barrel in the previous quarter.
As shown in the following financial highlights:
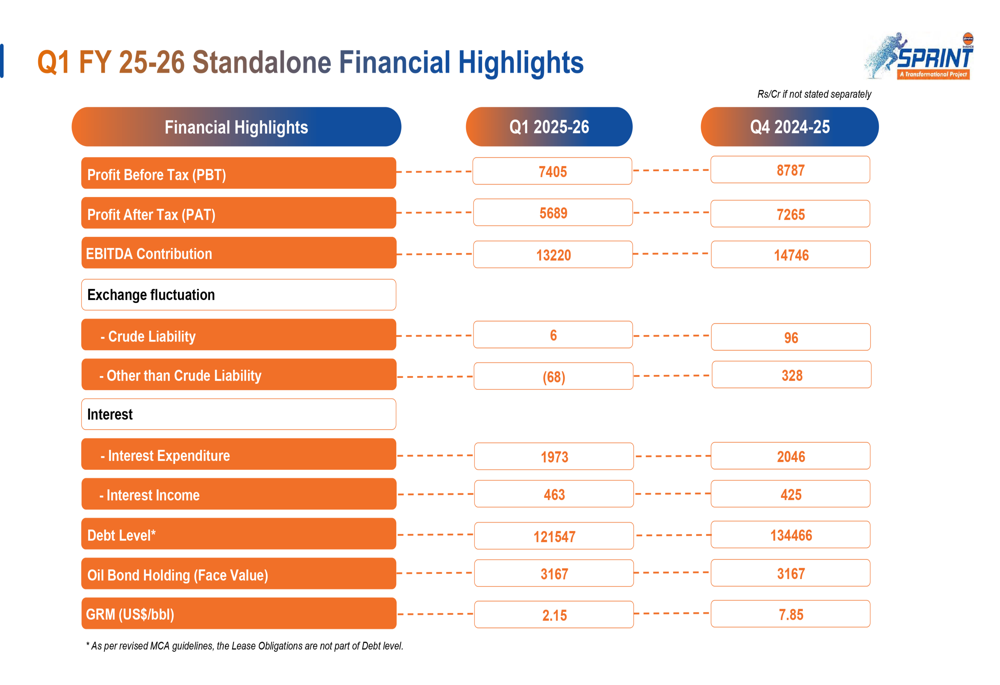
The company’s EBITDA also decreased to ₹13,220 crore from ₹14,746 crore in the previous quarter. However, Indian Oil managed to reduce its debt level to ₹121,547 crore, down from ₹134,466 crore at the end of the previous quarter, indicating improved balance sheet management despite the challenging profit environment.
Detailed Financial Analysis
The significant drop in GRM appears to be the primary factor behind the profit decline, suggesting pressure on refining margins during the quarter. This could be attributed to global oil price volatility and changing demand-supply dynamics in the refining sector.
Interest expenditure showed a slight improvement, decreasing to ₹1,973 crore from ₹2,046 crore in the previous quarter, while interest income increased to ₹463 crore from ₹425 crore. The reduction in debt levels by approximately ₹12,919 crore quarter-on-quarter demonstrates the company’s commitment to strengthening its balance sheet despite the challenging profit environment.
Exchange fluctuations had minimal impact on the quarterly results, with a gain of just ₹6 crore compared to ₹96 crore in the previous quarter. The company maintained its oil bond holdings at a face value of ₹3,167 crore.
Operational Performance
Despite the financial headwinds, Indian Oil’s operational metrics showed resilience and modest improvements across key areas. Refinery throughput increased to 18.7 MMT from 18.5 MMT in the previous quarter, with capacity utilization remaining robust at 106.7%, only marginally lower than the 107.1% achieved in Q4 FY25.
The operational highlights demonstrate the company’s continued focus on efficiency:
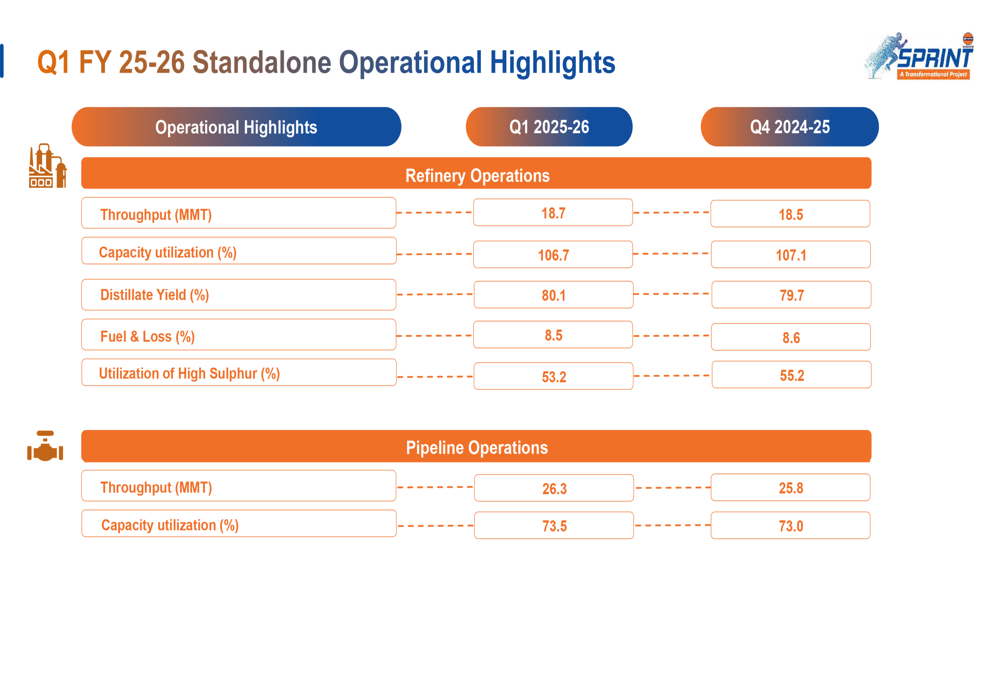
Pipeline operations also showed improvement, with throughput increasing to 26.3 MMT from 25.8 MMT, and capacity utilization rising to 73.5% from 73.0% in the previous quarter. The company achieved a slight improvement in distillate yield, which rose to 80.1% from 79.7%.
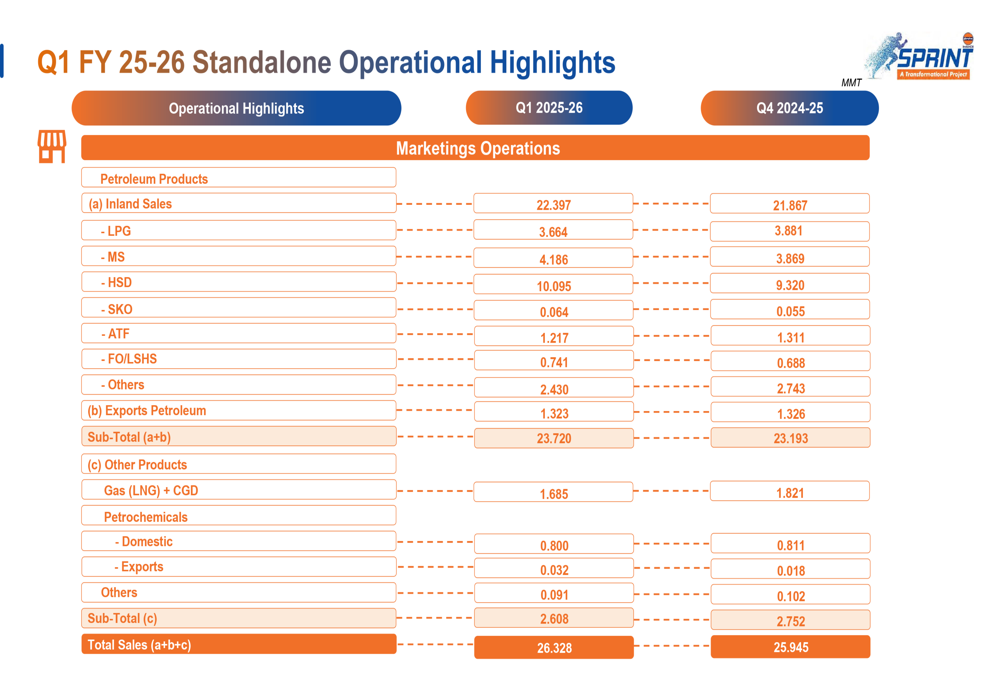
In the marketing segment, total sales volume increased to 26.328 MMT from 25.945 MMT in the previous quarter. Notably, domestic sales of petroleum products rose to 22.397 MMT from 21.867 MMT, with significant increases in MS (gasoline) and HSD (diesel) volumes. MS sales increased by 8.2% to 4.186 MMT, while HSD sales grew by 8.3% to 10.095 MMT, indicating robust demand in the transportation sector.
Long-term Financial Trends
Looking beyond the quarterly fluctuations, Indian Oil’s presentation highlighted its strong long-term financial trajectory. From FY 2021 to FY 2025, the company’s turnover grew substantially from ₹5,14,849 crore to ₹8,45,513 crore, while net worth increased from ₹1,10,500 crore to ₹1,78,677 crore.
The following chart illustrates Indian Oil’s financial growth over the five-year period:
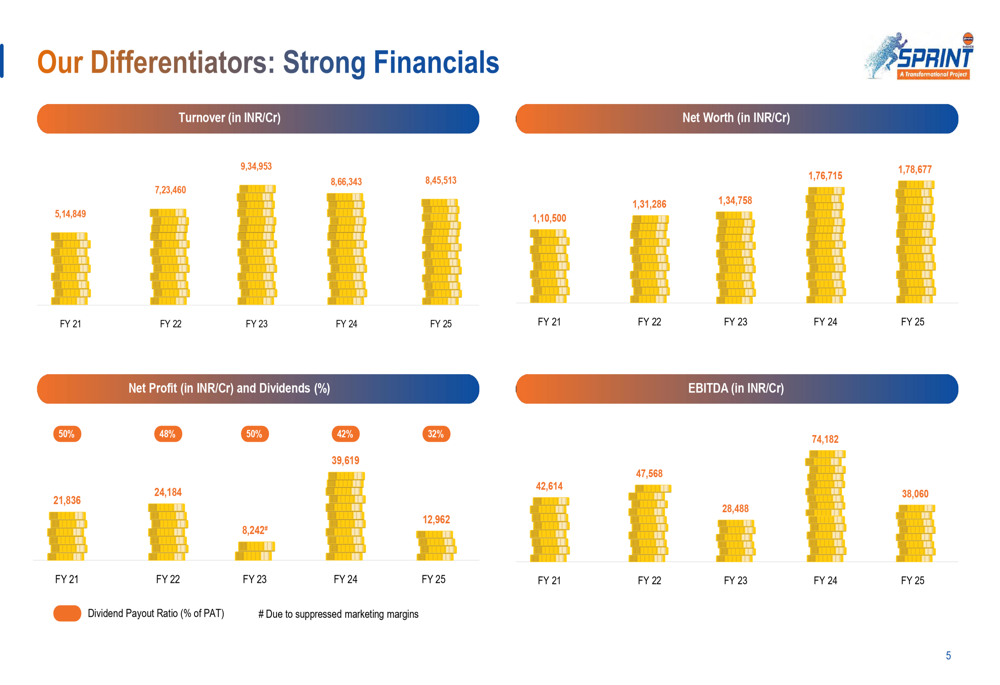
The dividend payout ratio has decreased over this period, from 50% in FY21 to 32% in FY25, suggesting a strategic shift toward retaining earnings for growth and investment. EBITDA for FY25 stood at ₹38,060 crore, lower than the FY21 figure of ₹42,614 crore, reflecting the volatile nature of the oil refining and marketing business.
Forward-Looking Statements
While the presentation did not explicitly detail forward-looking guidance, the emphasis on the "SPRINT" transformation project suggests Indian Oil is focusing on strategic initiatives to enhance long-term competitiveness and operational efficiency. The company’s diverse brand portfolio, showcased in the presentation, highlights its strong market presence across various product categories in India’s energy sector.

The reduction in debt levels, coupled with maintained operational efficiency despite margin pressures, indicates that Indian Oil is positioning itself for sustainable growth while navigating the inherent volatility of the oil and gas sector. Investors will likely watch for improvements in refining margins in upcoming quarters, as this appears to be the primary factor affecting the company’s near-term profitability.
As global energy markets continue to evolve, Indian Oil’s ability to balance operational excellence with strategic investments in future growth areas will be crucial for maintaining its leadership position in India’s energy landscape.
Full presentation:
This article was generated with the support of AI and reviewed by an editor. For more information see our T&C.