Nvidia and TSMC to unveil first domestic wafer for Blackwell chips, Axios reports

Introduction & Market Context
Itron Inc. (NASDAQ:ITRI) presented its second quarter 2025 earnings results on July 31, highlighting significant improvements in profitability metrics despite relatively flat revenue. The company, which specializes in energy and water resource management solutions, demonstrated resilience in navigating what management described as a "dynamic economic and trade backdrop" while achieving record margins and free cash flow.
The presentation comes as Itron’s stock has shown strong momentum, with a 28.5% price return over the past six months according to available market data. Following the earnings release, Itron’s stock initially rose 1.59% during regular trading hours but declined 1.54% in aftermarket trading, suggesting mixed investor reaction to the results.
Quarterly Performance Highlights
Itron reported Q2 2025 revenue of $606.8 million, slightly down from $609.1 million in the same period last year. However, the company achieved significant improvements in profitability metrics, with gross margin expanding to 36.9% (up 230 basis points year-over-year) and non-GAAP diluted earnings per share reaching $1.62, a 34% increase from $1.21 in Q2 2024.
As shown in the following summary of key financial metrics:
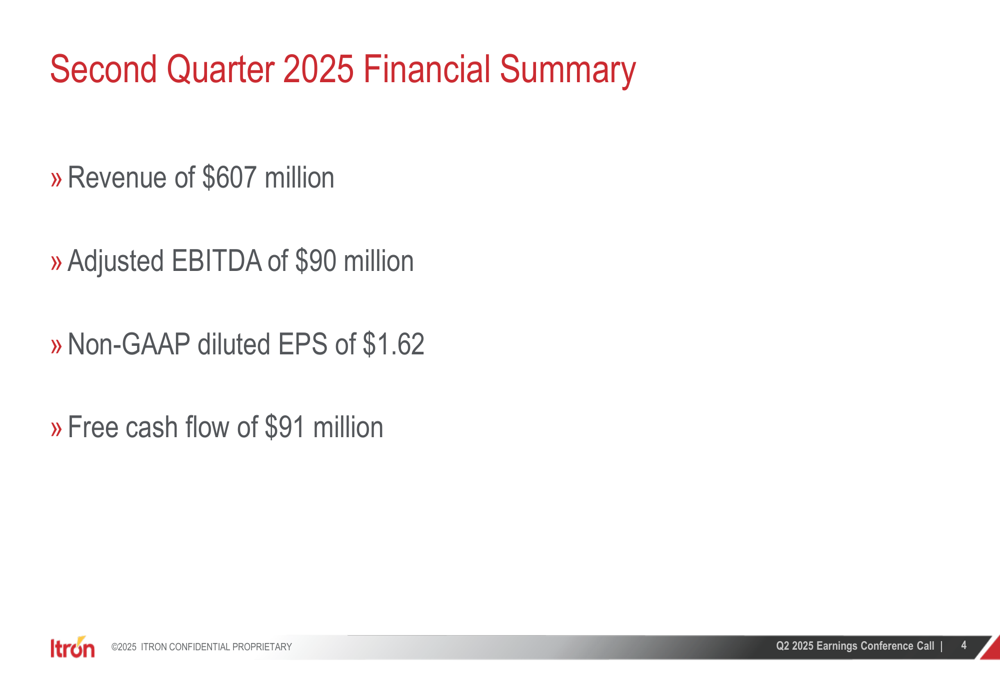
The company’s adjusted EBITDA grew to $90 million, representing 14.8% of revenue and a 16% increase compared to the prior year. Free cash flow more than doubled to $91 million, demonstrating the company’s improved operational efficiency and cash generation capabilities.
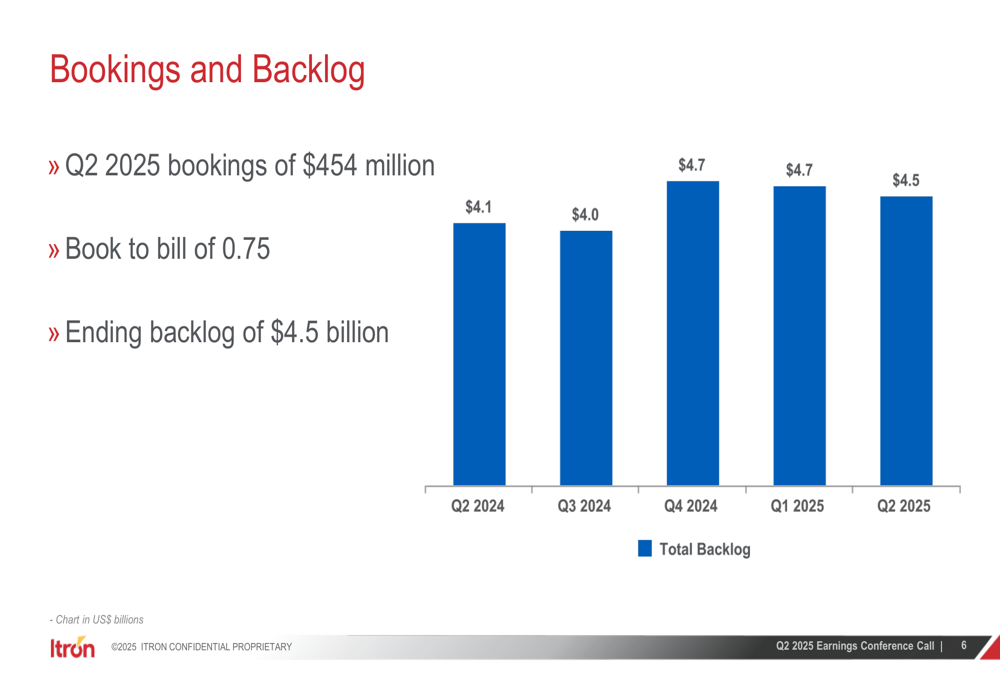
Itron’s backlog remained robust at $4.5 billion, though slightly down from $4.7 billion in the previous quarter. The company reported Q2 2025 bookings of $454 million, resulting in a book-to-bill ratio of 0.75.
The following chart illustrates the company’s backlog trend over the past five quarters:
CEO Tom Deitrich emphasized the company’s effective management of macroeconomic uncertainties during the earnings call, stating, "Our teams effectively managed macroeconomic and trade policies uncertainty in the second quarter, achieving expansion in both margins and free cash flow."
Segment Analysis
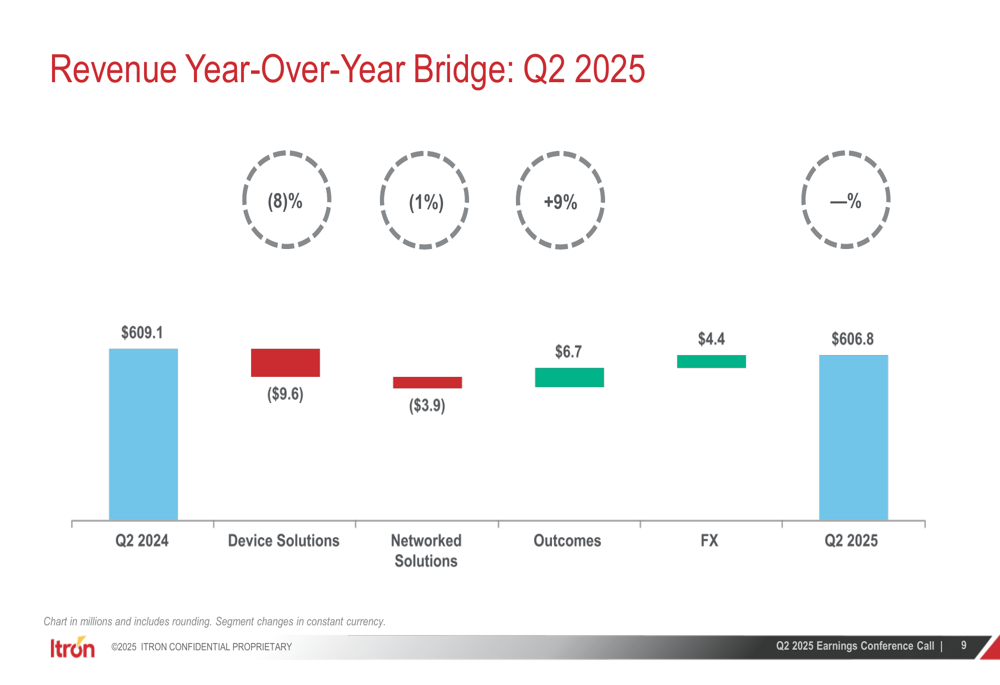
Itron’s performance varied across its three business segments, with the Outcomes segment showing the strongest growth while Device Solutions and Networked Solutions experienced slight revenue declines.
The Device Solutions segment, which includes metering hardware and related products, saw revenue decrease by 5% (8% in constant currency) to $113 million. Despite the revenue decline, the segment’s gross margin improved significantly, increasing 350 basis points to 29.8%, while operating margin rose 260 basis points to 22.6%.
Networked Solutions, the company’s largest segment which includes networking technology and smart grid solutions, reported revenue of $409 million, down 1% from the prior year. The segment’s gross margin increased 160 basis points to 38.5%, and operating margin improved 110 basis points to 29.6%.
The Outcomes segment, which focuses on software and services with recurring revenue streams, delivered the strongest performance with 9% revenue growth to $85 million. This segment also achieved substantial margin improvements, with gross margin increasing 370 basis points to 38.5% and operating margin expanding 470 basis points to 18.4%.
The following bridge chart illustrates the year-over-year revenue changes by segment:
Similarly, the components contributing to the year-over-year improvement in non-GAAP EPS are shown in this bridge chart:
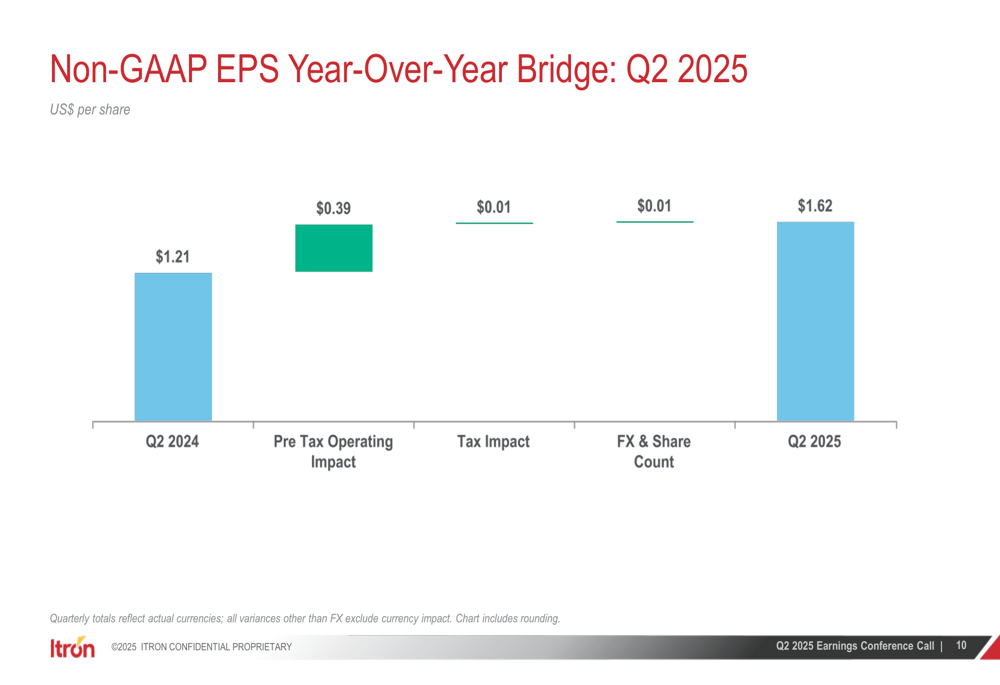
The company’s strategic focus on expanding its higher-margin Outcomes business appears to be yielding positive results, as evidenced by the segment’s strong growth and margin expansion.
Financial Position and Cash Flow
Itron maintained a strong financial position as of June 30, 2025, with $1.22 billion in cash and equivalents against total debt of $1.27 billion, resulting in a net debt position of just $41 million. The company’s net leverage ratio stood at a very conservative 0.1x, providing significant financial flexibility for potential investments or shareholder returns.
The company’s debt structure includes $460 million in 0% interest convertible notes due in 2026 and $805 million in 1.375% interest convertible notes due in 2030. Itron also maintains a $500 million revolving credit facility maturing in 2026, which remains available.
The substantial improvement in free cash flow, which more than doubled year-over-year to $91 million, reflects the company’s enhanced operational efficiency and working capital management. CFO Joan Hooper highlighted the improved margin profile during the earnings call, stating, "We are proud of the work we have done to improve the margin profile of the business, which has allowed us to drive higher profitability on lower revenue."
Forward Outlook and Guidance
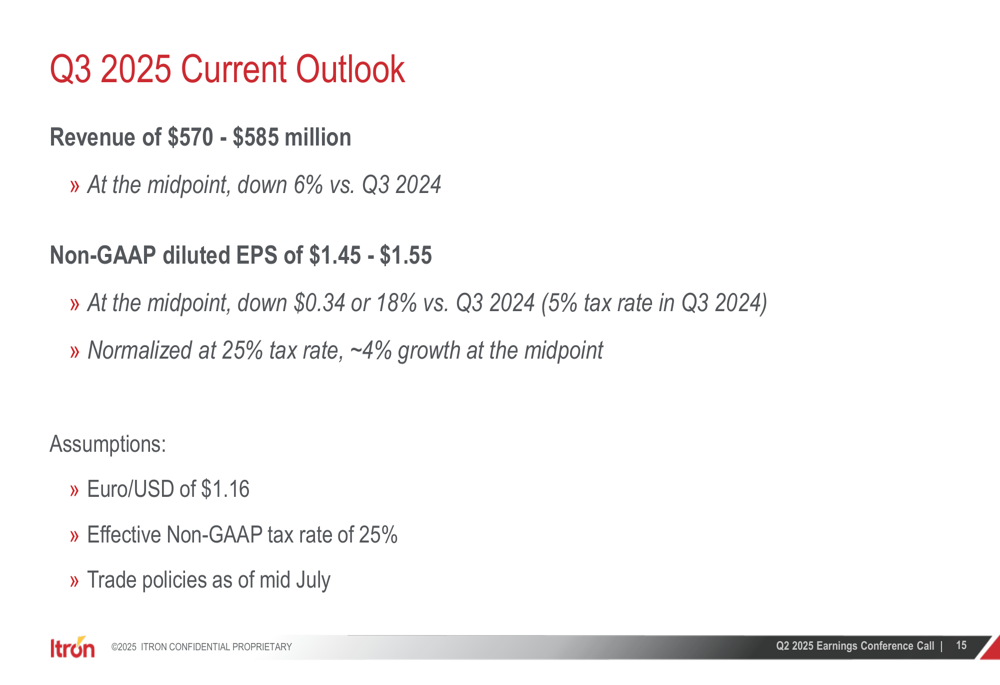
Itron provided guidance for Q3 2025 and updated its full-year 2025 outlook. For the third quarter, the company expects revenue of $570-585 million, representing a 6% year-over-year decline at the midpoint. Non-GAAP diluted EPS is projected to be $1.45-1.55.
The Q3 outlook is based on the following assumptions:
More significantly, Itron revised its full-year 2025 guidance, lowering its revenue expectations while substantially raising its EPS projections. The company now expects full-year revenue of $2.35-2.4 billion, down from its February outlook of $2.4-2.5 billion. However, non-GAAP EPS guidance was increased to $6.00-6.20, up 13% from the previous outlook of $5.20-5.60.
The following slide compares the original and revised full-year outlook:
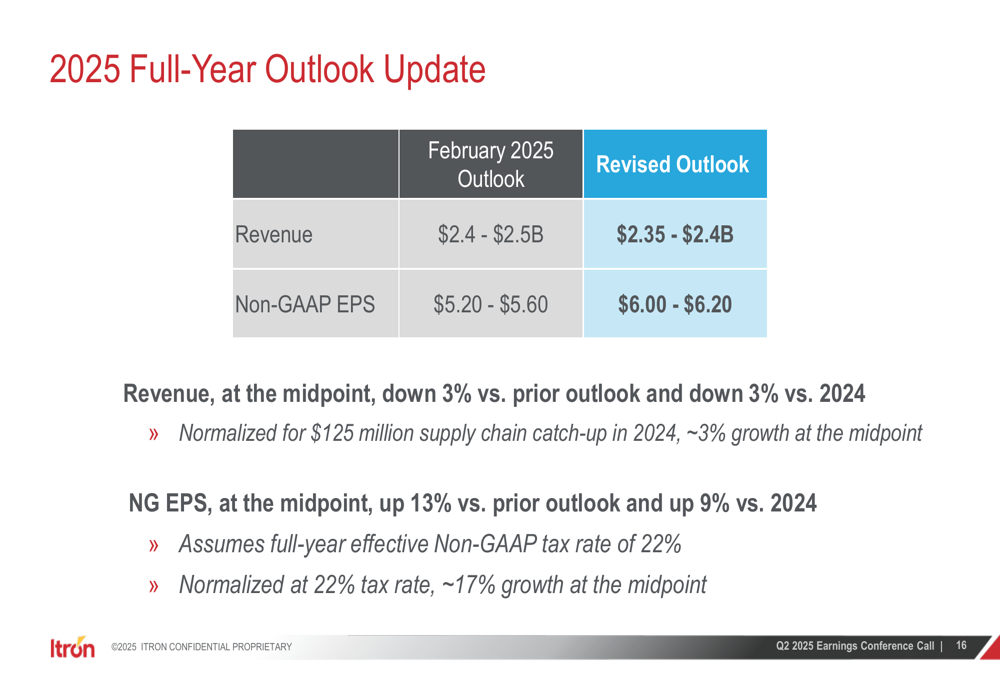
Management noted that the revised revenue outlook represents a 3% decline versus 2024, but when normalized for the $125 million supply chain catch-up that occurred in 2024, it reflects approximately 3% growth. Similarly, the updated EPS guidance represents 9% growth versus 2024, or approximately 17% growth when normalized for tax rate differences.
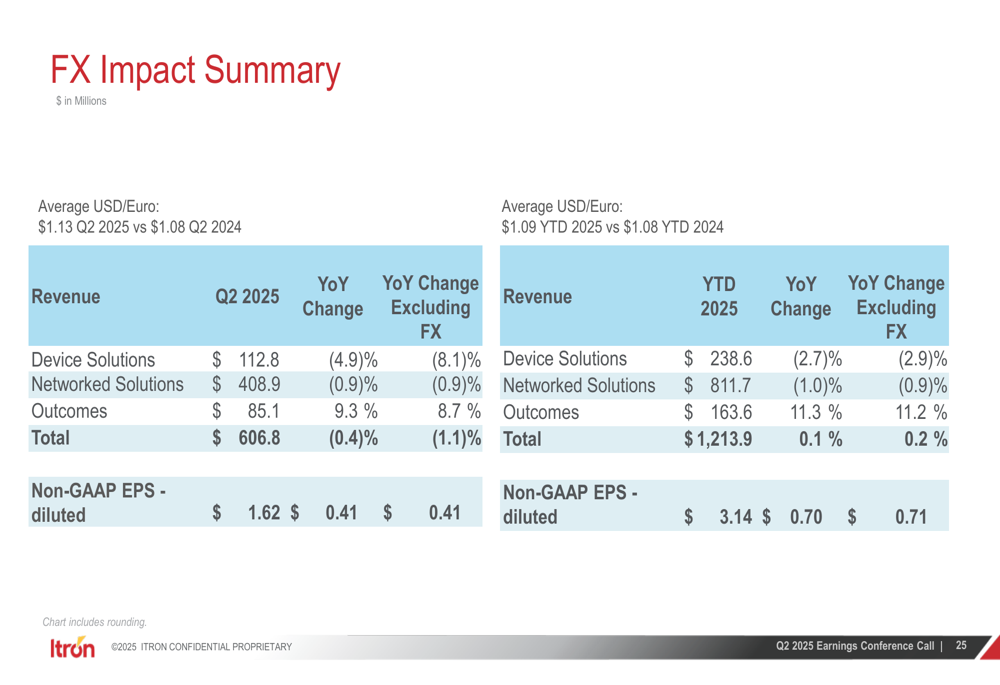
The company’s foreign exchange exposure is detailed in the following summary, which shows the impact of currency fluctuations on both revenue and non-GAAP EPS:
Itron’s revised guidance suggests that while the company faces some revenue headwinds, its focus on operational efficiency and higher-margin business is expected to drive continued improvement in profitability metrics throughout the remainder of 2025.
Full presentation:
This article was generated with the support of AI and reviewed by an editor. For more information see our T&C.