Uber stock surges after Nvidia partnership announcement

Introduction & Market Context
KeyCorp (NYSE:KEY) released its first quarter 2025 earnings presentation on April 17, 2025, showcasing significant year-over-year improvements across multiple financial metrics. The bank reported earnings per share of $0.33, representing a 65% increase compared to the same period last year. This performance comes amid a strengthening capital position and growing client relationships, though the stock showed mixed reaction in pre-market trading, up 0.92% to $14.20.
The bank’s presentation, delivered by Chairman and CEO Chris Gorman and CFO Clark Khayat, highlighted KeyCorp’s focus on differentiated fee businesses, relationship growth, risk management, and balance sheet strengthening as key strategic pillars driving results.
Quarterly Performance Highlights
KeyCorp reported substantial improvements in its financial performance for Q1 2025. Total (EPA:TTEF) revenue (taxable equivalent) reached $1,773 million, up 15.7% year-over-year and 105.0% quarter-over-quarter. Net interest income grew to $1,105 million, representing a 24.7% increase from Q1 2024 and a 4.1% rise from the previous quarter.
The following chart details KeyCorp’s Q1 2025 financial highlights, showing strong performance across multiple metrics:
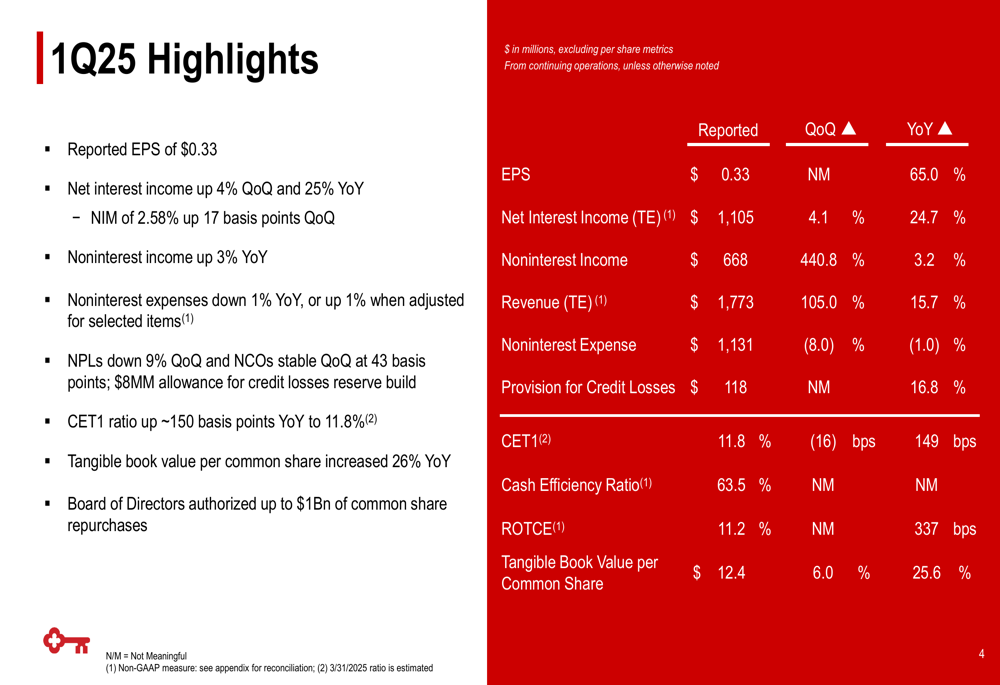
Noninterest income increased 3.2% year-over-year to $668 million, while noninterest expense decreased by 1.0% to $1,131 million, demonstrating the bank’s focus on operational efficiency. The cash efficiency ratio stood at 63.5%, while return on tangible common equity (ROTCE) improved by 337 basis points year-over-year to 11.2%.
Tangible book value per common share grew impressively by 25.6% year-over-year to $12.4, reflecting the bank’s strengthening financial position and value creation for shareholders.
Balance Sheet and Credit Quality
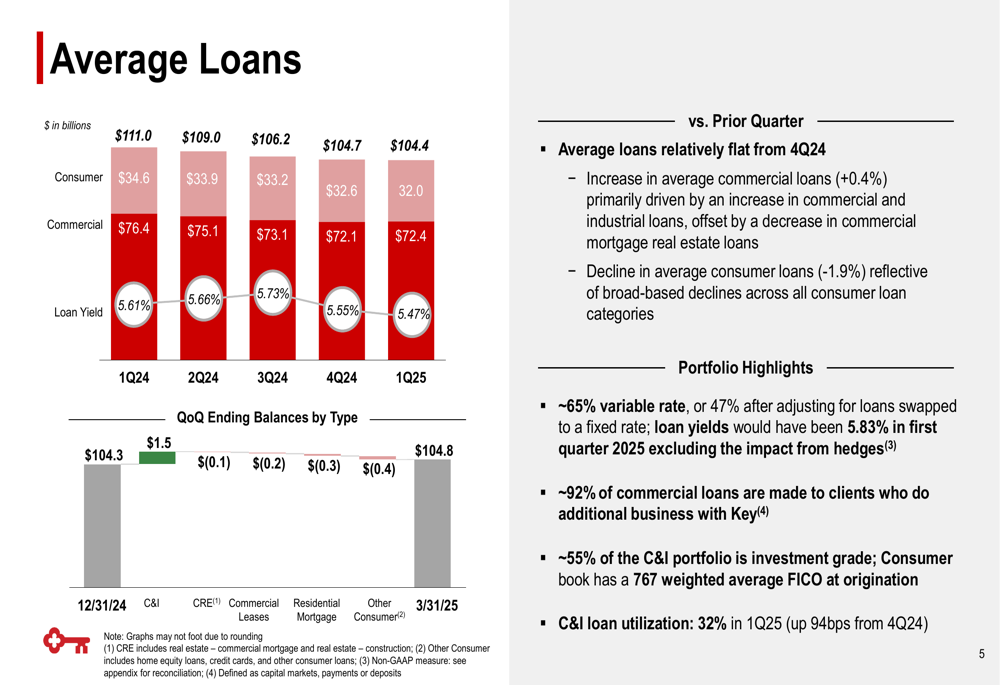
KeyCorp’s balance sheet showed stability with some strategic shifts in composition. Average loans remained relatively flat year-over-year, with consumer loans decreasing from $34.6 billion in Q1 2024 to $32.0 billion in Q1 2025, while commercial loans declined slightly from $76.4 billion to $72.4 billion over the same period.
The following slide provides a detailed breakdown of KeyCorp’s loan portfolio:
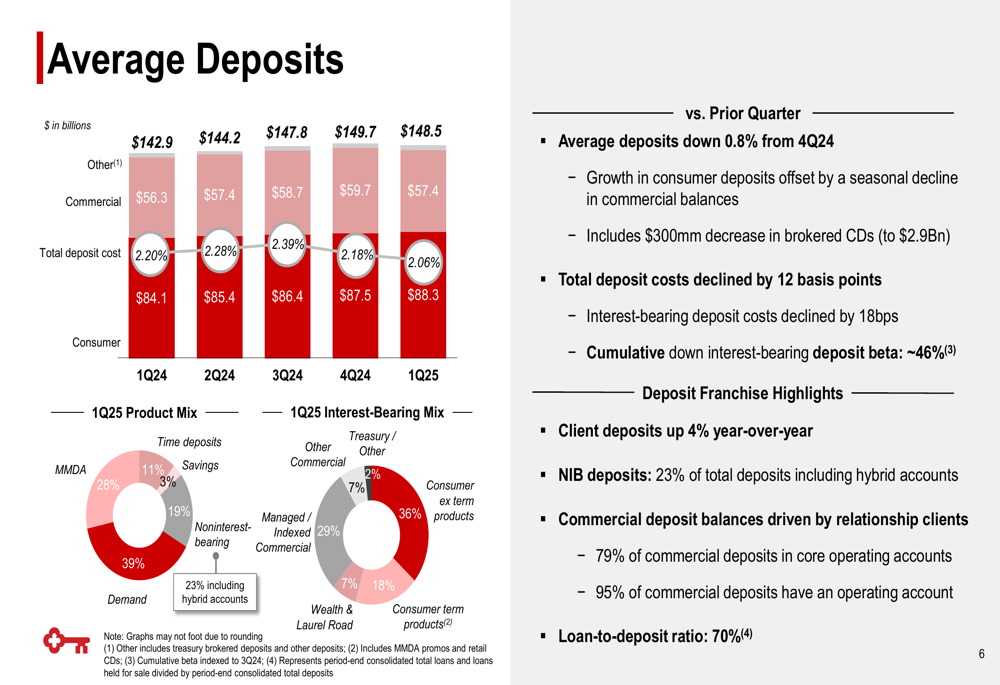
On the funding side, average deposits increased from $142.9 billion in Q1 2024 to $148.5 billion in Q1 2025, with consumer deposits growing from $84.1 billion to $88.3 billion. The total deposit cost decreased from 2.20% to 2.06% year-over-year, demonstrating improved funding efficiency. The loan-to-deposit ratio stood at a healthy 70%.
The deposit breakdown and trends are illustrated in this chart:
Credit quality metrics showed improvement, with nonperforming loans declining 9% quarter-over-quarter. Net charge-offs were 43 basis points of average loans, while the bank maintained an allowance for credit losses of 1.63% of period-end loans, slightly down from 1.68% a year earlier.
Net Interest Income and Margin
KeyCorp’s net interest income and margin showed significant improvement, with net interest income increasing from $1,061 million in Q4 2024 to $1,105 million in Q1 2025. The net interest margin expanded from 2.41% to 2.58% over the same period.
This expansion was driven by several factors, as shown in the following waterfall chart:
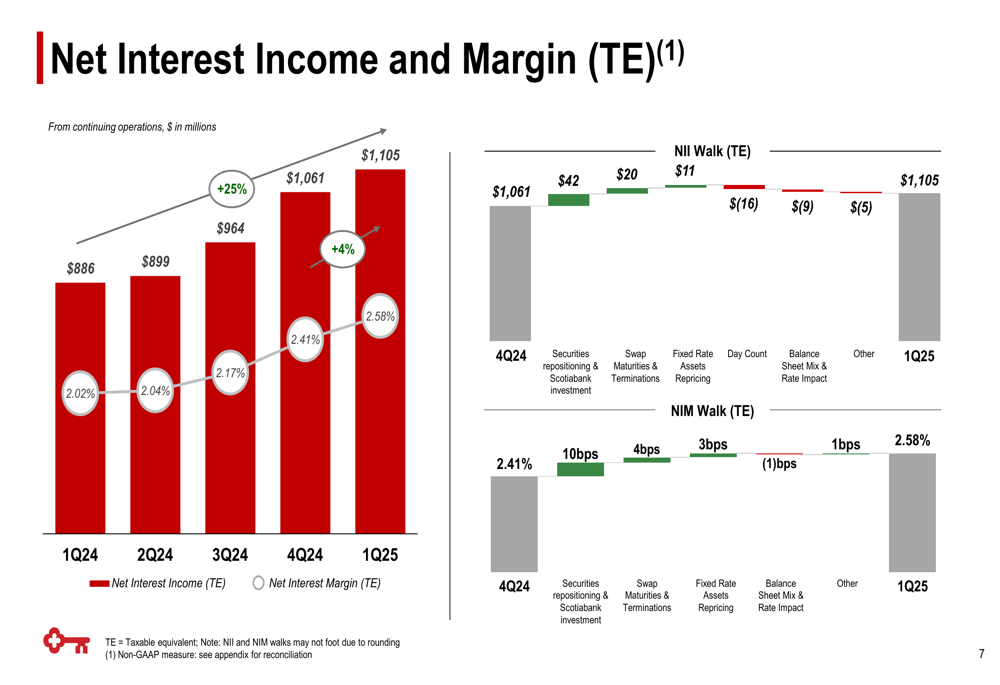
The margin improvement was primarily attributed to securities repositioning and Scotiabank (TSX:BNS) investment (10 basis points), swap maturities and terminations (4 basis points), and fixed rate assets repricing (3 basis points). These positive factors were slightly offset by balance sheet mix and rate impacts (-1 basis point).
Noninterest Income Performance
KeyCorp’s noninterest income showed solid performance, increasing 3% year-over-year to $668 million. On an adjusted basis, this represents a 6% growth. The bank’s fee-based businesses demonstrated strength across multiple categories.
The breakdown of noninterest income sources is illustrated in this chart:
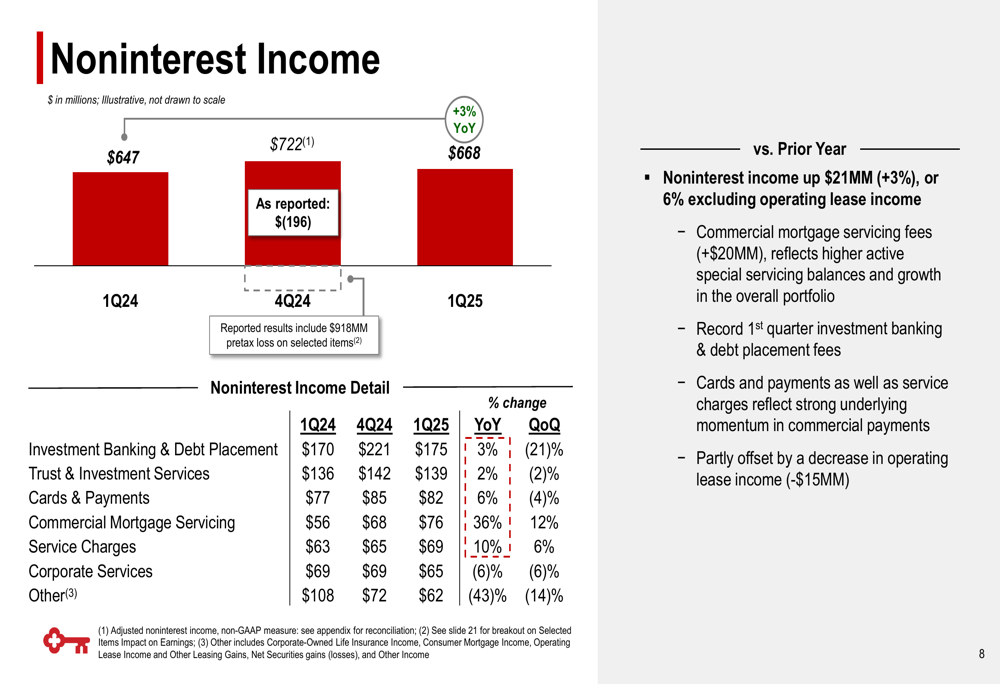
Investment banking and debt placement fees contributed $175 million, while trust and investment services generated $139 million. Cards and payments ($82 million), commercial mortgage servicing ($76 million), service charges ($69 million), and corporate services ($65 million) rounded out the major fee income categories. Commercial mortgage servicing fees notably increased by $20 million.
Capital Position
KeyCorp significantly strengthened its capital position during the quarter. The Common Equity Tier 1 (CET1) ratio increased by approximately 150 basis points year-over-year to 11.8%, while the tangible common equity ratio improved by approximately 240 basis points to 7.4% over the same period.
The following slide illustrates KeyCorp’s capital position improvement:
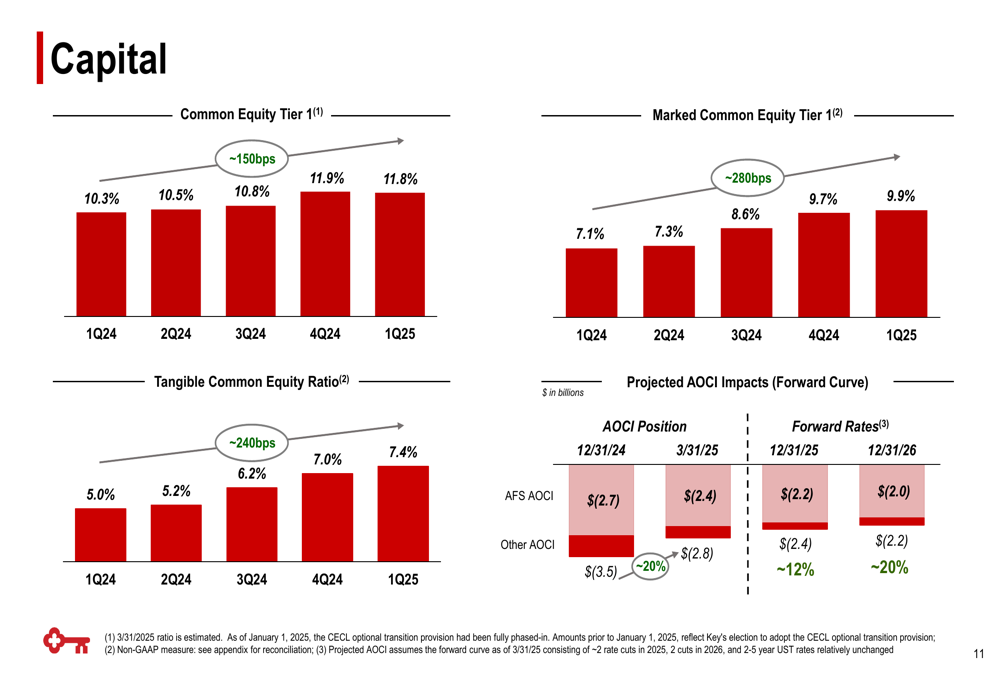
This capital strength provides KeyCorp with enhanced flexibility for strategic investments, potential shareholder returns, and a buffer against economic uncertainties. The marked Common Equity Tier 1 ratio, which includes the impact of accumulated other comprehensive income (AOCI), improved even more dramatically, up approximately 280 basis points year-over-year to 9.9%.
2025 Outlook
Looking ahead, KeyCorp provided a comprehensive outlook for 2025, projecting continued growth in key areas despite some anticipated headwinds in loan volumes. The bank expects average loans to decline by 2-5%, though period-end commercial loans are projected to grow by 2-4%.
KeyCorp’s detailed 2025 outlook is presented in this table:
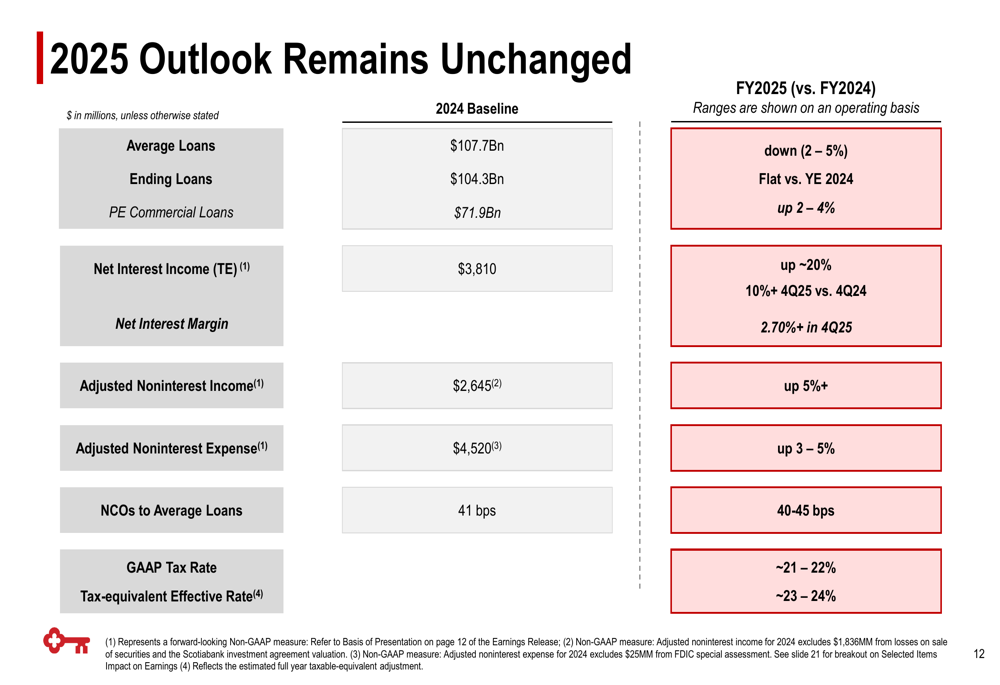
Net interest income is expected to increase by approximately 20% for the full year, with a 10%+ increase in Q4 2025 compared to Q4 2024. The net interest margin is projected to exceed 2.70% by the fourth quarter of 2025. Adjusted noninterest income is forecasted to grow by more than 5%, while adjusted noninterest expense is expected to increase by 3-5%.
Net charge-offs are anticipated to remain in the 40-45 basis point range as a percentage of average loans, reflecting continued solid credit quality.
Conclusion
KeyCorp’s Q1 2025 earnings presentation depicts a bank executing effectively on its strategic priorities, with significant improvements in profitability, capital position, and relationship growth. The 65% year-over-year increase in EPS and 25% growth in net interest income highlight the strength of the bank’s core operations.
While the bank faces some headwinds in loan growth for 2025, the projected increases in net interest income, fee-based revenue, and continued strong credit quality suggest KeyCorp is well-positioned to navigate the evolving economic environment. The substantial improvement in capital ratios provides additional flexibility and resilience as the bank continues to focus on relationship-driven growth and operational efficiency.
Full presentation:
This article was generated with the support of AI and reviewed by an editor. For more information see our T&C.