Five things to watch in markets in the week ahead

Introduction & Market Context
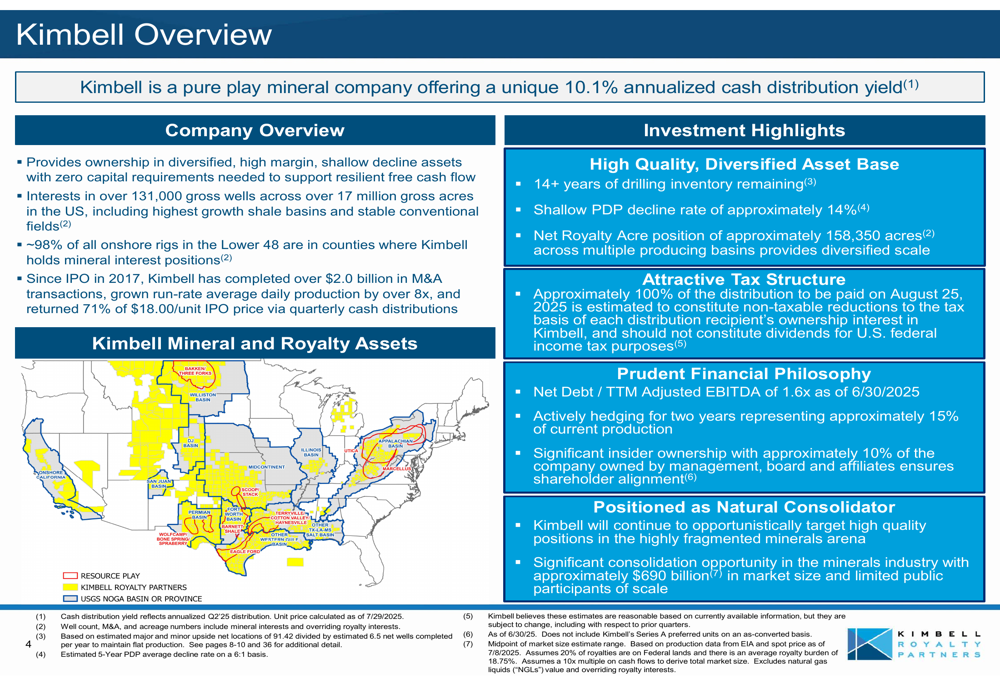
Kimbell Royalty Partners (NYSE:KRP) released its Q2 2025 investor presentation on August 7, 2025, highlighting the company’s performance as a pure-play mineral and royalty company. The presentation comes after Kimbell’s stock showed positive momentum, with premarket trading up 1.42% to $15.00 following the previous day’s close of $14.79.
The company positions itself as a unique investment opportunity in the energy sector, offering exposure to diversified oil and gas assets across multiple U.S. basins with zero capital expenditure requirements. With interests in over 131,000 gross wells across more than 17 million gross acres, Kimbell has established a significant footprint in the U.S. oil and gas royalty space.
As shown in the following overview of the company’s positioning and asset base:
Quarterly Performance Highlights
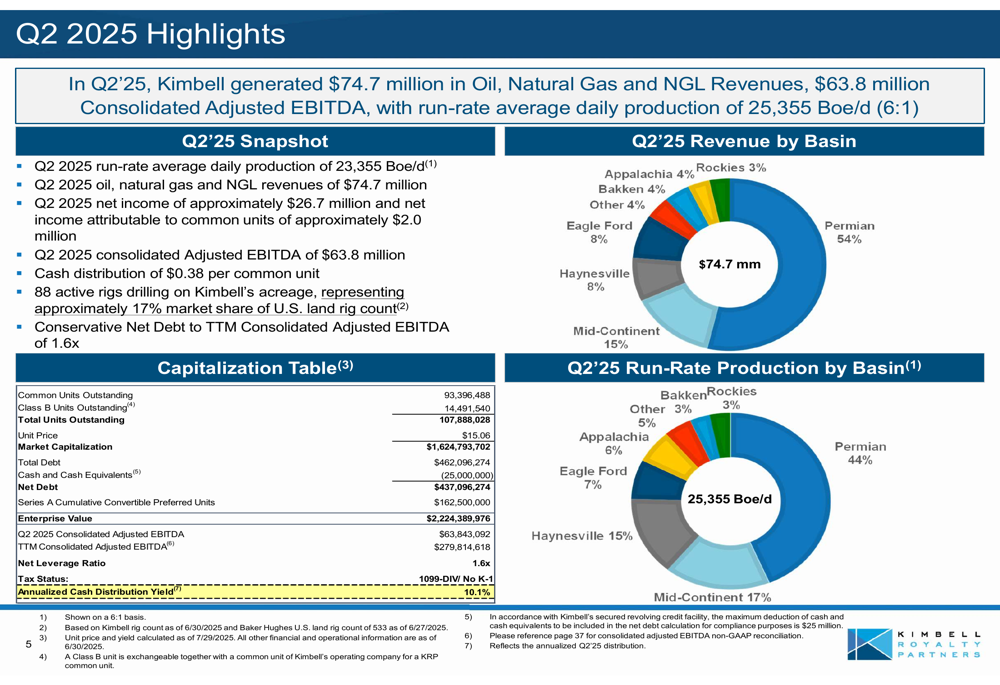
Kimbell reported Q2 2025 run-rate average daily production of 23,355 Boe/d, generating oil, natural gas, and NGL revenues of $74.7 million. The company posted net income of approximately $26.7 million and consolidated Adjusted EBITDA of $63.8 million for the quarter.
Notably, the company declared a cash distribution of $0.38 per common unit, representing a 19% decrease from the $0.47 per unit distributed in Q1 2025. This reduction comes despite the company maintaining a strong annualized cash distribution yield of 10.1%.
The following snapshot provides a comprehensive view of Kimbell’s Q2 2025 financial and operational metrics:
The presentation reveals a slight quarter-over-quarter decline in production from 25.5 Boe/d in Q1 2025 to 25.4 Boe/d in Q2 2025. This contrasts with the company’s Q1 earnings report, which cited a production run rate of 25,841 BOE per day, suggesting potential measurement differences or production fluctuations during the quarter.
Strategic Initiatives
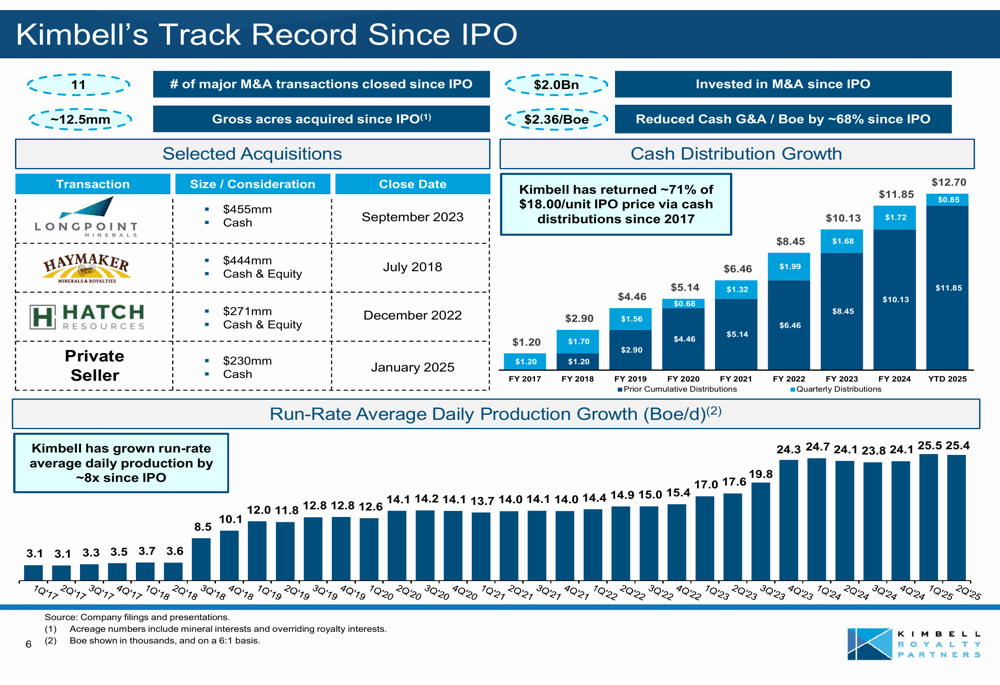
Since its IPO in 2017, Kimbell has completed over $2.0 billion in M&A transactions, positioning itself as a natural consolidator in the highly fragmented minerals arena, which the company estimates has a market size of approximately $690 billion.
The company’s track record shows consistent growth in both distributions and production. Cumulative distributions have reached approximately $12.70 per unit since the IPO, representing about 71% of the initial $18.00 IPO price. Meanwhile, production has grown from 3.1 Boe/d in Q1 2017 to the current 25.4 Boe/d in Q2 2025.
The following chart illustrates Kimbell’s growth trajectory since its IPO:
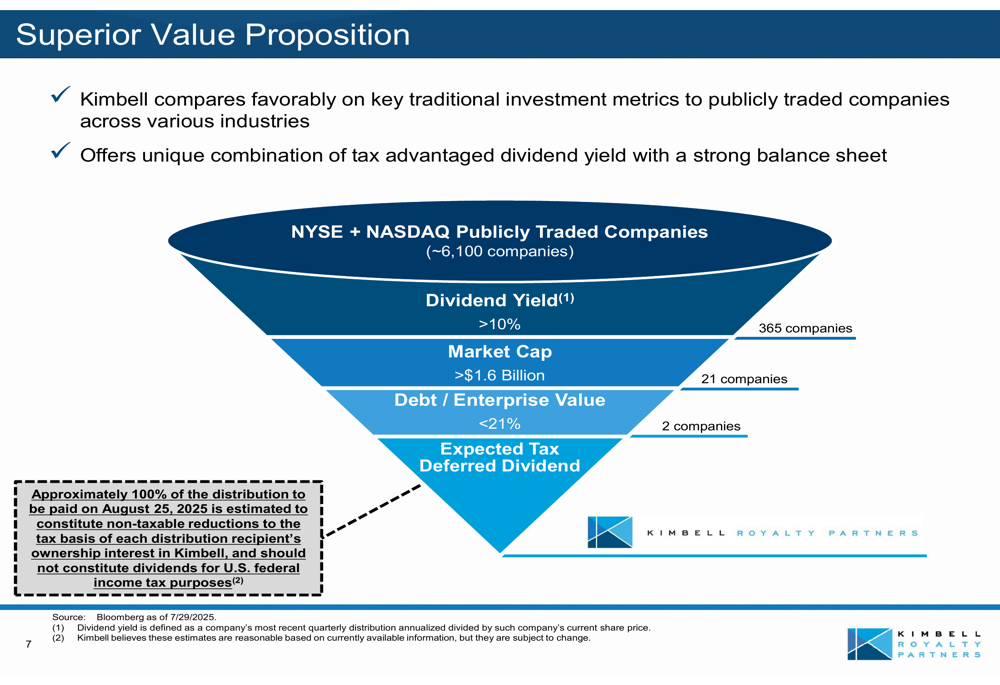
Kimbell positions itself as offering a superior value proposition compared to other publicly traded companies, claiming to be one of only two companies with a dividend yield exceeding 10%, market capitalization above $1.6 billion, and debt-to-enterprise value below 21%.
As shown in the following visualization of Kimbell’s value proposition:
Detailed Financial Analysis
A concerning development in the Q2 presentation is the increase in leverage. The company reported Net Debt to TTM Consolidated Adjusted EBITDA of 1.6x, a significant increase from the 0.9x reported in Q1 2025. Net debt stood at $437.1 million as of Q2 2025, compared to $299 million reported in the Q1 earnings call.
The company maintains a diversified portfolio across multiple basins, with the Permian Basin representing 54% of revenue and 44% of production. Other significant contributors include the Mid-Continent (15% of revenue, 17% of production) and Haynesville (8% of revenue, 15% of production).
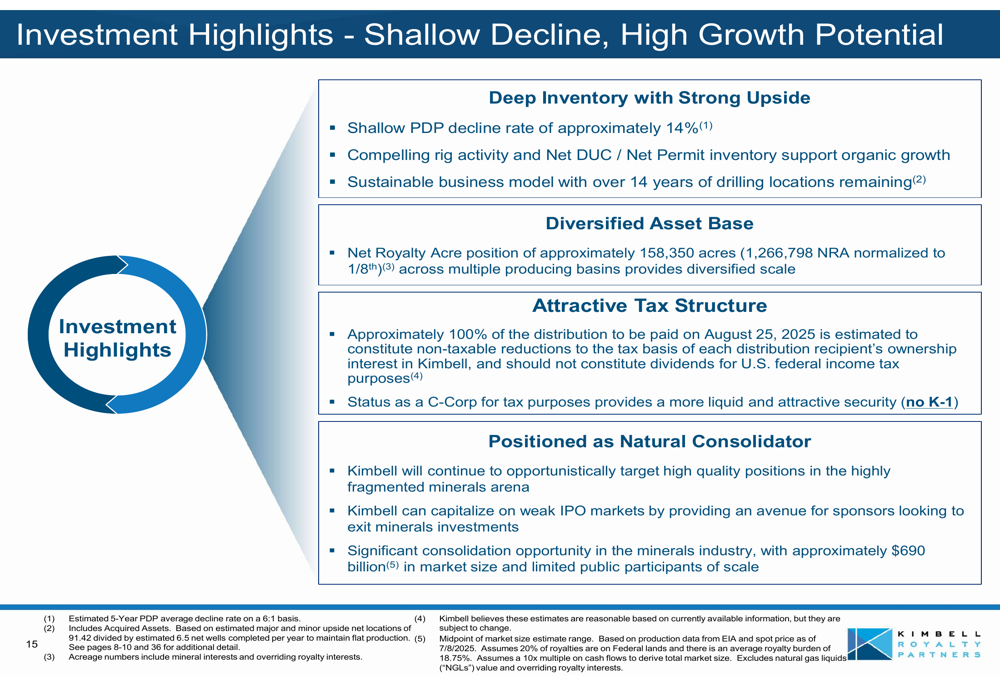
Kimbell continues to benefit from its tax-advantaged structure, with approximately 100% of the Q2 distribution estimated to constitute non-taxable reductions to the tax basis of each distribution recipient’s ownership interest, rather than taxable dividends.
Forward-Looking Statements
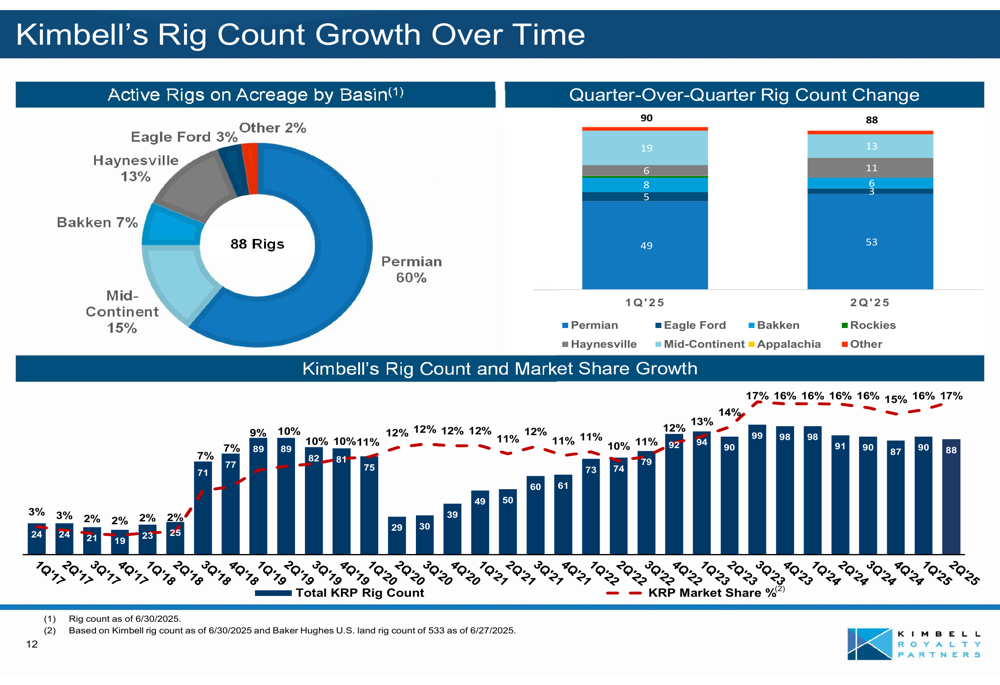
Kimbell’s presentation emphasizes its growth potential, supported by 88 active rigs drilling on its acreage, representing approximately 17% market share of the U.S. land rig count. The company has 823 gross (5.10 net) drilled but uncompleted wells (DUCs) and 687 gross (2.89 net) permitted locations on its acreage.
The following chart shows how Kimbell’s rig count has grown over time:
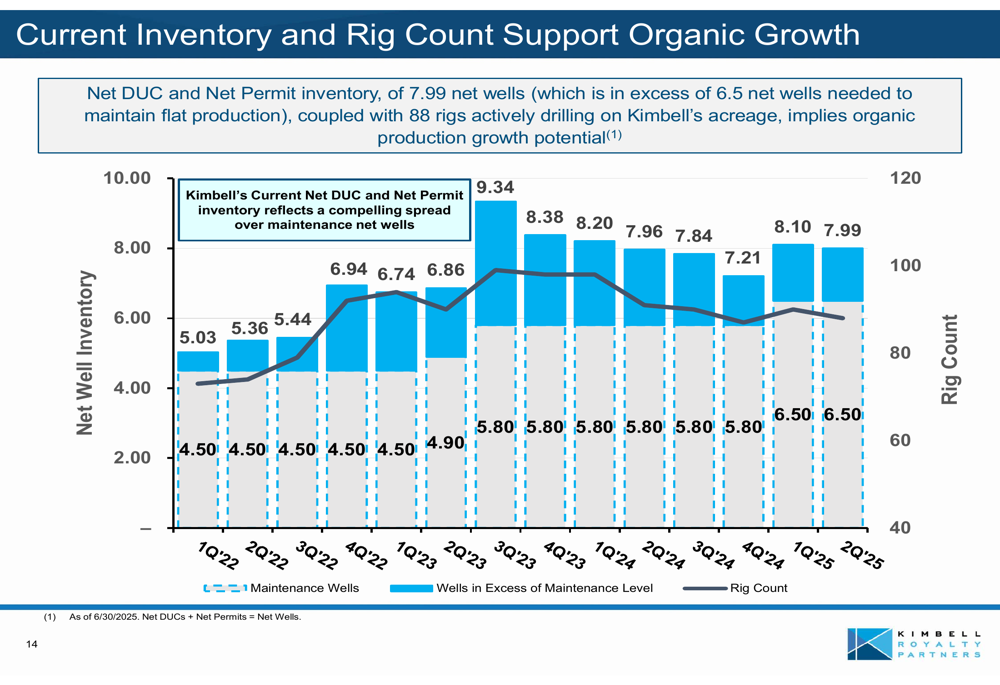
The company estimates that only 6.5 net wells are needed per year to maintain flat production, suggesting that the current inventory of 7.99 net wells (DUCs plus permits) exceeds maintenance requirements and supports organic growth potential.
As illustrated in the following chart showing inventory and rig count supporting organic growth:
Kimbell’s asset base contains over 14 years of drilling inventory across its major and minor properties, with 11,510 gross (77.71 net) upside locations identified as of December 31, 2024. The company applies what it describes as conservative spacing assumptions, averaging 12 gross horizontal wells per drilling spacing unit in the Permian.
The company highlights its investment appeal through several key factors:
Looking ahead, Kimbell appears well-positioned to maintain its production levels and distribution policy, though investors should note the increase in leverage and the quarter-over-quarter decrease in distribution. The company’s diversified asset base, tax-advantaged structure, and significant drilling inventory provide a foundation for long-term sustainability, even as debt levels have risen from Q1 to Q2 2025.
Full presentation:
This article was generated with the support of AI and reviewed by an editor. For more information see our T&C.