Bill Gross warns on gold momentum as regional bank stocks tumble

Introduction & Market Context
Kite Realty Group Trust (NYSE:KRG), a leading owner and operator of open-air shopping centers, presented its Q2 2025 investor update highlighting strong operational performance and strategic portfolio enhancements. The company, with 181 operating properties spanning 30 million square feet, has positioned itself to capitalize on favorable supply-demand dynamics in the open-air retail sector.
Trading at $21.81 with a market capitalization of approximately $5.1 billion, Kite Realty has maintained its investment-grade balance sheet with BBB ratings from all three major agencies (S&P, Moody’s, and Fitch). The company’s focus on grocery-anchored centers in high-growth Sun Belt markets continues to drive its performance in a competitive retail landscape.
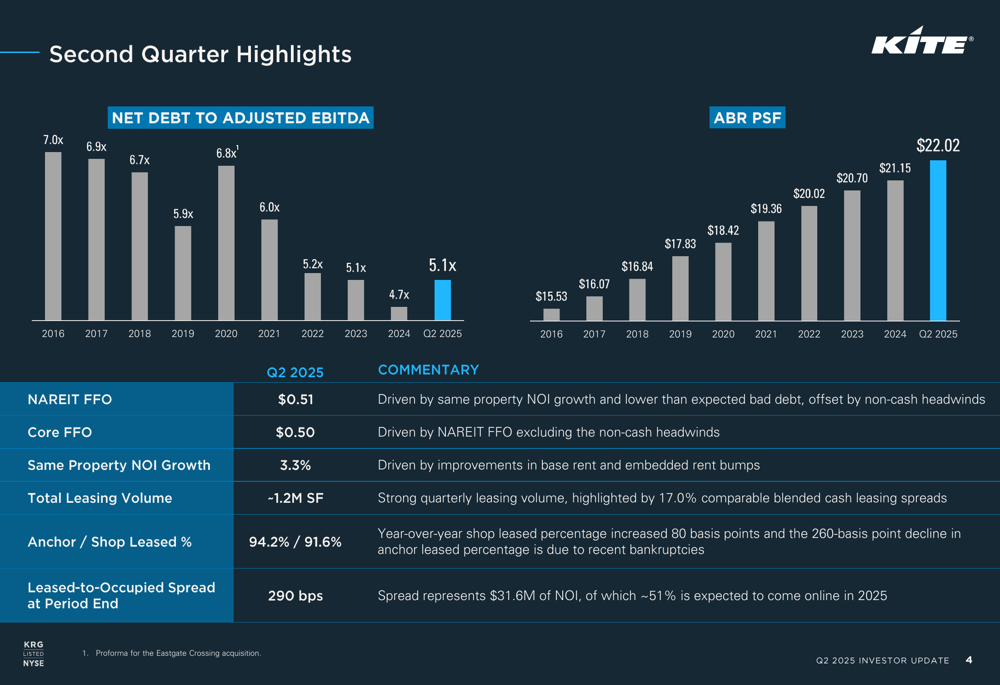
As shown in the following chart of quarterly performance metrics, KRG has demonstrated consistent improvement in both its Net Debt to Adjusted EBITDA ratio and Annualized Base Rent per square foot over the past decade:
Quarterly Performance Highlights
Kite Realty reported NAREIT Funds From Operations (FFO) of $0.51 per share and Core FFO of $0.50 per share for Q2 2025, driven by same property NOI growth and lower than expected bad debt, partially offset by non-cash headwinds. Same property NOI increased by 3.3%, fueled by improvements in base rent and embedded rent bumps.
The company achieved approximately 1.2 million square feet of total leasing volume during the quarter, with impressive 17.0% comparable blended cash leasing spreads. While shop leased percentage increased 80 basis points year-over-year to 91.6%, anchor leased percentage declined 260 basis points to 94.2% due to recent bankruptcies.
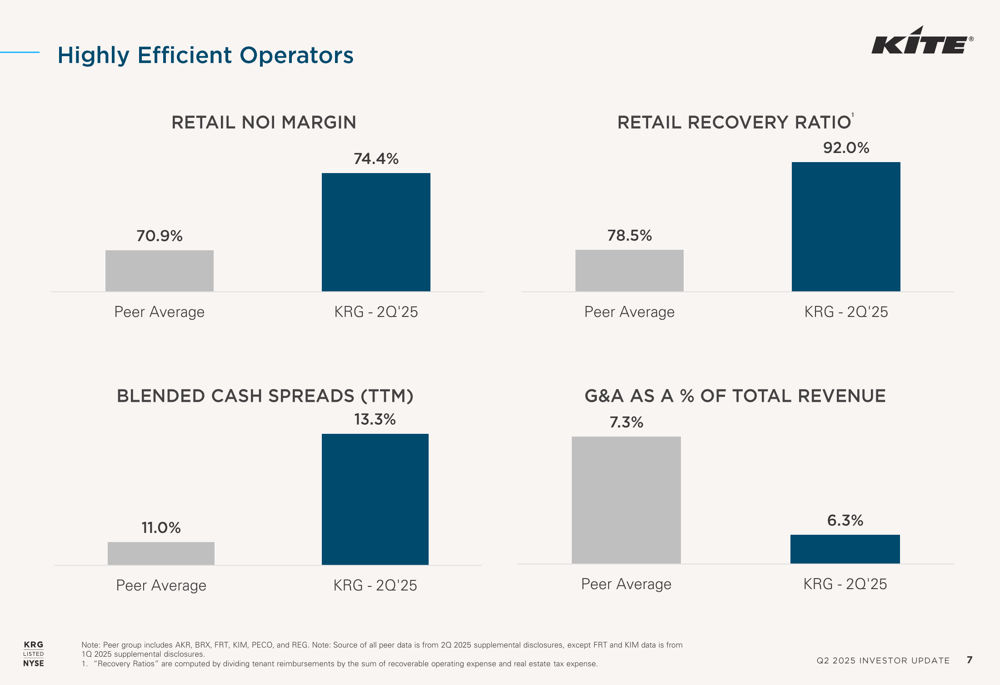
KRG’s operational efficiency continues to outpace its peer group across key metrics, as illustrated in the following comparison:
Based on this strong performance, management increased its 2025 guidance, raising both NAREIT FFO and Core FFO guidance by $0.01 per share. The revised guidance ranges are $2.06-$2.10 for NAREIT FFO and $2.02-$2.06 for Core FFO per share, based on same property NOI growth of 1.50% to 2.50% and full-year credit disruption of 1.85% of total revenues at the midpoint.
Strategic Portfolio Positioning
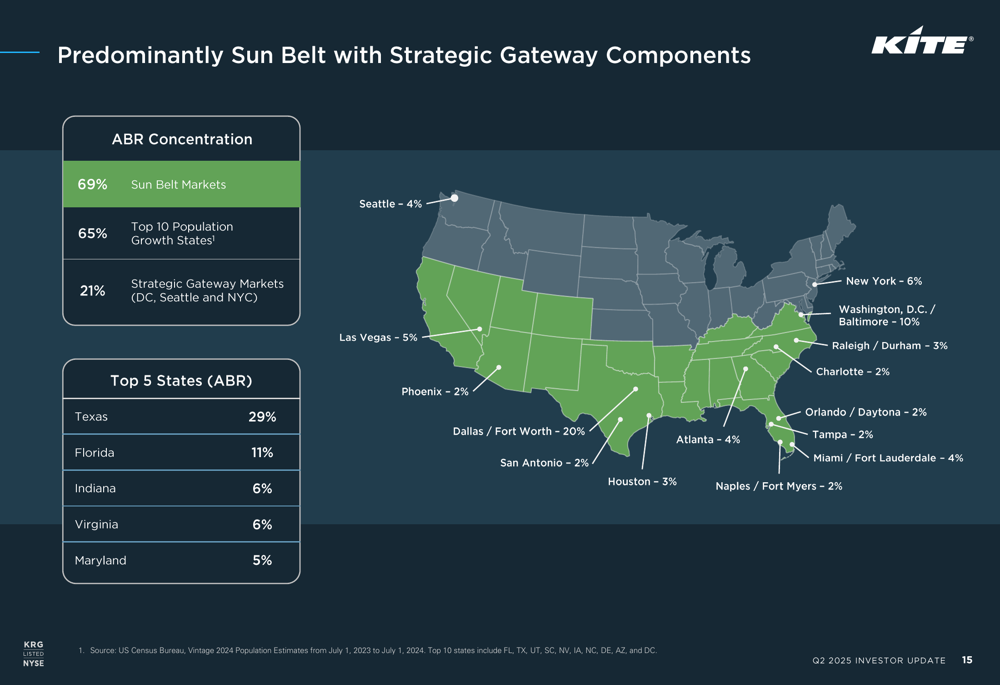
Kite Realty has strategically positioned its portfolio with 69% of weighted ABR coming from Sun Belt markets and 21% from strategic gateway markets (Washington D.C., Seattle, and NYC). The company has particularly focused on states with strong population growth, with 65% of ABR in the top 10 population growth states.
The following map illustrates KRG’s geographic concentration:
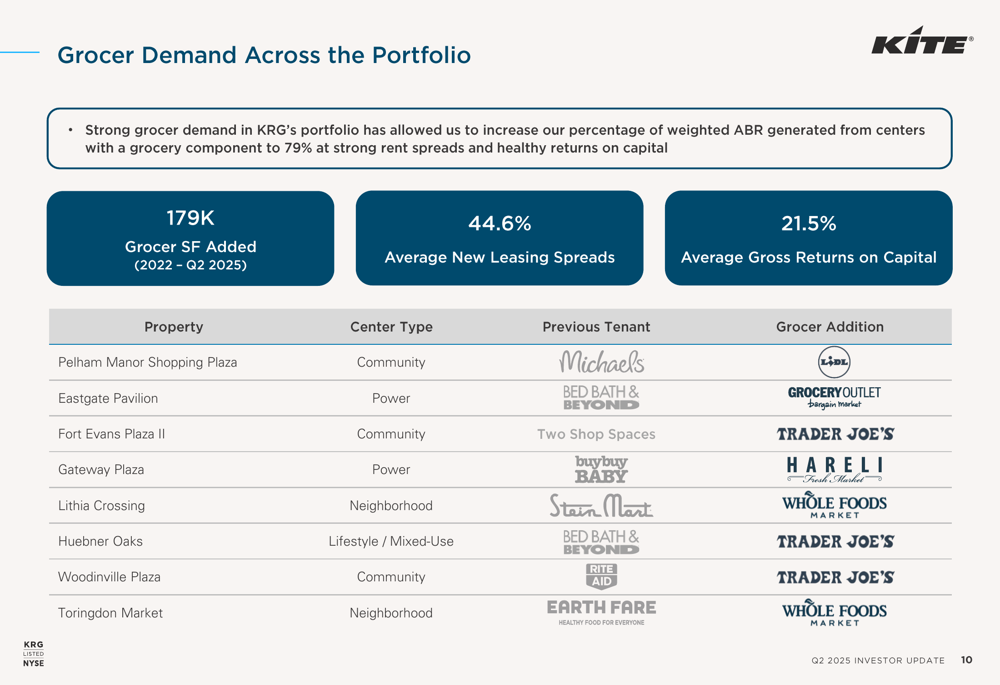
A key element of KRG’s strategy is its focus on grocery-anchored centers, which now represent 79% of weighted ABR. The company has added 179,000 square feet of grocer space since 2022, achieving impressive 44.6% average new leasing spreads and 21.5% average gross returns on capital.
The grocer expansion strategy has included adding prominent brands like Whole Foods Market, Trader Joe’s, and Lidl to replace former tenants such as Bed Bath & Beyond, Michael’s, and Stein Mart, as shown below:
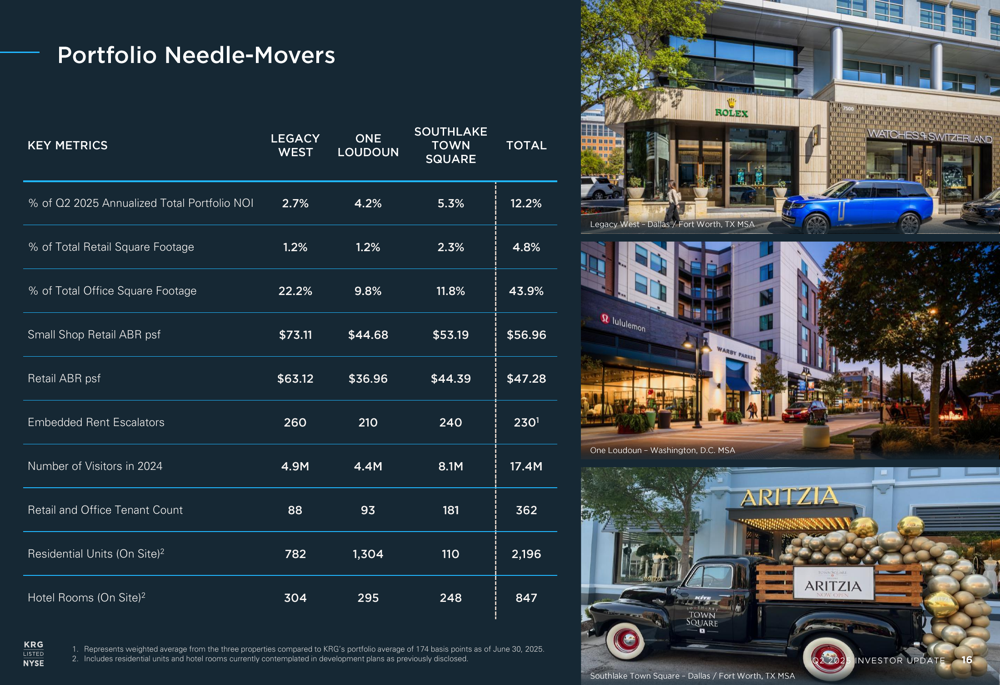
KRG’s portfolio includes three significant "needle-mover" properties—Legacy West, One Loudoun, and Southlake Town Square—which together represent 12.2% of Q2 2025 annualized total portfolio NOI despite comprising only 4.8% of total retail square footage. These premium properties command substantially higher rents, with small shop retail ABR averaging $56.96 per square foot compared to the portfolio average of $22.02.
The following table highlights the key metrics for these premium properties:
Leasing Activity and Tenant Composition
Kite Realty’s leasing momentum remains strong, with a significant signed-not-open pipeline of $31.6 million, representing a 290 basis point leased-to-occupied spread. Approximately 51% of this pipeline is expected to come online in 2025, providing visibility into future NOI growth.
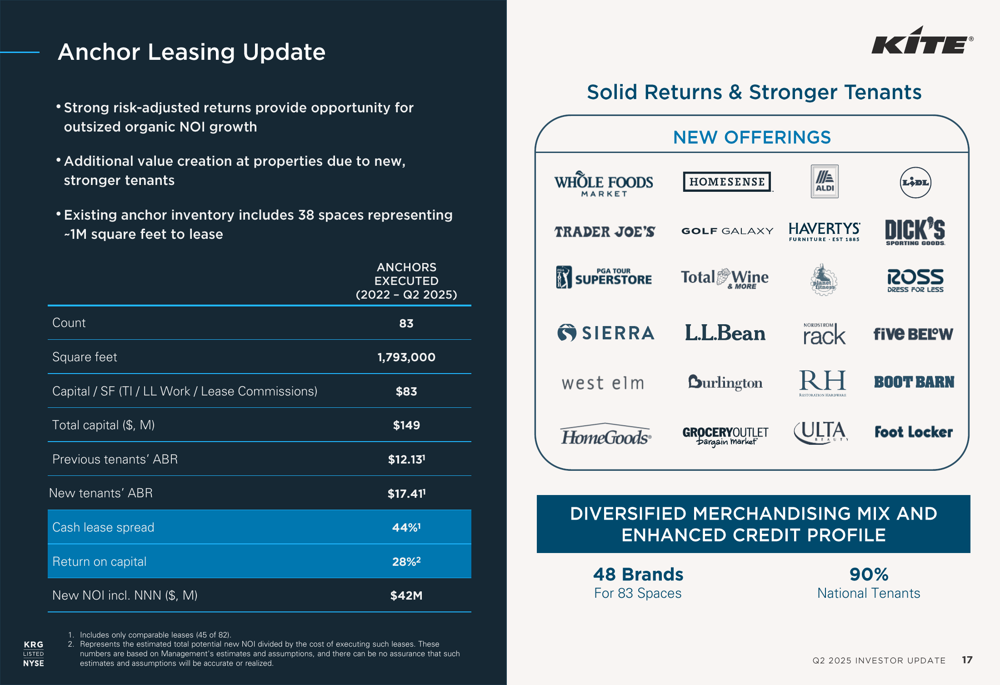
The company has been particularly successful with anchor leasing, executing 83 anchor leases totaling 1.79 million square feet since 2022. These new leases have achieved a 44% cash lease spread and a 28% return on capital, with new tenants paying an average ABR of $17.41 compared to previous tenants’ $12.13.
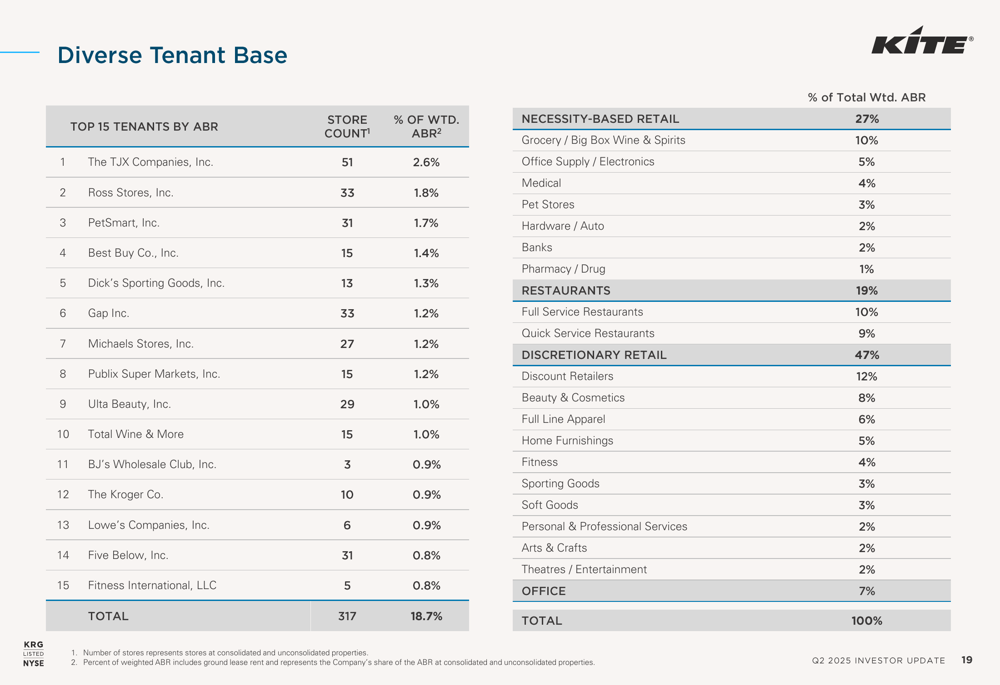
KRG maintains a diverse tenant base, with its top 15 tenants representing only 18.7% of weighted ABR. This diversity provides stability and reduces concentration risk. The tenant mix is well-balanced across necessity-based retail (27%), restaurants (19%), discretionary retail (47%), and office (7%).
The following table details KRG’s top tenants and their contribution to the portfolio:
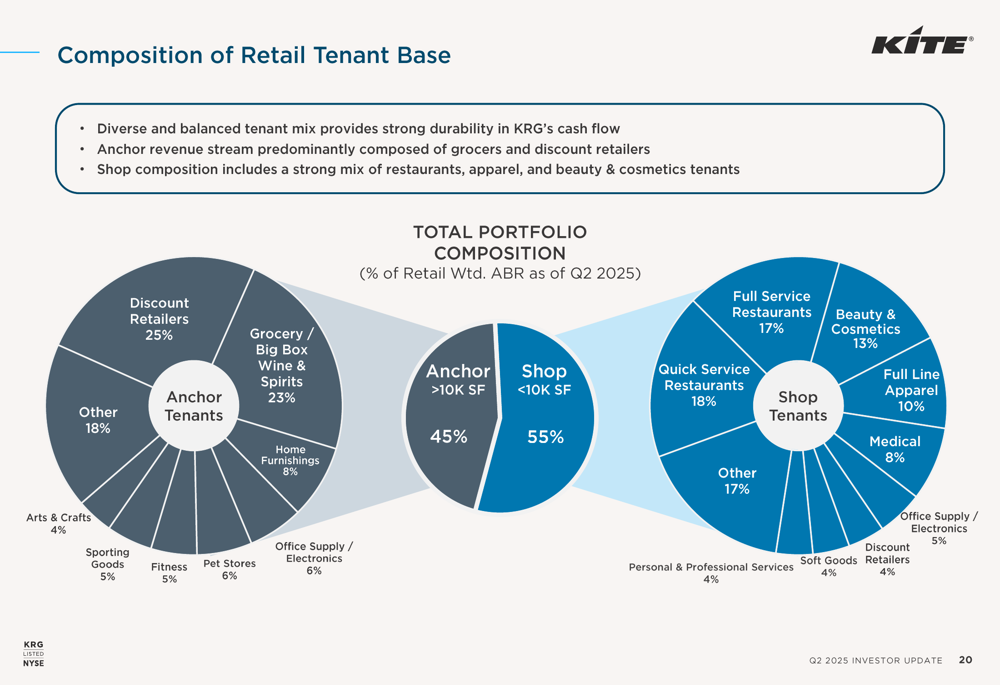
The composition of KRG’s retail tenant base further demonstrates its balanced approach, with anchor tenants representing 45% of retail weighted ABR and shop tenants accounting for 55%. Within these categories, discount retailers and grocers dominate the anchor tenant mix, while restaurants, apparel, and beauty & cosmetics lead among shop tenants.
Balance Sheet and Financial Outlook
Kite Realty maintains one of the strongest balance sheets among its peer group, with a Net Debt to Adjusted EBITDA ratio of 5.1x, compared to the peer average of 5.5x. The company has $1.3 billion in available liquidity, a weighted average interest rate of 4.46%, and 94% fixed-rate debt.
The following chart illustrates KRG’s balance sheet metrics compared to peers:
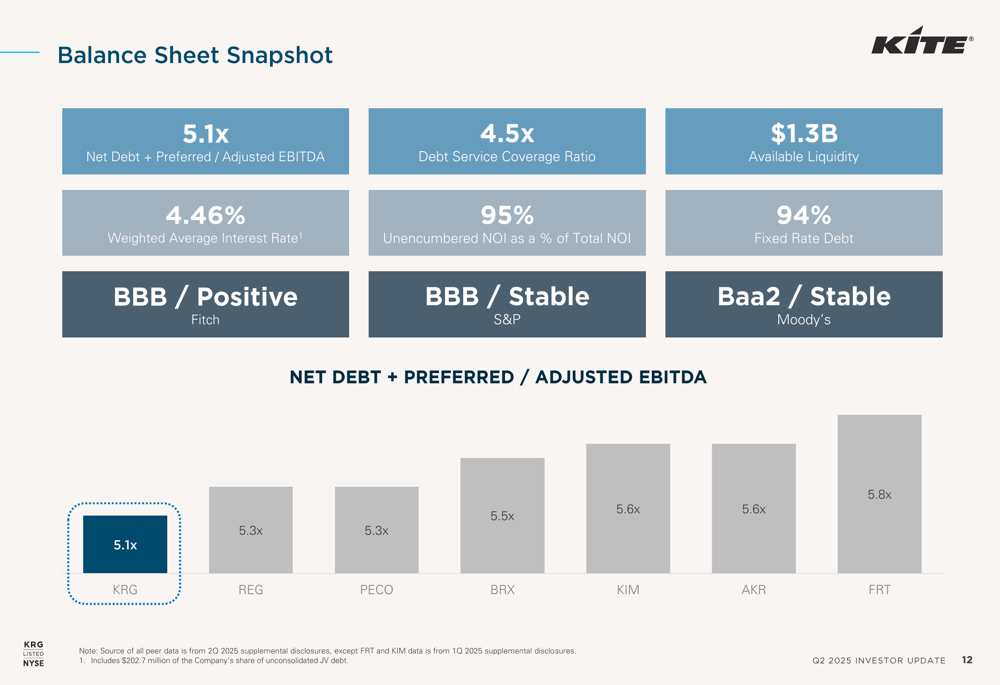
The company’s debt maturity profile is well-staggered, with limited near-term maturities. Only $80 million of debt matures in the remainder of 2025, with the bulk of maturities spread across 2026-2034.
Transaction activity has been significant in 2025, with $476.6 million in acquisitions at a 6.5% effective yield and $258.4 million in dispositions, resulting in net transaction activity of +$218.2 million. These transactions align with KRG’s strategy to improve the portfolio’s cruising speed while maintaining earnings accretion and a modest impact on leverage.
CEO John Kite emphasized the company’s strategic focus, stating, "We are positioned extremely well. I think it’s not reflected in the stock." He highlighted the long-term value creation approach, noting, "This is not a race to fill space. This is more about creating value for our stakeholders over the long term."
With its strong operational performance, strategic portfolio positioning, and robust leasing momentum, Kite Realty appears well-positioned to continue delivering value to shareholders in the remainder of 2025 and beyond.
Full presentation:
This article was generated with the support of AI and reviewed by an editor. For more information see our T&C.