Futures slip, bank earnings ahead, Powell to speak - what’s moving markets

Introduction & Market Context
LGI Homes (NASDAQ:LGIH) recently presented its first quarter 2025 results, revealing significant challenges as the homebuilder continues to navigate a difficult housing market. The company’s stock has been under pressure, trading near $55.63 as of May 9, 2025, close to its 52-week low of $52.48 and far from its high of $125.83. The presentation comes after LGI reported disappointing earnings that missed analyst expectations, with affordability remaining the primary obstacle for potential homebuyers.
Quarterly Performance Highlights
LGI Homes reported 996 home closings for Q1 2025, generating $351.4 million in home sales revenues at an average sales price of $352,831. The company maintained 146 active communities at quarter-end. However, profitability metrics showed significant pressure with gross margin at 21.0% and adjusted gross margin at 23.6%. This translated to pre-tax net income of just $5.7 million and net income of $4.0 million, resulting in both basic and diluted earnings per share of $0.17.
As shown in the following financial results summary:
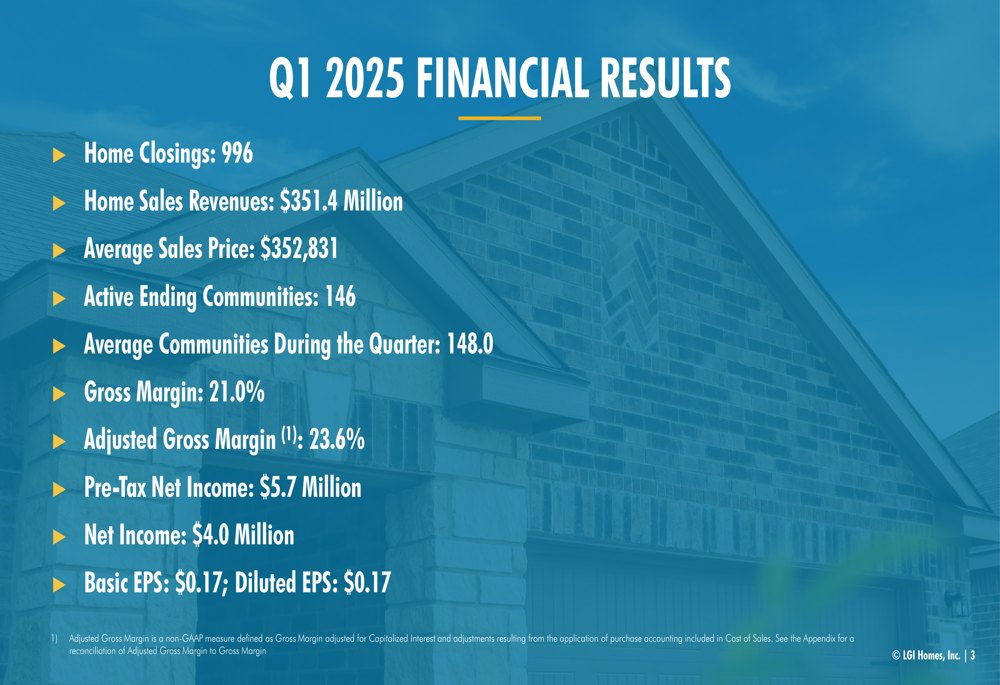
These results represent a substantial miss compared to analyst expectations, with EPS falling $0.52 short of the forecasted $0.69. Revenue also missed projections by approximately 2.75%. The company’s performance was further impacted by a one-time forward commitment expense of $8.6 million that wasn’t prominently featured in the presentation materials.
Historical Performance Trends
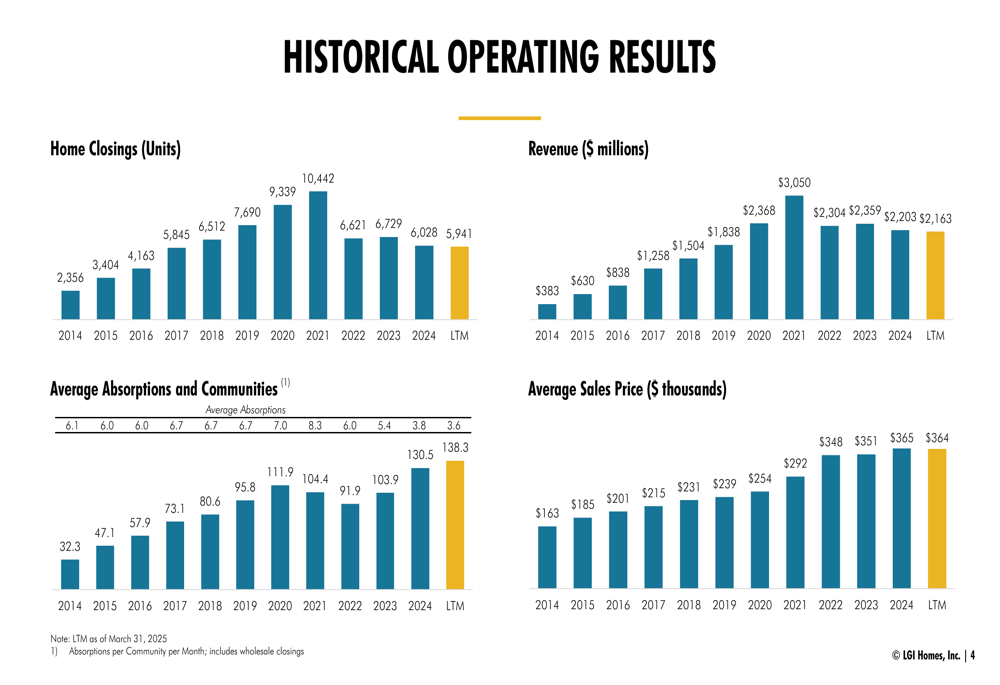
LGI Homes’ current performance represents a significant decline from its peak years. Historical operating data reveals that home closings have fallen dramatically from a high of 10,442 in 2021 to 5,941 for the last twelve months (LTM) ending March 31, 2025. Similarly, revenue has decreased from $3.05 billion in 2021 to $2.16 billion in the LTM period.
The following chart illustrates these long-term trends in closings, revenue, and average sales price:
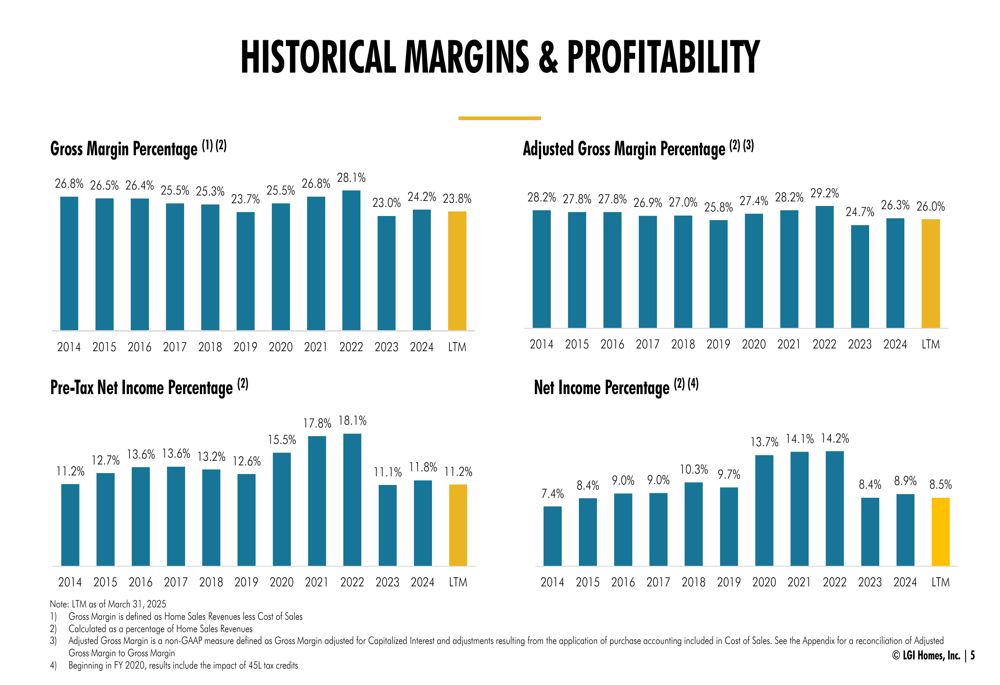
Profitability metrics have also deteriorated over time. While the company maintained gross margins between 23.7% and 28.1% historically, the LTM figure stands at 23.6%. Pre-tax net income percentage has declined from a peak of 18.1% to 11.2% for the LTM period, while net income percentage has fallen from 14.2% at its highest to 8.5% currently.
These margin trends are clearly visualized in the following chart:
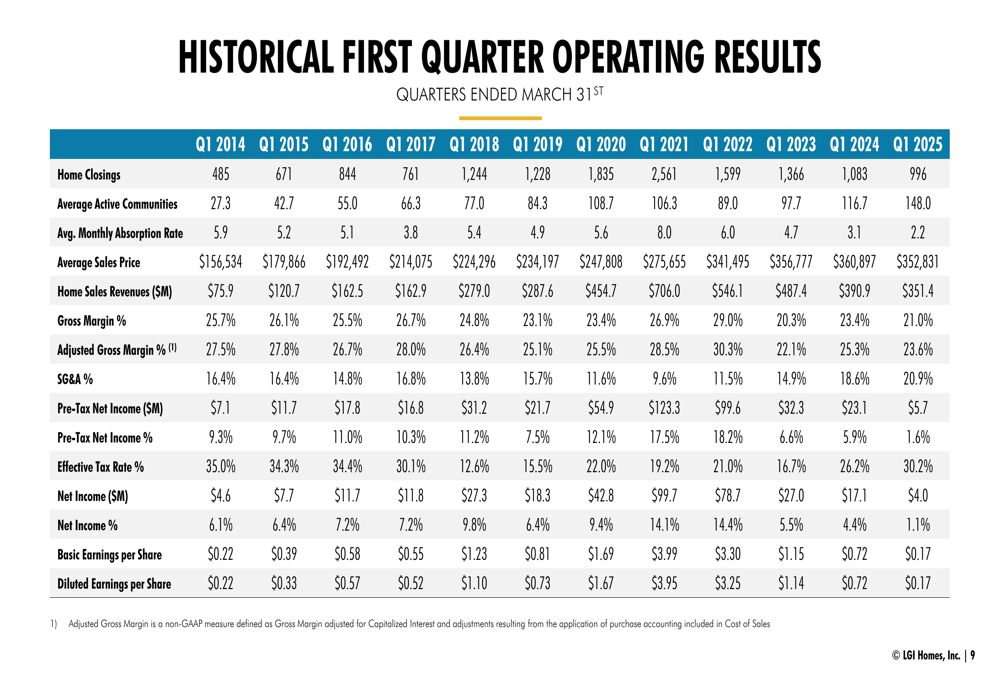
Looking specifically at first-quarter performance over time, the decline becomes even more apparent. Q1 home closings peaked at 2,561 in 2021 but have since fallen to 996 in Q1 2025. Similarly, Q1 net income reached $99.7 million in 2021 but dropped to just $4.0 million in Q1 2025.
Inventory and Balance Sheet Position
Despite operational challenges, LGI Homes has continued to expand its balance sheet. Total (EPA:TTEF) assets have grown from $1.83 billion in 2020 to $3.89 billion as of March 31, 2025. However, this growth has been accompanied by increased leverage, with the gross debt to capitalization ratio rising from 32.1% to 44.3% over the same period.
The company maintains a substantial inventory position, with 67,792 total lots, of which 79.3% are owned and 20.7% are controlled. Of the 53,761 owned lots, 68.9% represent homes in progress, while 23.2% are completed homes. This inventory is spread across multiple regions, with the Central and Southeast regions accounting for the largest portions.
The following chart provides a detailed breakdown of the company’s inventory position:
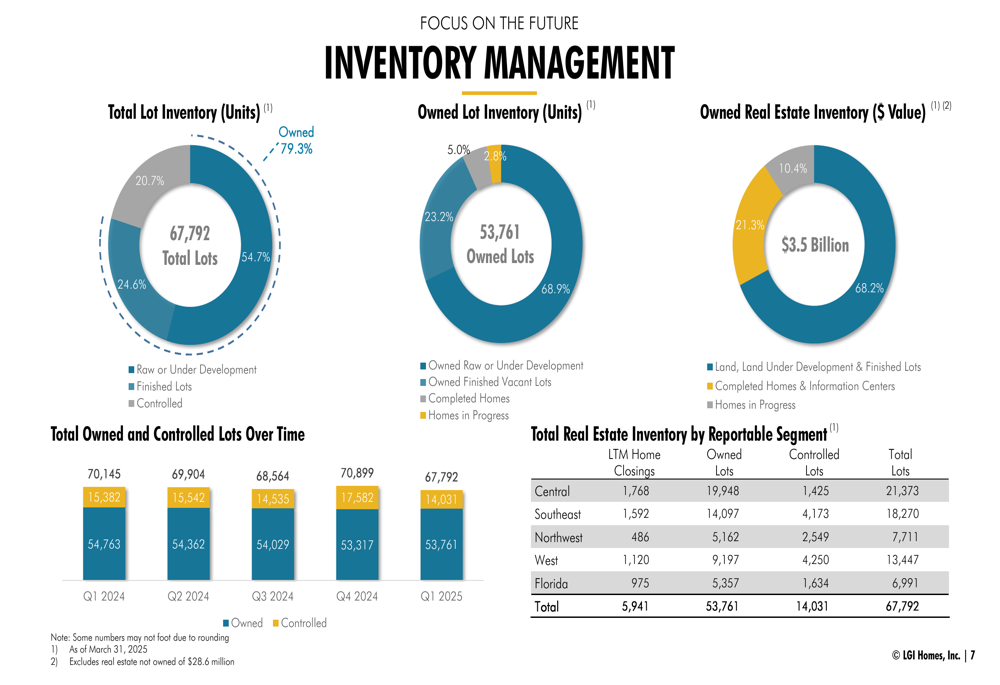
This substantial inventory position represents both a strategic asset and a potential risk in the current housing market environment. With $3.5 billion in owned real estate inventory, LGI Homes has significant capital tied up in its development pipeline.
Forward-Looking Statements
Looking ahead, LGI Homes aims to close 213,000 homes for the full year 2025 and plans to increase its active communities to between 160 and 170 by year-end. The company expects gross margins to improve with increased volume, targeting an adjusted full-year gross margin of 21.7% to 23.2%. The average selling price is projected to range between $360,000 and $370,000.
However, these projections face significant headwinds. As noted by company executive Eric Lieber, "Affordability remains the biggest challenge for buyers." Additional challenges include mortgage rate volatility, potential tariff impacts on profit margins, supply chain disruptions, and intense competition in the housing market.
While LGI Homes’ presentation emphasizes its historical growth trajectory and current inventory positioning, the company’s immediate financial performance reflects the difficult operating environment. Investors will be watching closely to see if the planned community count expansion and anticipated volume increases can reverse the negative trends evident in the first quarter results.
Full presentation:
This article was generated with the support of AI and reviewed by an editor. For more information see our T&C.