Bitcoin price today: struggles at $111k as trade tensions, risk aversion weigh

Introduction & Market Context
Lyft Inc (NASDAQ:LYFT) released its Q2 2025 earnings presentation on August 6, 2025, showcasing record performance across multiple key metrics. The company’s stock closed at $14.51, down 3.27% in regular trading, but showed signs of recovery with aftermarket movement. This quarter’s performance represents a significant improvement from Q1 2025, when the company missed both earnings and revenue forecasts.
Quarterly Performance Highlights
Lyft achieved all-time highs across its core operational and financial metrics in Q2 2025. The company reported 26.1 million active riders, representing a 10% year-over-year increase, while completing 234.8 million rides, up 14% compared to the same period last year.
As shown in the following chart of quarterly active riders:
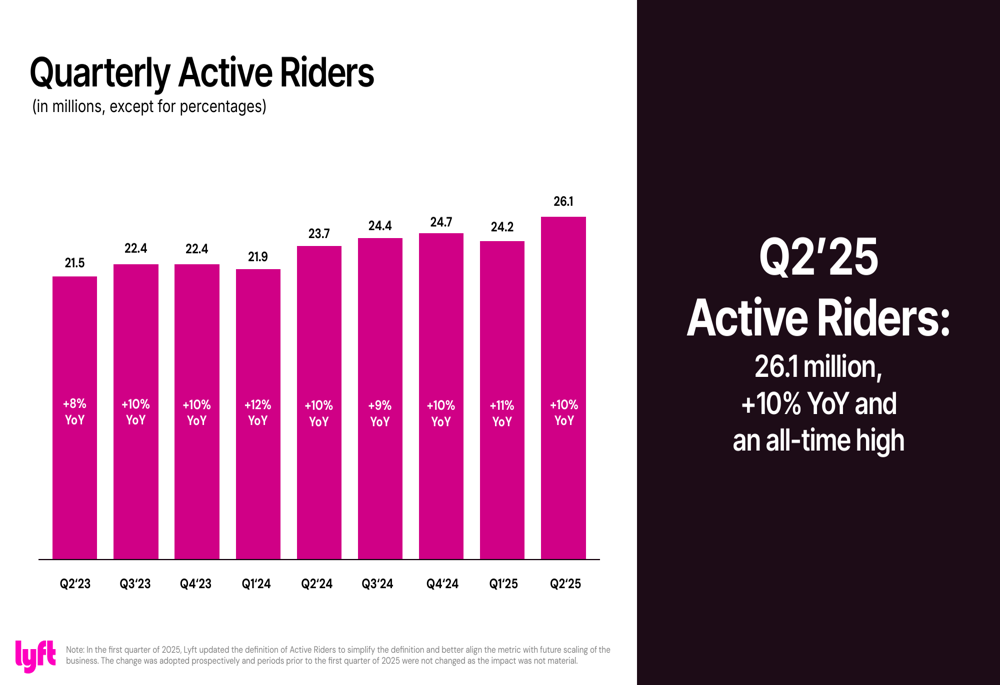
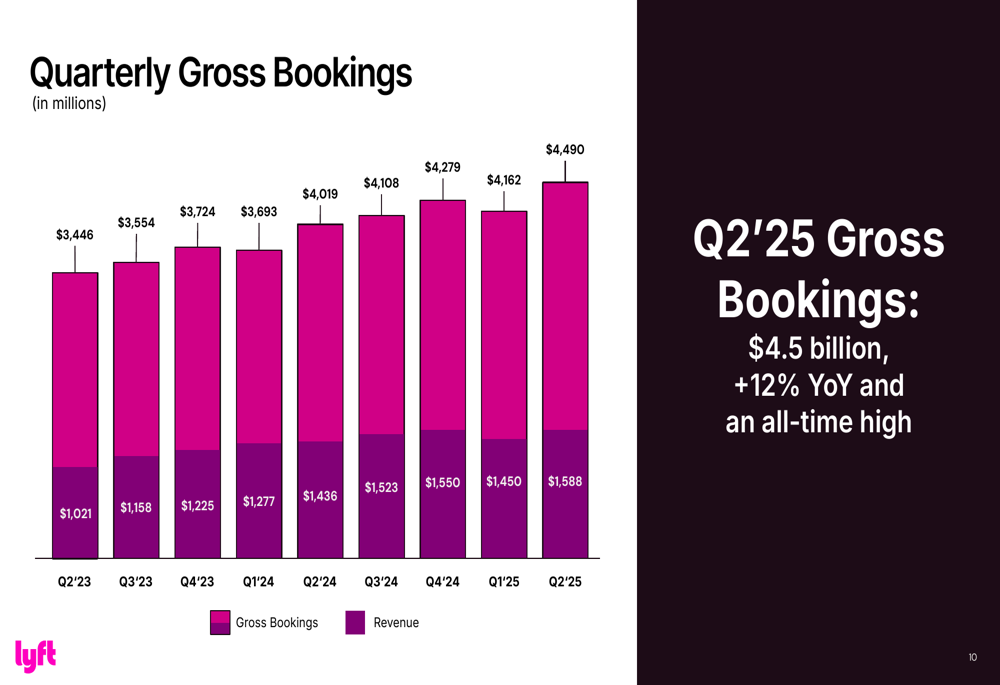
This growth in rider activity translated directly to financial performance, with gross bookings reaching $4.5 billion, a 12% year-over-year increase and another all-time high for the company.
The following chart illustrates Lyft’s consistent gross bookings growth:
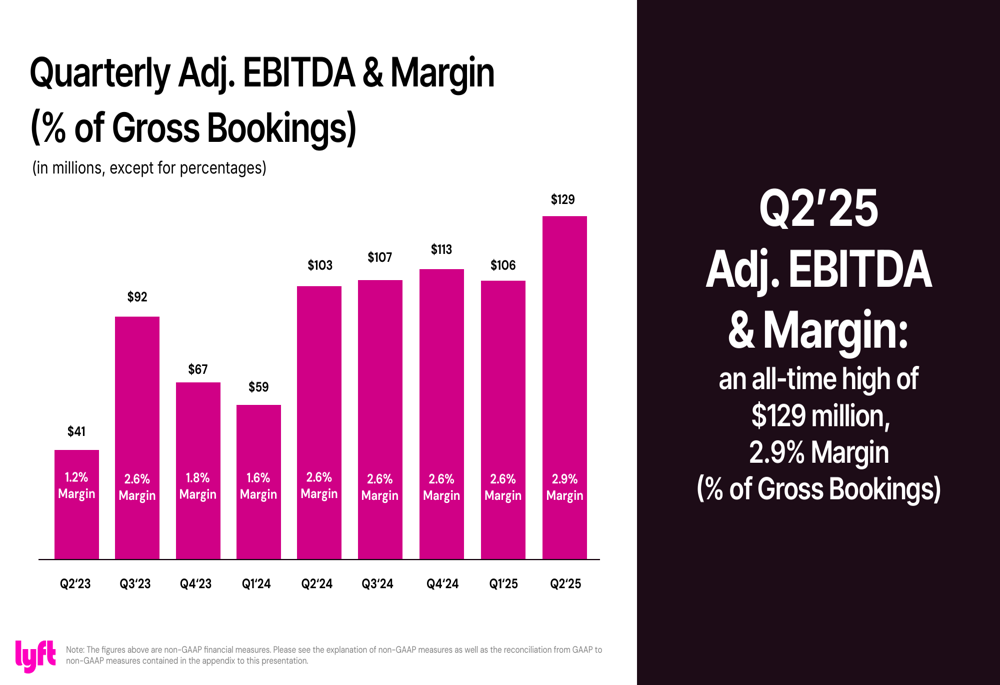
Profitability metrics also showed substantial improvement, with Adjusted EBITDA reaching $129 million (2.9% of gross bookings), representing the highest margin in the company’s history. This continues a trend of steady margin improvement over the past two years.
The company’s EBITDA progression is illustrated in this chart:
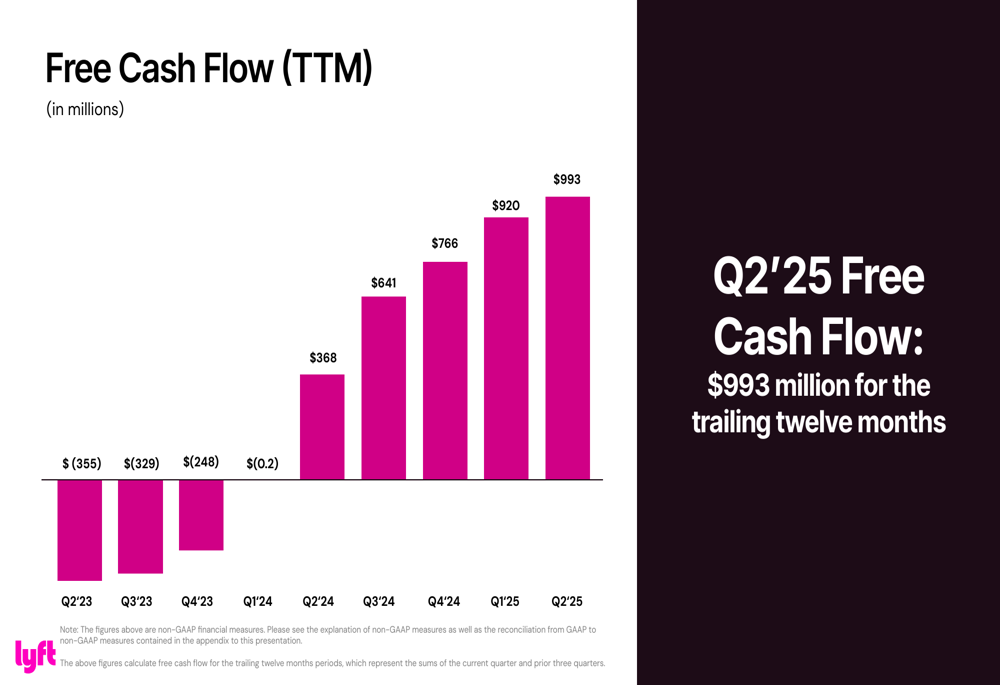
Perhaps most notably, Lyft generated $993 million in free cash flow over the trailing twelve months, demonstrating the company’s improved financial health and operational efficiency.
The dramatic improvement in free cash flow is shown here:
Strategic Initiatives
Partnerships have become a cornerstone of Lyft’s growth strategy. The company reported that over 50 million rides in Q2 2025 were connected to partnerships, representing a 25% year-over-year increase. These partnership-driven rides are proving particularly valuable, as riders connected to partners are 1.5 times more likely to choose high-value transportation modes and take rides that are 1.3 times longer on average.
The company’s partnership strategy is illustrated in this slide:
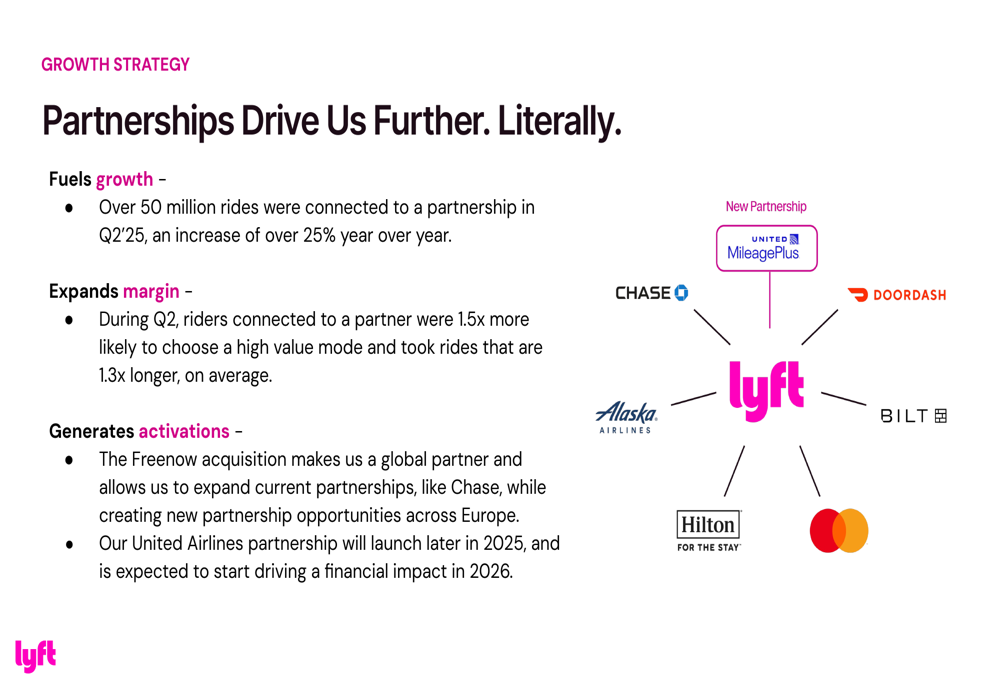
Lyft is also expanding its global footprint through strategic acquisitions and partnerships. The Freenow acquisition is opening new opportunities in Europe, while a forthcoming partnership with United Airlines is set to launch later in 2025. The company is simultaneously building out its autonomous vehicle (AV) ecosystem through partnerships across the value chain, from self-driving technology to fleet management.
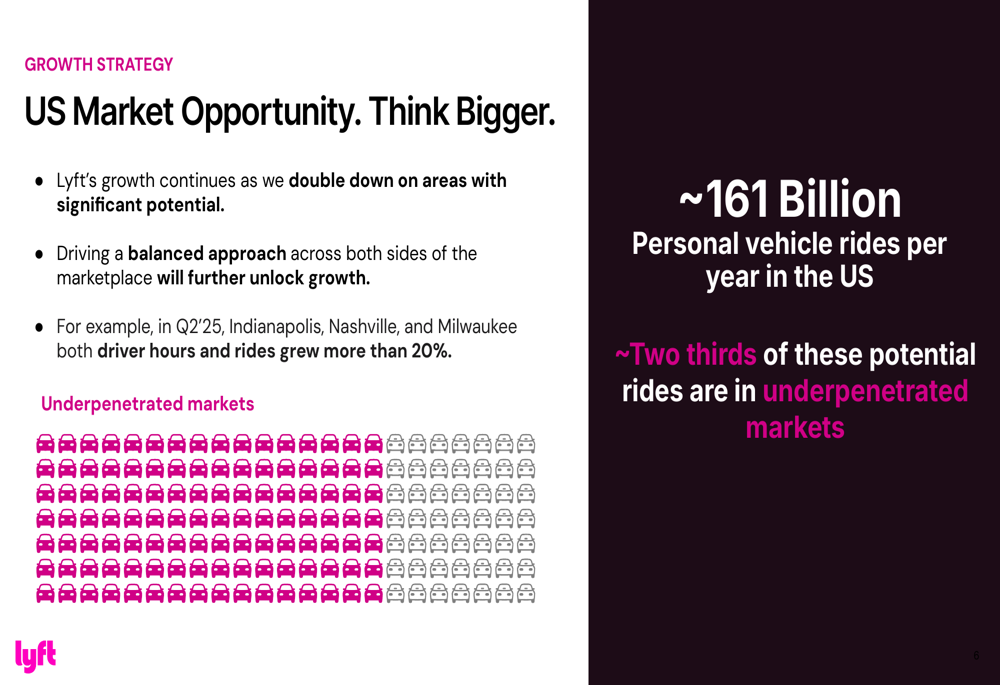
Lyft sees significant growth potential in the U.S. market as well, noting that approximately two-thirds of the estimated 161 billion annual personal vehicle rides occur in currently underpenetrated markets. The company highlighted Indianapolis, Nashville, and Milwaukee as examples of markets that saw over 20% growth in both driver hours and rides during Q2.
The U.S. market opportunity is visualized here:
Operational Improvements
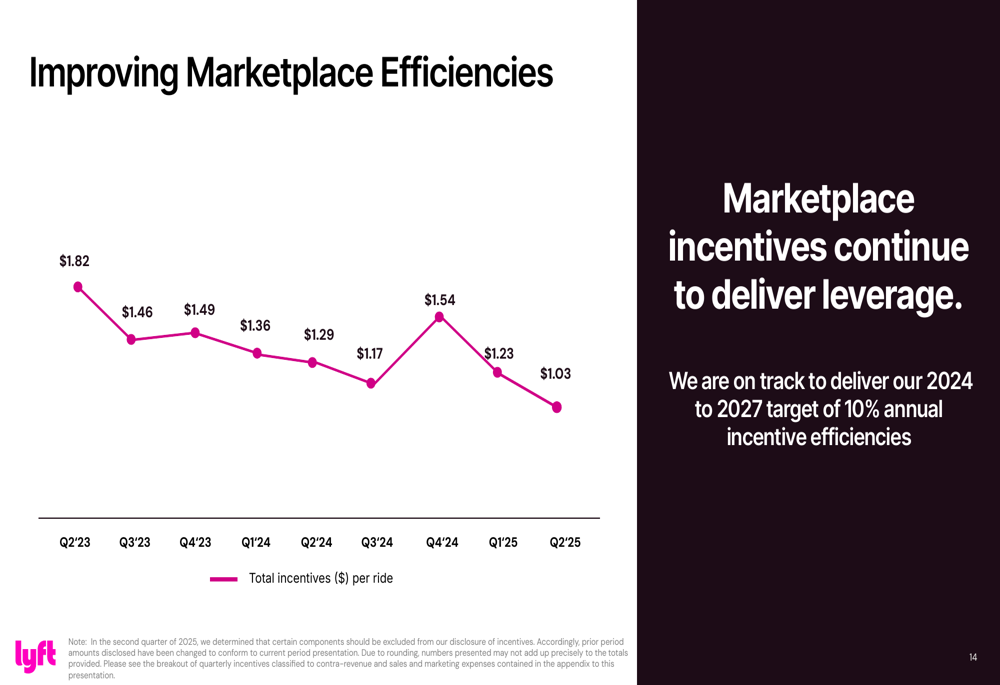
Lyft has made significant strides in improving marketplace efficiency, particularly in reducing incentive costs. Total (EPA:TTEF) incentives per ride decreased to $1.03 in Q2 2025, down from $1.82 in Q2 2023, representing a substantial improvement in operational efficiency. The company stated it is on track to deliver its 2024-2027 target of 10% annual incentive efficiencies.
This trend of improving marketplace efficiency is shown in the following chart:
Forward-Looking Statements
For Q3 2025, Lyft provided guidance of approximately $4.65 billion to $4.80 billion in gross bookings, representing 13% to 17% year-over-year growth. The company expects Adjusted EBITDA of $125 million to $145 million, with an Adjusted EBITDA margin of approximately 2.7% to 3.0% of gross bookings.
The company’s Q3 guidance is summarized here:
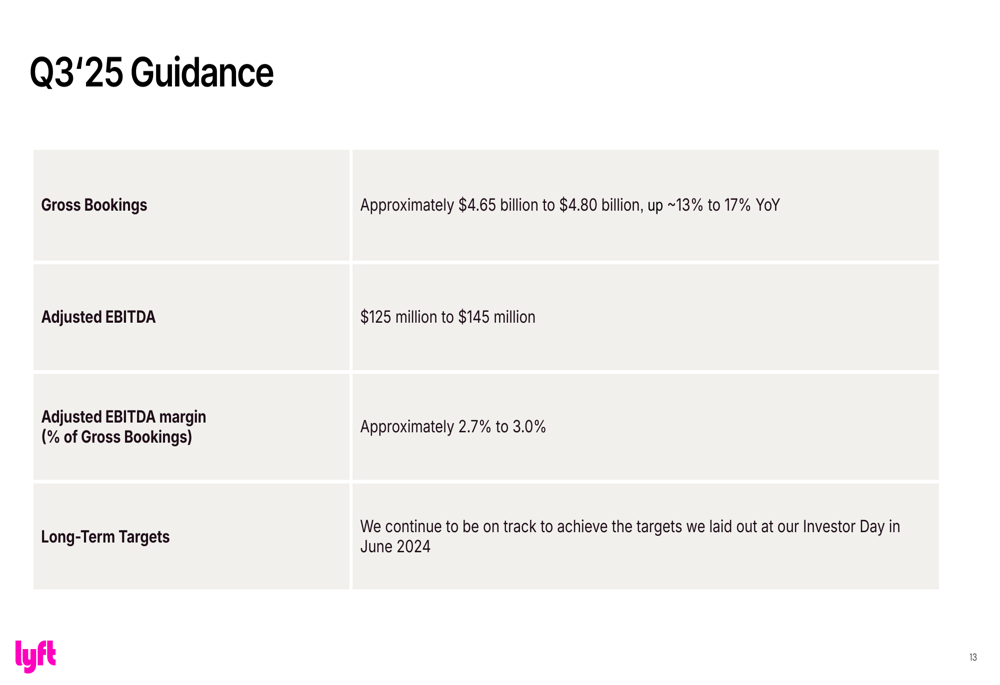
Lyft also reaffirmed it is on track to achieve the long-term targets laid out at its Investor Day in June 2024, suggesting confidence in its strategic direction despite the competitive landscape and economic uncertainties.
Analyst Perspectives
While this presentation focuses on Lyft’s record Q2 performance, it’s worth noting the company’s recovery from a challenging Q1 2025, when it missed both EPS and revenue forecasts according to previous earnings reports. The strong Q2 results suggest Lyft has successfully navigated those challenges and regained momentum.
The company’s focus on partnerships, market expansion, and operational efficiency appears to be yielding results, though Lyft continues to face intense competition in the ride-sharing market and potential regulatory challenges, particularly as it expands internationally. The coming quarters will be crucial in determining whether Lyft can maintain this growth trajectory and continue improving its profitability metrics in line with investor expectations.
Full presentation:
This article was generated with the support of AI and reviewed by an editor. For more information see our T&C.