Gold scales new record high; nears $4,200/oz on Fed easing bets, trade tensions

Introduction & Market Context
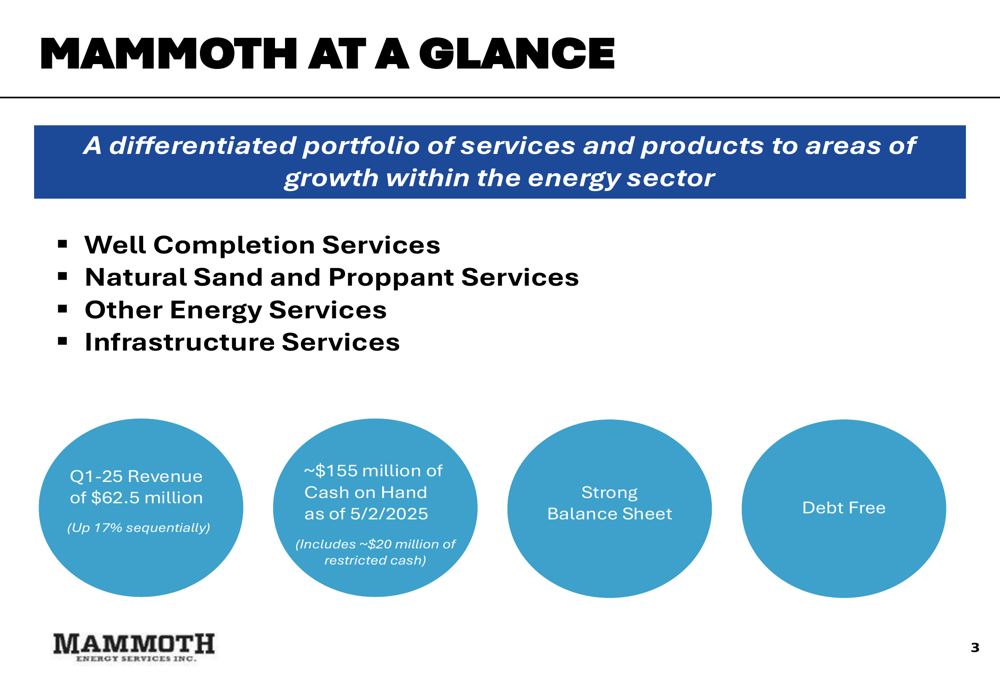
Mammoth Energy Services Inc (NASDAQ:TUSK) released its Q1 2025 investor presentation highlighting sequential improvement in financial performance and emphasizing its strong balance sheet position. The company, which provides services across well completion, infrastructure, and sand proppant segments, has been working to recover from challenging market conditions experienced in 2024.
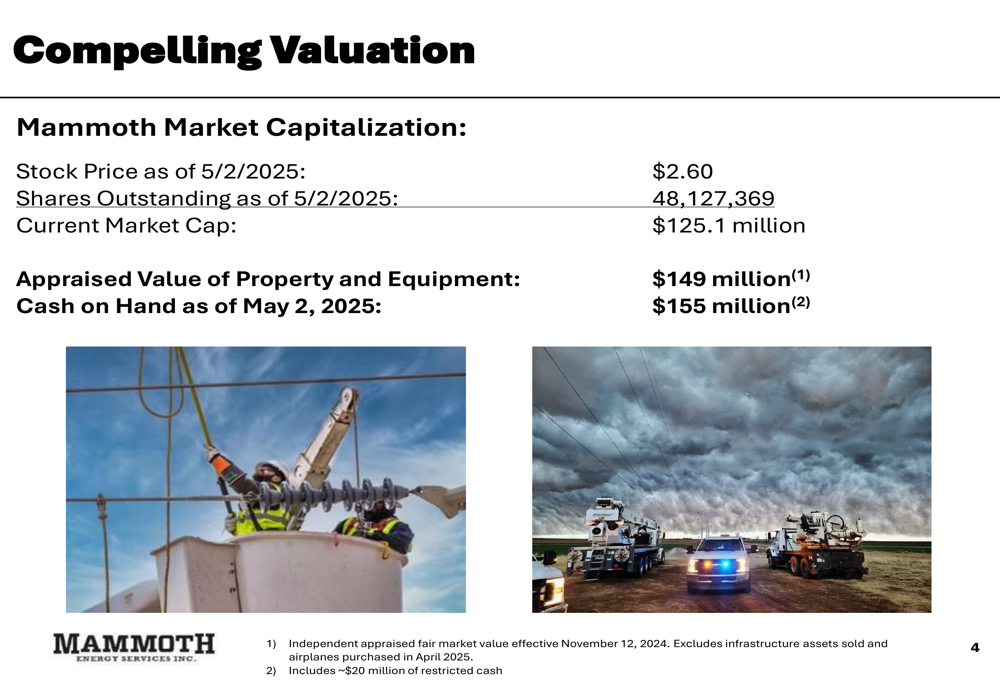
Trading at $2.66 as of May 6, 2025, Mammoth’s stock remains near its 52-week range of $1.68-$4.94, with a market capitalization of approximately $125.1 million. This valuation sits below both the company’s reported cash position and the appraised value of its property and equipment, creating what management describes as a compelling investment case.
Quarterly Performance Highlights
Mammoth Energy reported Q1 2025 revenue of $62.5 million, representing a 17% sequential increase from Q4 2024. More significantly, Adjusted EBITDA improved by 157% sequentially to $2.74 million, while net loss narrowed dramatically by 97% to just $537,000 compared to a $15.47 million loss in the previous quarter.
The company’s revenue stream is diversified across multiple segments, with Well Completions contributing nearly half of total revenue.
As shown in the following revenue breakdown chart:
Well Completions services generated 49.2% of Q1 revenue ($30.7 million), followed by Infrastructure at 33.5% ($20.9 million), Sand at 9.4% ($5.9 million), and Other services at 10.8% ($6.7 million). This represents a more balanced revenue mix compared to previous quarters.
Segment Analysis
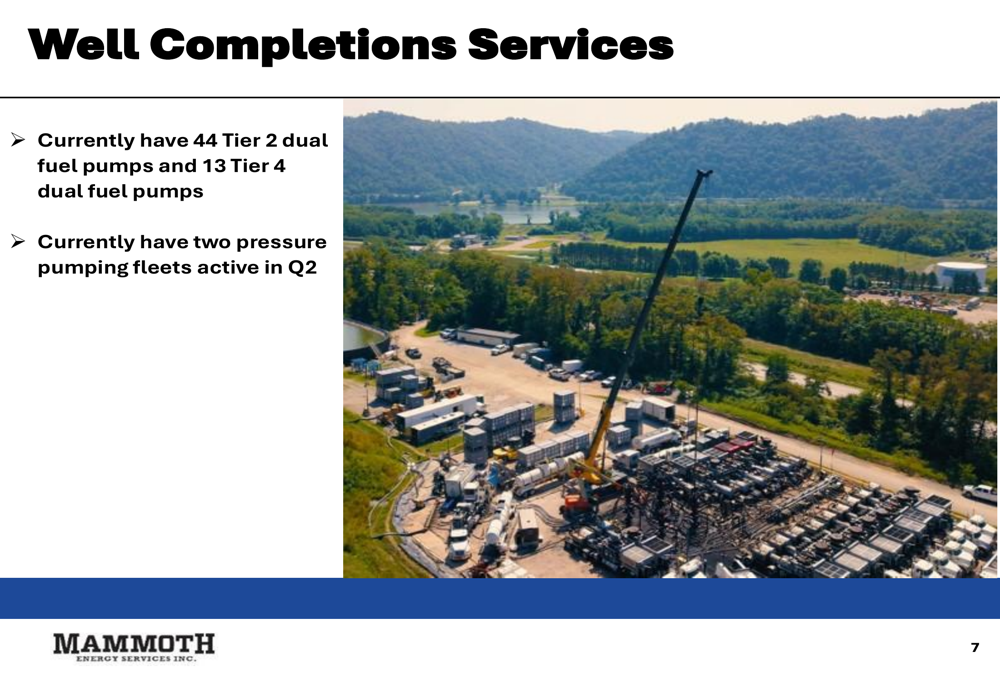
The Well Completions segment, Mammoth’s largest revenue contributor, showed significant improvement with Adjusted EBITDA of $1.15 million in Q1 2025, compared to a negative $1.98 million in Q4 2024. The company currently operates two pressure pumping fleets and maintains a fleet of 57 dual fuel pumps (44 Tier 2 and 13 Tier 4).
The following image shows Mammoth’s well completion operations:

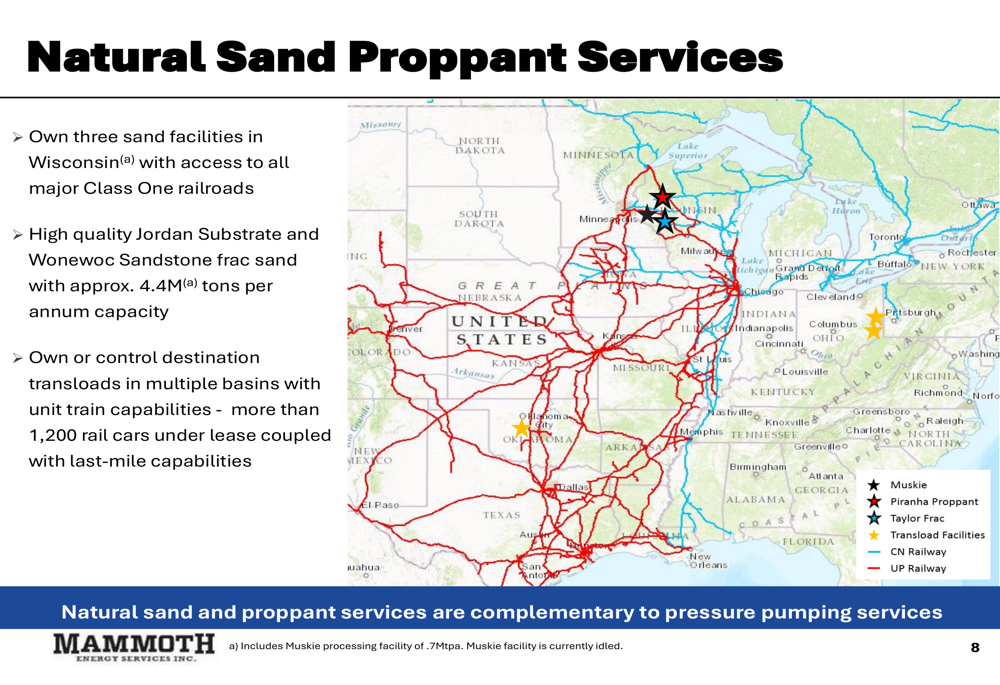
In the Natural Sand Proppant segment, sales volumes increased substantially to 189,000 tons in Q1 2025, up from 129,000 tons in Q4 2024. The segment generated positive Adjusted EBITDA of $398,000, compared to a loss of $306,000 in the previous quarter.
The company’s sand operations are strategically positioned with facilities in Wisconsin and transload capabilities across multiple basins:
Detailed performance metrics for the sand segment show an average sales price of $21.49 per ton across Mammoth’s three facilities:
The Infrastructure Services segment delivered $1.56 million in Adjusted EBITDA for Q1 2025, a significant improvement from the negative $1.34 million reported in Q4 2024. This segment focuses on engineering services for power transmission and distribution, as well as telecom and fiber line installation.
Balance Sheet Strength
Mammoth Energy emphasized its strong financial position, reporting approximately $155 million in cash as of May 2, 2025 (including about $20 million in restricted cash). The company remains debt-free, providing significant financial flexibility for future growth initiatives.
The presentation highlighted what management considers a valuation disconnect in the market:
With a market capitalization of $125.1 million based on the May 2, 2025 stock price of $2.60, Mammoth trades below both its cash position ($155 million) and the independently appraised value of its property and equipment ($149 million, excluding recently sold infrastructure assets and purchased airplanes).
Strategic Initiatives & Outlook
Mammoth outlined a measured approach to capital deployment with a 2025 capital expenditure budget of $12 million. This includes growth investments for the equipment rentals business and maintenance capital for pressure pumping operations.
The CapEx allocation is visualized in the following chart:

The company expects to receive a final $20 million installment from its $188.4 million settlement agreement with Puerto Rico Electric Power Authority (PREPA), which will further strengthen its balance sheet and support growth initiatives.
Management indicated they are evaluating strategic acquisition opportunities while maintaining a disciplined approach to capital allocation. The company is also taking a measured approach to dual fuel pump upgrades to ensure cost-effectiveness.
CEO Phil Lancaster, who assumed the role in January 2025, brings significant industry experience from previous leadership positions at Mammoth Energy Partners, Redback Energy Services, and Great White Energy Services. CFO Mark Layton has served in his role since 2016, providing continuity in financial leadership.
Looking ahead, Mammoth’s investment thesis centers on its solid foundation for future growth, strong balance sheet, and ability to deploy capital strategically for acquisitions and organic growth opportunities.
Full presentation:
This article was generated with the support of AI and reviewed by an editor. For more information see our T&C.