Is this U.S.-China selloff a buy? A top Wall Street voice weighs in

Introduction & Market Context
Morgan Stanley (NYSE:MS) released its second quarter 2025 earnings presentation on July 16, showing year-over-year revenue growth of 12% despite a sequential decline from the previous quarter. The financial services giant reported net revenues of $16.79 billion for Q2 2025, compared to $15.02 billion in the same period last year, but down 5% from $17.74 billion in Q1 2025.
The company’s stock was trading down 0.45% in pre-market at $140.95, following a 1.65% decline the previous day, suggesting investors may be responding cautiously to the mixed results.
Quarterly Performance Highlights
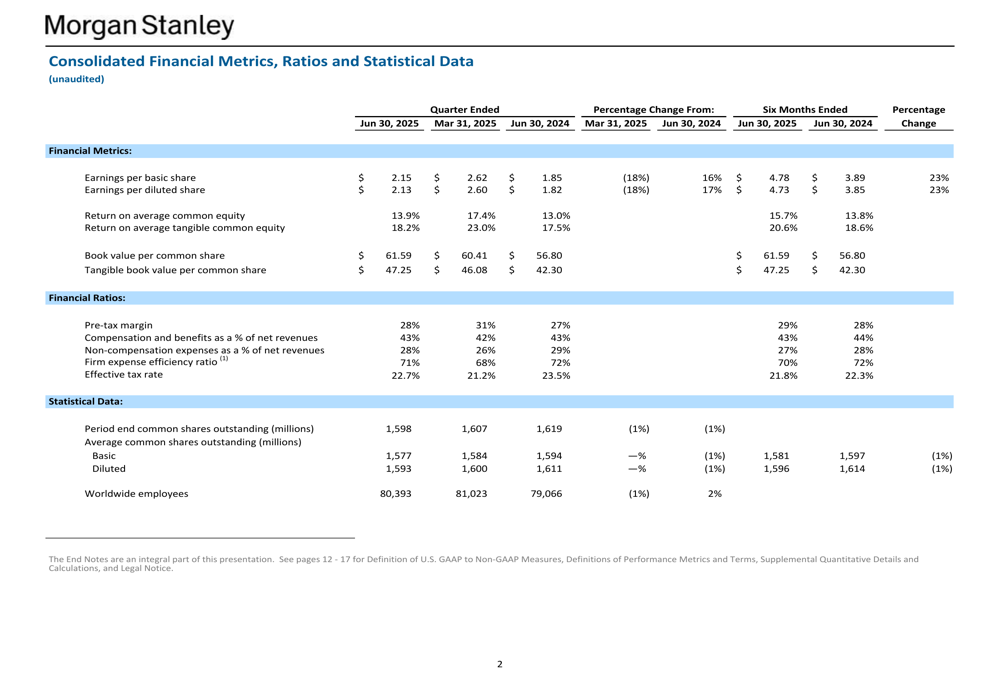
Morgan Stanley reported net income applicable to shareholders of $3.54 billion for the second quarter of 2025, with earnings applicable to common shareholders at $3.39 billion. This performance comes after a strong first quarter where the company exceeded analyst expectations with an EPS of $2.60.
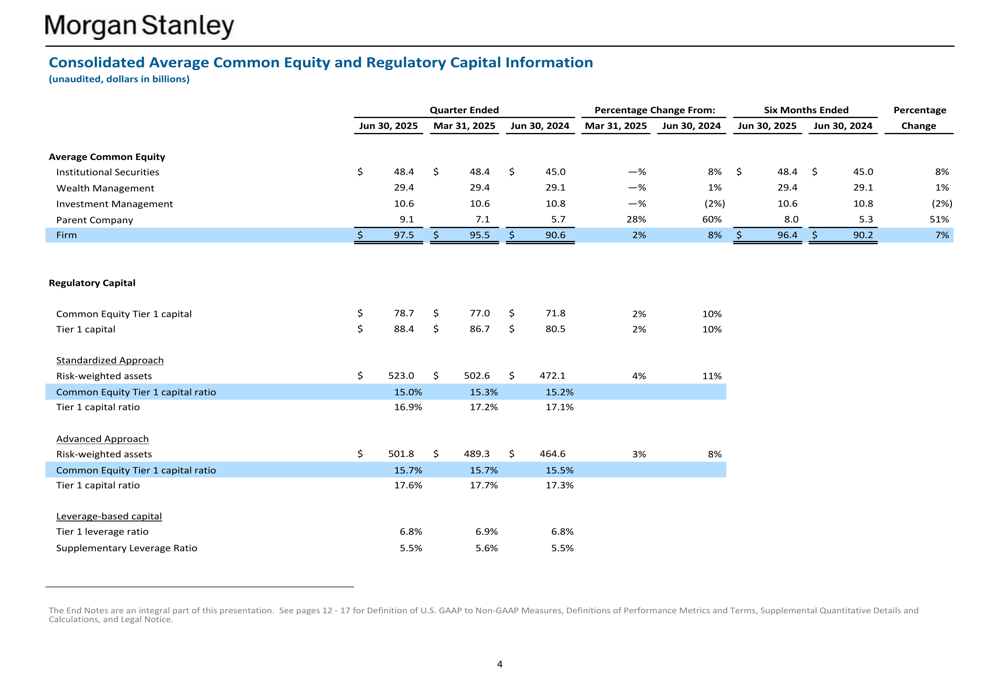
The firm maintained solid capital and liquidity positions, with a Common Equity Tier 1 capital ratio of 15.0% under the Standardized Approach and 15.7% under the Advanced Approach, both well above regulatory requirements.
As shown in the following comprehensive financial summary:
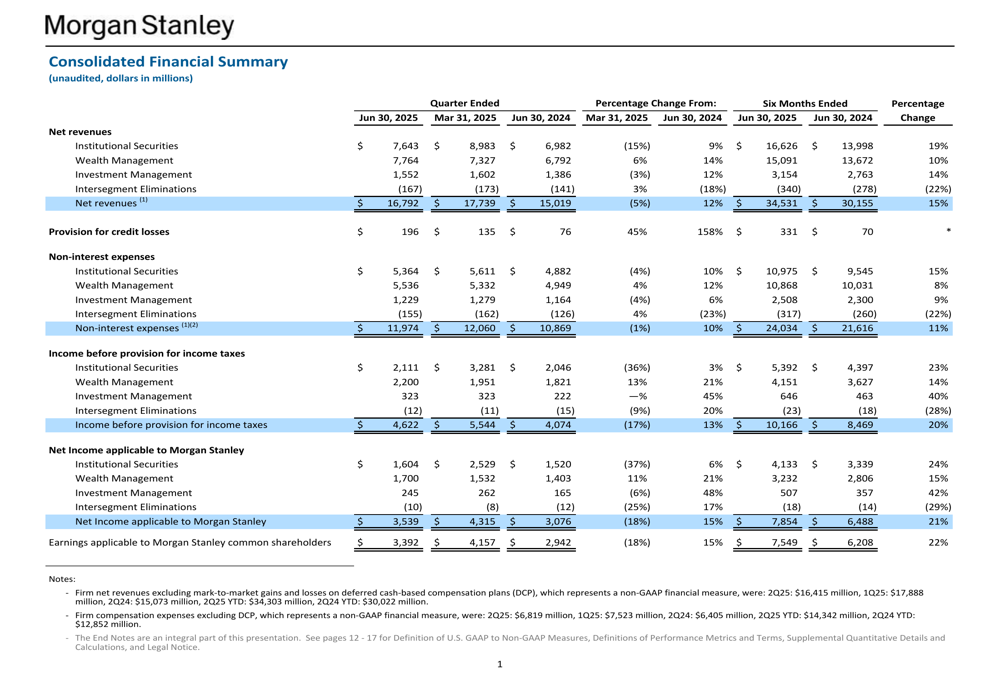
A notable concern in the quarterly results was the increase in provision for credit losses, which rose to $196 million in Q2 2025, up from $135 million in the previous quarter and significantly higher than the $76 million reported in Q2 2024. This 158% year-over-year increase may signal growing caution about potential credit deterioration in an uncertain economic environment.
Detailed Financial Analysis
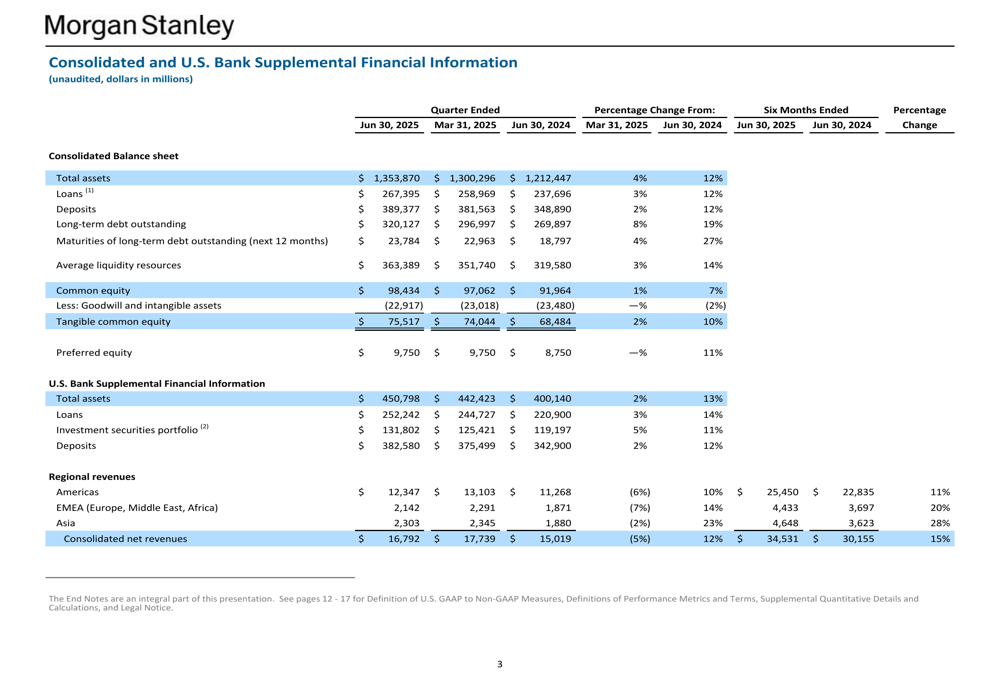
Morgan Stanley’s balance sheet remains robust, with total assets of $1.35 trillion as of June 30, 2025. The firm reported $267.4 billion in loans and $389.4 billion in deposits, maintaining a strong liquidity position.
The following supplemental financial information provides a detailed view of the firm’s balance sheet and regional revenue distribution:
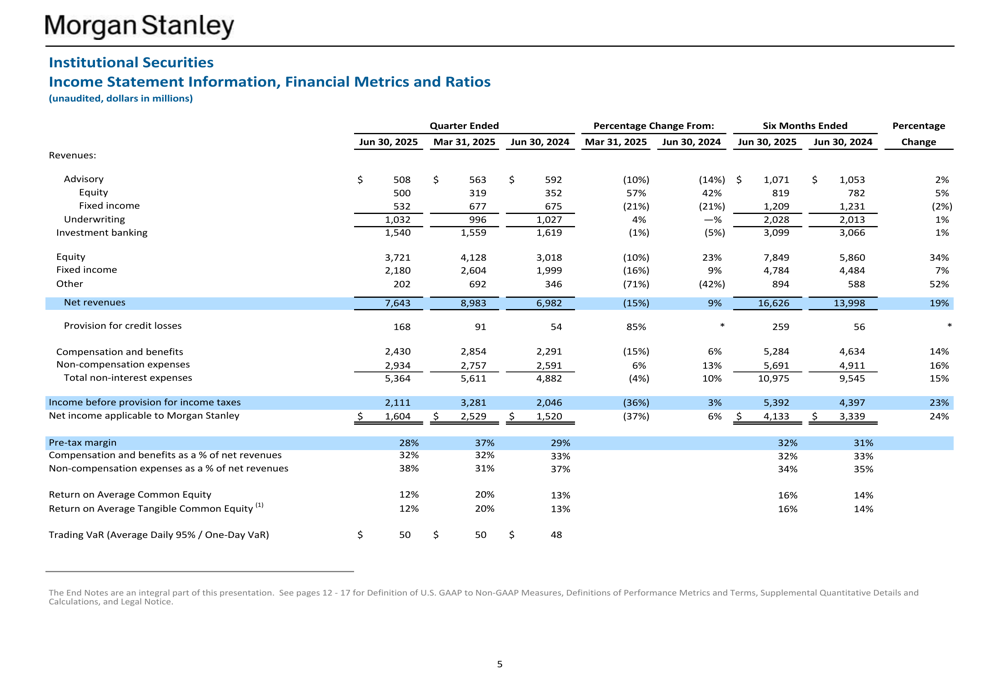
By business segment, Institutional Securities generated $7.64 billion in net revenues, with investment banking contributing $1.54 billion. The segment reported income before provision for income taxes of $2.11 billion and a pre-tax margin of 28%.
The detailed breakdown of Institutional Securities performance shows:
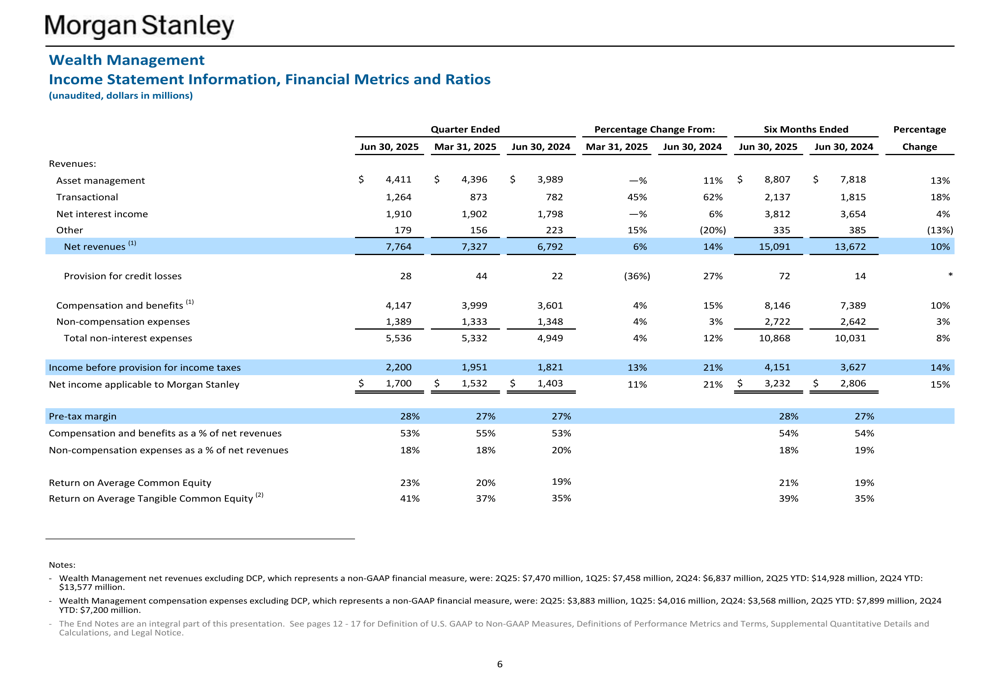
Wealth Management continued to be a key driver of Morgan Stanley’s performance, generating $7.76 billion in net revenues. Asset management revenues accounted for $4.41 billion, while net interest income contributed $1.91 billion. The segment achieved income before provision for income taxes of $2.20 billion, also with a pre-tax margin of 28%.
The following income statement information highlights the Wealth Management segment’s performance:
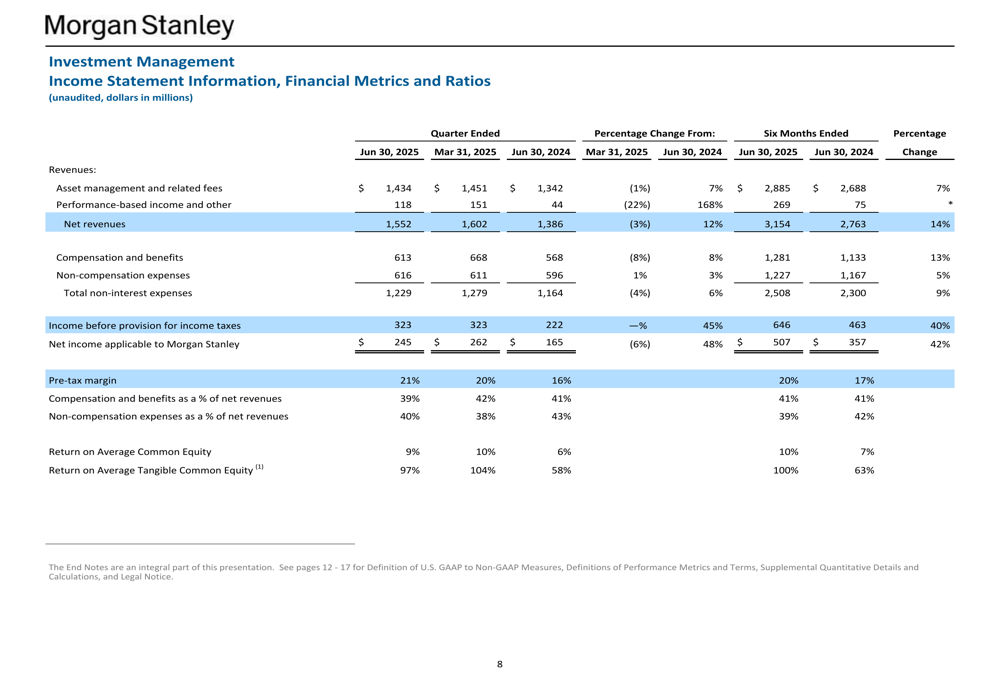
Investment Management reported net revenues of $1.55 billion, with asset management and related fees of $1.43 billion. The segment achieved income before provision for income taxes of $323 million and a pre-tax margin of 21%.
Strategic Initiatives
Wealth Management remains a strategic focus for Morgan Stanley, with total client assets reaching $6.49 trillion as of June 30, 2025. The segment attracted $59.2 billion in net new assets during the quarter, demonstrating strong client acquisition and retention capabilities.
The breakdown of Wealth Management assets shows $5.04 trillion in advisor-led client assets and $1.45 trillion in self-directed assets, highlighting the firm’s multi-channel approach to serving clients.
As illustrated in the following Wealth Management statistical data:
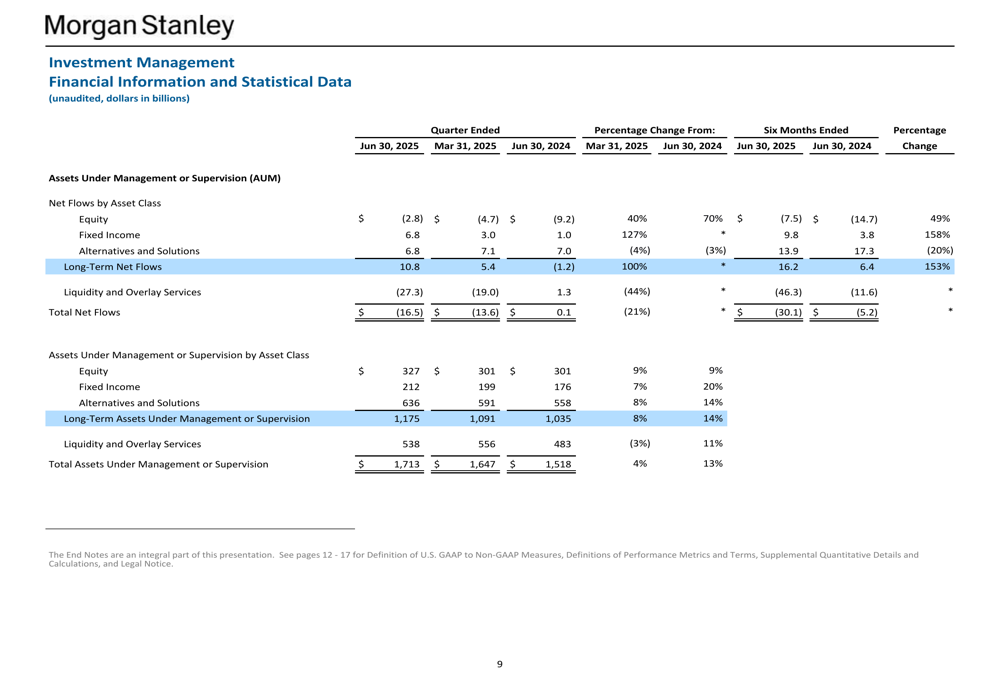
The Investment Management business reported total assets under management or supervision of $1.71 trillion. While equity funds saw outflows of $2.8 billion, both fixed income and alternatives & solutions categories attracted inflows of $6.8 billion each, resulting in net positive flows for the quarter.
The following chart details the Investment Management segment’s assets and flows:
Forward-Looking Statements
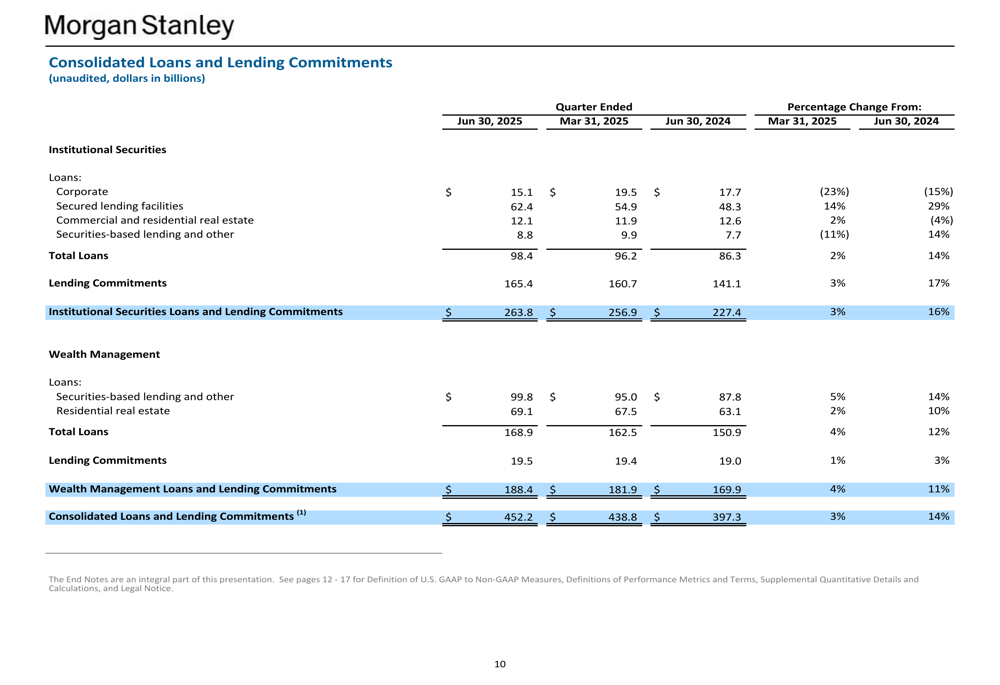
A potential area of concern is the increasing provision for credit losses, which has been trending upward over the past year. The firm’s consolidated loans and lending commitments show significant exposure across corporate, secured lending facilities, and real estate sectors.
The loan portfolio breakdown is illustrated in the following chart:
The allowance for credit losses (ACL) for Institutional Securities stands at $865 million, representing 1.1% of loans and lending commitments held for investment. For Wealth Management, the ACL is $406 million, or 0.2% of the portfolio, reflecting the generally higher quality and collateralization of these loans.
The detailed allowance for credit losses is shown here:
While Morgan Stanley maintains strong capital ratios, the increasing provisions for credit losses may indicate management’s growing caution about potential economic headwinds. This aligns with CEO Ted Pick’s cautious optimism expressed in the previous quarter’s earnings call, where he noted "Pause, not delete" in reference to strategic initiatives.
Competitive Industry Position
Morgan Stanley continues to maintain a strong competitive position in the financial services industry, with diversified revenue streams across Institutional Securities, Wealth Management, and Investment Management. The firm’s focus on wealth management has proven successful, with substantial client assets and continued net inflows.
The company’s regulatory capital position remains strong, with ratios exceeding requirements and providing flexibility for potential market volatility. The following capital information illustrates this strength:
As economic uncertainties persist, Morgan Stanley’s balanced business model positions it well to navigate potential challenges while capitalizing on growth opportunities, particularly in wealth and investment management services where client engagement remains robust.
Full presentation:
This article was generated with the support of AI and reviewed by an editor. For more information see our T&C.