Novo Nordisk, Eli Lilly slide after Trump comments on weight loss drug pricing

Introduction & Market Context
National Health Investors (NYSE:NHI) released its Q2 2025 investor presentation on August 6, highlighting strong quarterly performance driven by its Senior Housing (NASDAQ:DHC) Operating Portfolio (SHOP) and an optimistic outlook supported by favorable industry dynamics. The healthcare REIT, which closed at $72.72 on August 6 (down 0.78% for the day), continues to benefit from improving senior housing fundamentals and strategic portfolio optimization.
The company’s presentation comes after a solid Q1 2025 where NHI beat EPS expectations but missed revenue forecasts. The latest quarterly results demonstrate continued momentum in the company’s strategic initiatives, particularly in its SHOP segment, which has become a key growth driver.
Quarterly Performance Highlights
NHI reported Q2 2025 net income per diluted share of $0.79, representing an improvement from $0.74 in Q1 2025. Normalized FFO per share reached $1.22, up from $1.15 in the previous quarter, while NAREIT FFO per diluted share increased to $1.19 from $1.14.
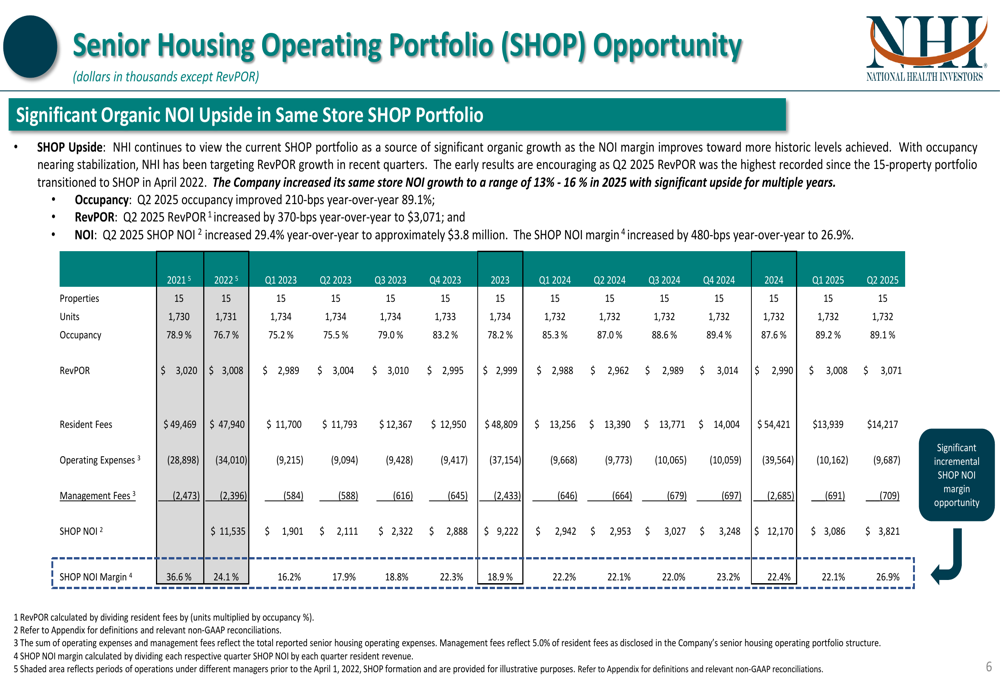
The standout performer was the company’s SHOP portfolio, which delivered NOI of $3.8 million, representing a 29.4% year-over-year increase and a 23.8% sequential improvement. SHOP NOI margin expanded to 26.9%, up 480 basis points year-over-year.
As shown in the following quarterly financial summary:
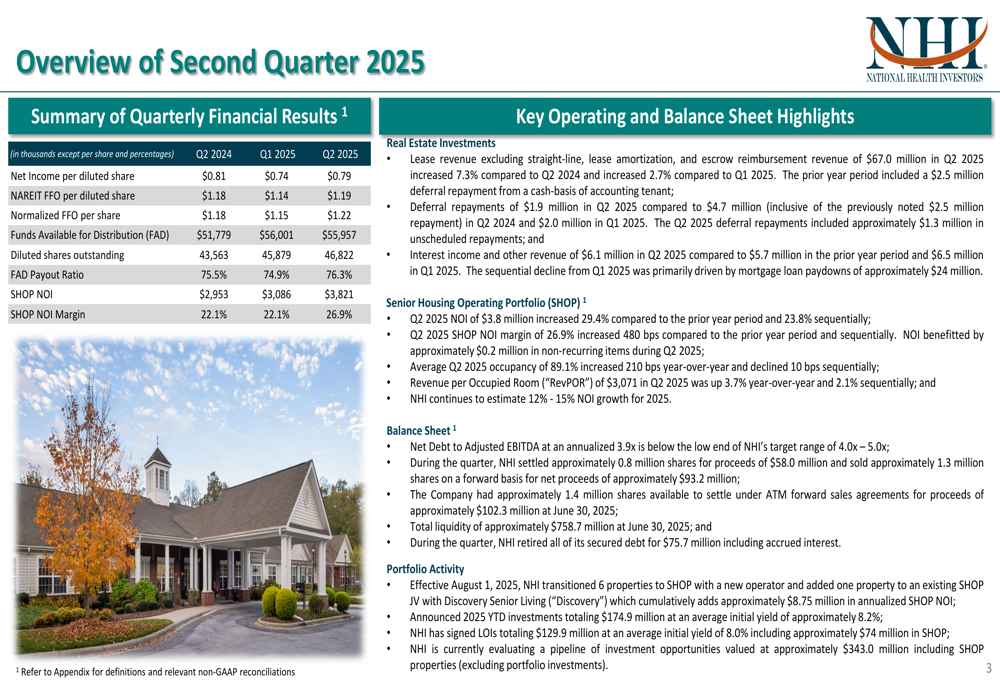
Lease revenue (excluding straight-line, lease amortization, and escrow reimbursement revenue) reached $67.0 million in Q2 2025, up 7.3% year-over-year and 2.7% sequentially. The company also collected $1.9 million in deferral repayments during the quarter, continuing the recovery of pandemic-related rent concessions.
Occupancy in the SHOP portfolio averaged 89.1% in Q2, representing a 210 basis point improvement year-over-year, while Revenue Per Occupied Room (RevPOR) increased 3.7% year-over-year to $3,071.
Strategic Initiatives & SHOP Portfolio Growth
NHI’s strategic focus on expanding its SHOP portfolio is yielding significant results. The company views this segment as a source of substantial organic growth, as illustrated in the following SHOP opportunity overview:
Effective August 1, 2025, NHI transitioned six properties formerly leased to Discovery (NASDAQ:WBD) to a SHOP portfolio managed by Sinceri Senior Living. Additionally, the company expanded its SHOP joint venture with Discovery by adding one property in Tulsa, OK. These SHOP conversions are expected to contribute $3.6-$3.7 million to 2025 SHOP NOI, or $8.6-$8.9 million on an annualized basis, with a strong double-digit growth profile anticipated in 2026.
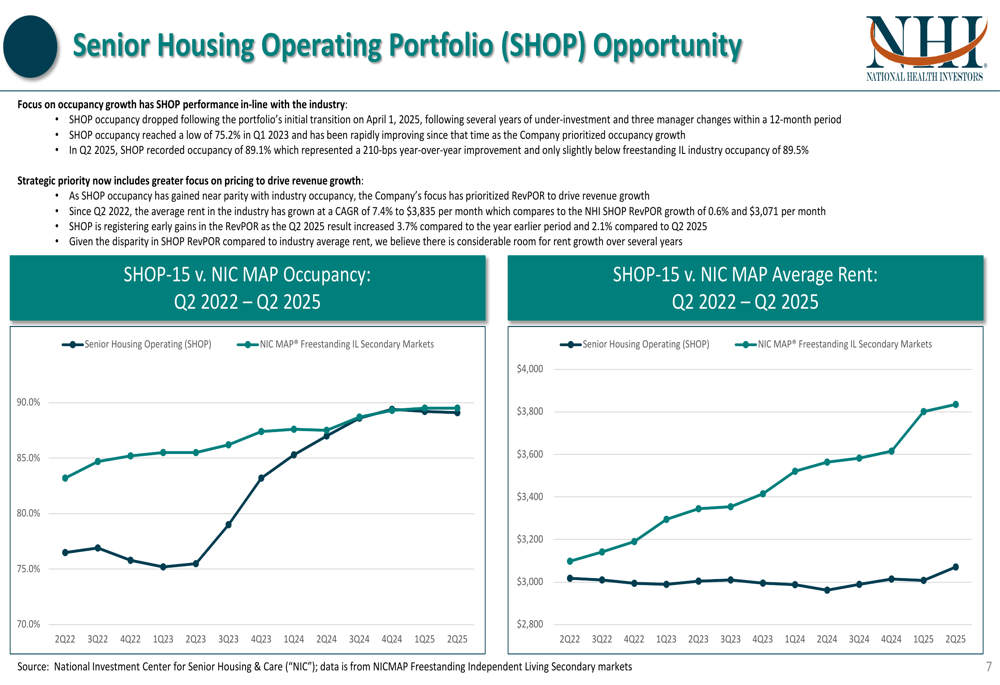
The company’s SHOP strategy has evolved from focusing primarily on occupancy growth to emphasizing pricing power. As shown in the following comparison with industry benchmarks, NHI’s SHOP occupancy has now reached parity with industry averages, allowing the company to shift focus toward RevPOR growth:
Investment Strategy & Pipeline
NHI outlined its comprehensive investment strategy, centered around four key areas: SHOP platform growth, active management for organic growth, financial strength enabling external growth, and favorable industry dynamics supporting long-term growth.
The following overview illustrates these strategic priorities:
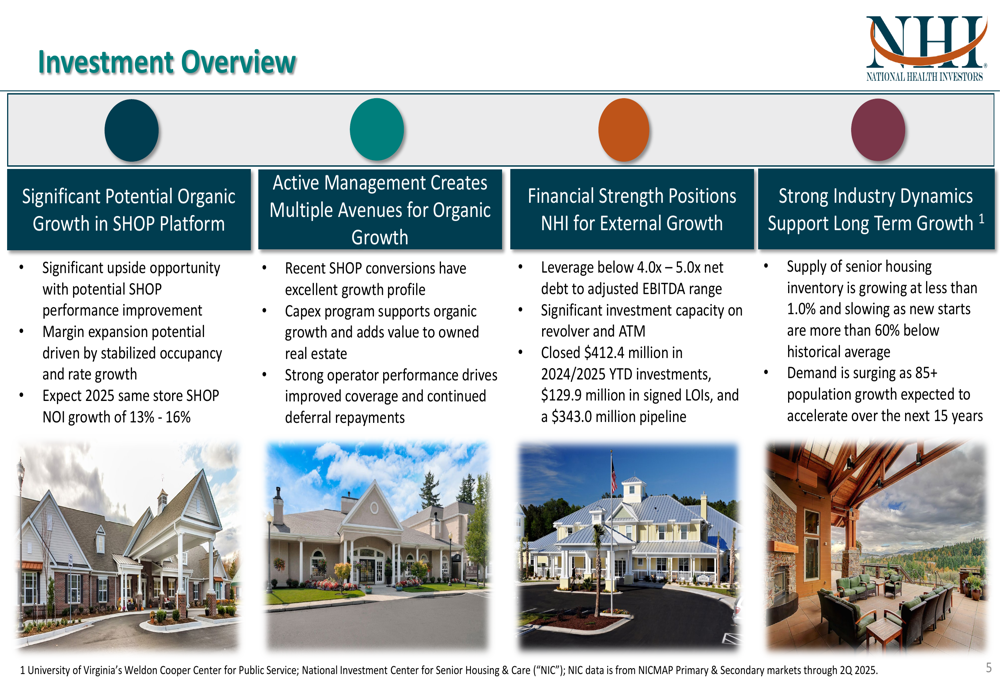
The company has closed $174.9 million in investments year-to-date at an average initial yield of 8.2%. Additionally, NHI has signed letters of intent for $129.9 million in investments at an average yield of 8.0%, including approximately $74 million in SHOP properties. The company is also evaluating a pipeline of investment opportunities valued at approximately $343 million.
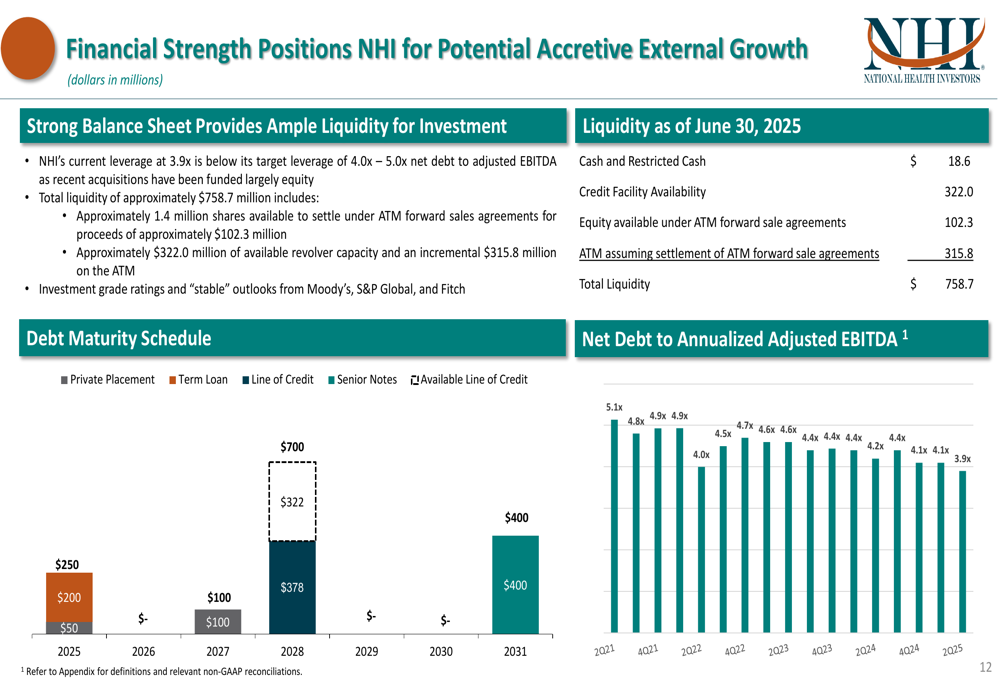
NHI’s strong balance sheet and liquidity position provide substantial capacity for these growth initiatives. As of June 30, 2025, the company had total liquidity of approximately $758.7 million and maintained a net debt to adjusted EBITDA ratio of 3.9x, below its target range of 4.0x-5.0x.
The following slide details the company’s financial strength and liquidity position:
Updated 2025 Guidance
Based on strong performance and continued execution of strategic initiatives, NHI has updated its full-year 2025 guidance. While net income attributable to common stockholders was revised downward from $144.9 million to $134.0 million, normalized FFO was increased from $221.3 million to $225.6 million, and normalized FFO per diluted share was raised from $4.71 to $4.80.
The updated guidance reflects the company’s confidence in its SHOP portfolio, with same-store SHOP NOI annual growth projected in the range of 13%-16%. The guidance also incorporates $105 million in unidentified new investments at an initial average yield of 8.1%.
As shown in the following guidance comparison:
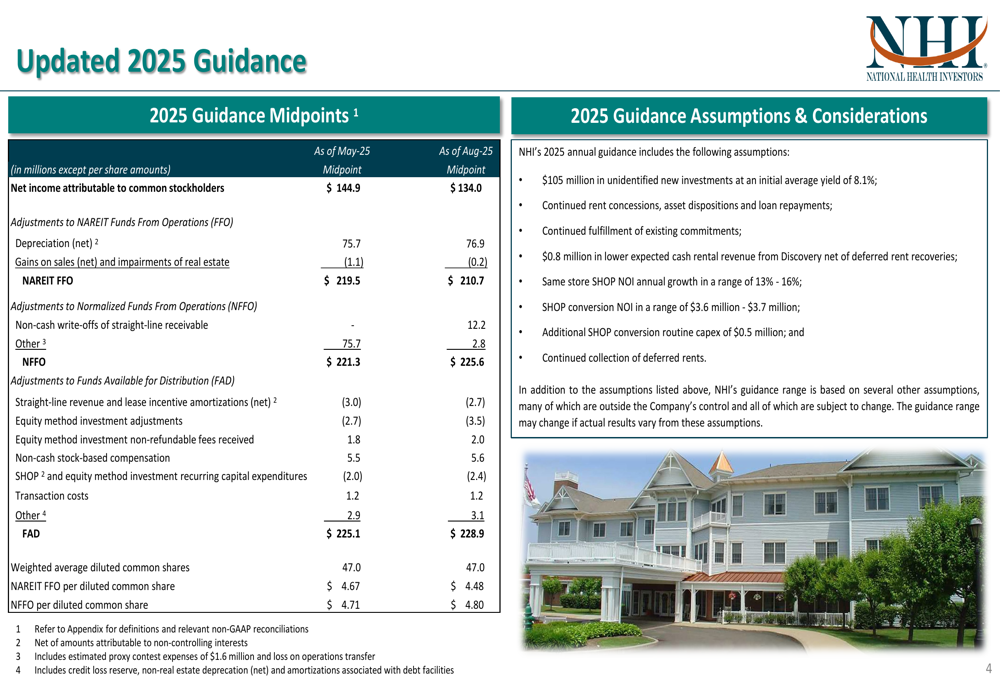
This updated outlook builds on the positive momentum reported after Q1 2025, when the company initially raised its full-year normalized FFO guidance midpoint to $4.71 per share. The further increase to $4.80 reflects continued operational improvements and successful execution of strategic initiatives.
Industry Outlook & Positioning
NHI’s presentation highlighted exceptionally favorable industry dynamics that support its long-term growth strategy. New supply of senior housing is at historic lows, with inventory growth across the care continuum below 1%. New construction starts in Q2 2025 were the lowest ever recorded and 64% below the historical average.
The following chart illustrates the significant slowdown in supply growth:
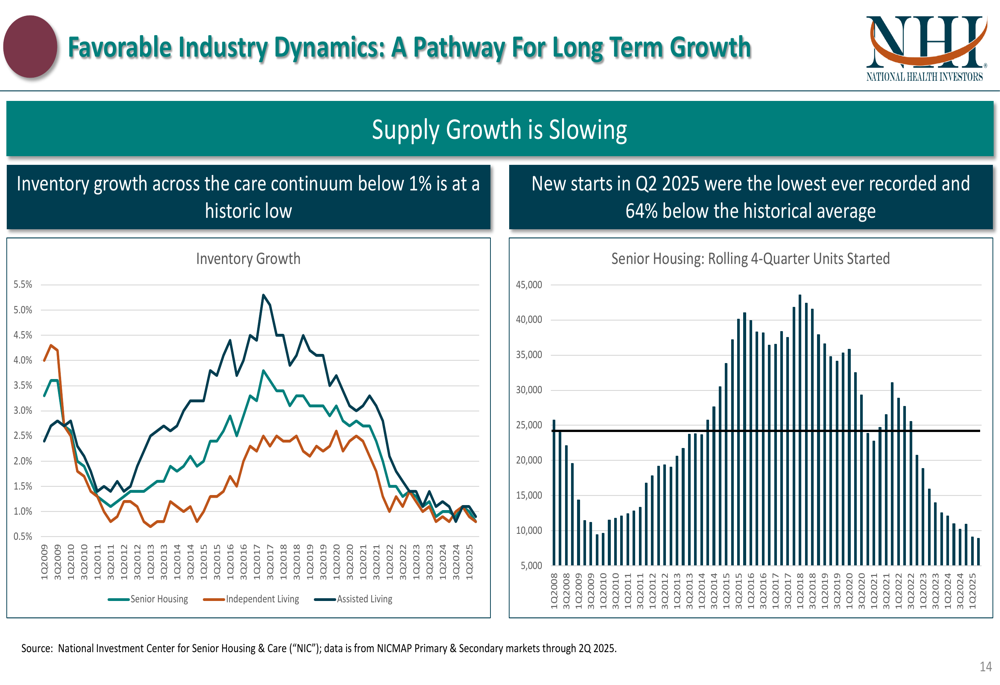
Simultaneously, demand is accelerating due to demographic trends. The 85+ population growth is expected to accelerate to 1.9% by 2030 and 3.5% in the following decade, creating substantial tailwinds for senior housing operators.
These favorable supply-demand dynamics have contributed to NHI’s improving return on invested capital (ROIC), which reached 8.25% in Q2 2025, exceeding the company’s weighted average cost of capital. This improvement reflects the success of NHI’s portfolio optimization efforts, which included the disposition of 48 underperforming senior housing properties since 2021.
Financial Strength & Balance Sheet
NHI maintained a strong financial position at the end of Q2 2025, with a net debt to adjusted EBITDA ratio of 3.9x, below its target range of 4.0x-5.0x. The company’s total liquidity of approximately $758.7 million provides substantial capacity for continued investment and growth.
The company’s investment grade ratings and "stable" outlooks from Moody’s, S&P Global, and Fitch further underscore its financial strength. This solid foundation enables NHI to pursue its growth strategy while maintaining financial discipline.
During the quarter, NHI settled approximately 0.8 million shares for proceeds of $58.0 million and sold approximately 1.3 million shares on a forward basis for net proceeds of approximately $93.2 million, further enhancing its liquidity position.
The company’s strong balance sheet and disciplined capital allocation approach position it well to capitalize on the favorable industry dynamics and continue its growth trajectory in the coming quarters.
Full presentation:
This article was generated with the support of AI and reviewed by an editor. For more information see our T&C.