Gold rally takes a breather amid Gaza ceasefire, Fed minutes

Niagen Bioscience Inc (NASDAQ:NAGE) reported strong second-quarter results on August 6, 2025, with significant revenue growth and improved profitability. The company’s stock rose 0.44% to $9.20 in aftermarket trading following the earnings release.
Quarterly Performance Highlights
Niagen Bioscience delivered total company net sales of $31.1 million in Q2 2025, representing a 37% increase compared to the same period last year. This growth was primarily driven by strong e-commerce performance and substantial growth in the company’s ingredient business.
"Delivered a strong top- and bottom-line second quarter, reflecting continued momentum in both consumer and ingredient channels, while advancing NAD+ science and maintaining a disciplined focus on profitability," the company stated in its presentation.
The company’s flagship Tru Niagen product line generated $22.7 million in net sales, up 22% year-over-year, while total Niagen ingredient sales reached $7.4 million, representing an impressive 135% increase compared to Q2 2024.
As shown in the following chart of quarterly net sales performance:
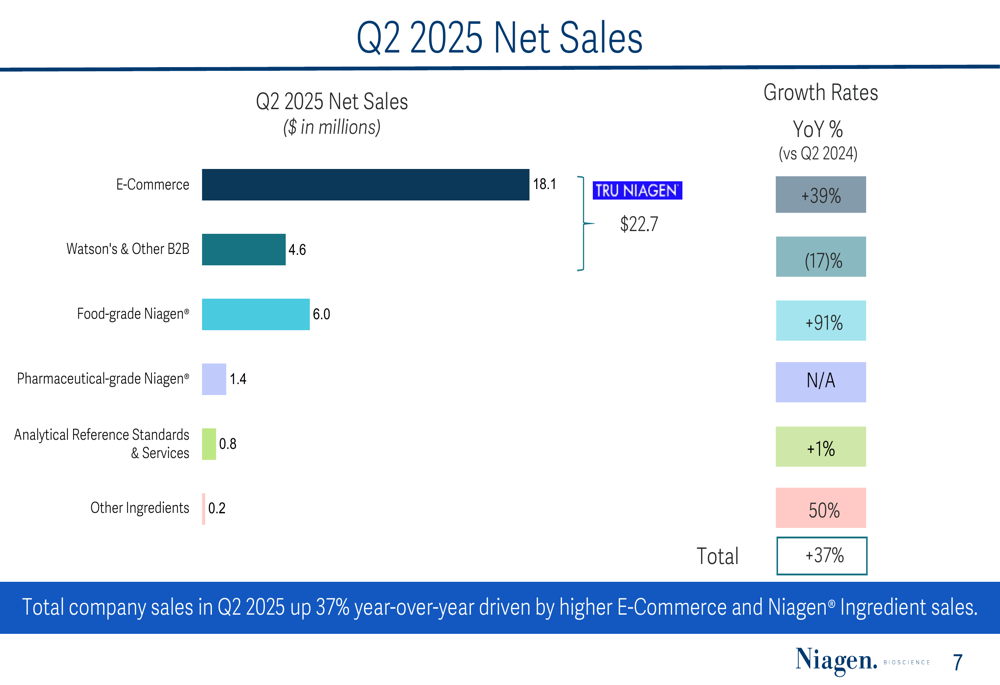
E-commerce remains Niagen’s largest sales channel, accounting for 58% of total revenue at $18.1 million, up 39% year-over-year. The company also saw significant growth in food-grade Niagen sales, which increased 91% to $6.0 million. Additionally, Niagen introduced pharmaceutical-grade Niagen as a new revenue stream, which contributed $1.4 million in Q2 2025.
The year-to-date performance shows similar strength across multiple channels:

Detailed Financial Analysis
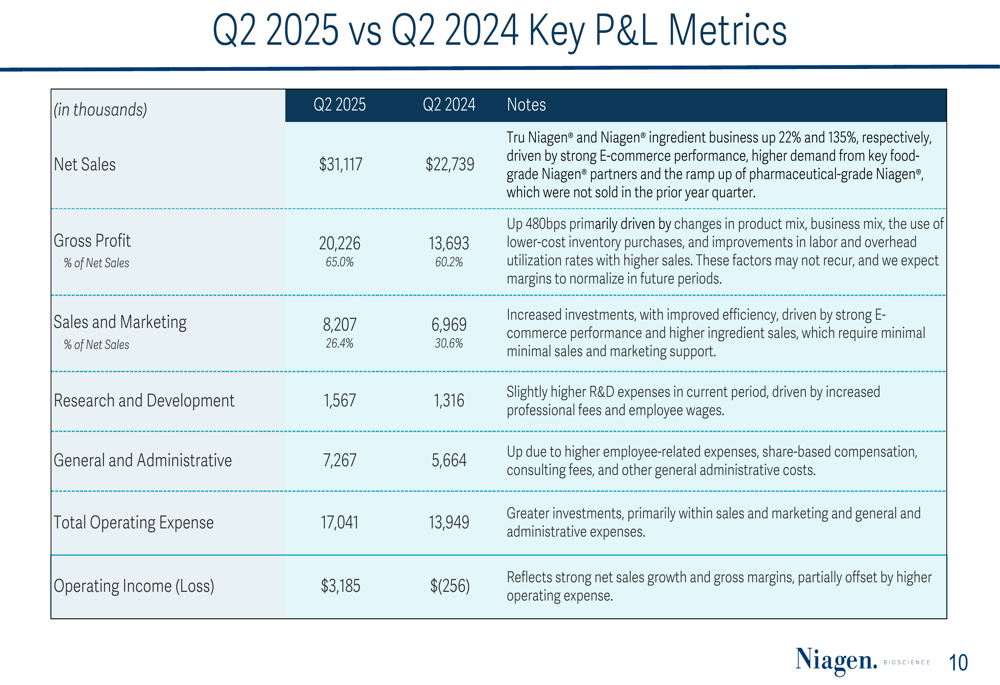
Niagen Bioscience reported substantial improvements in profitability metrics during Q2 2025. Gross margin expanded to 65.0%, up 480 basis points from 60.2% in the prior year period, primarily driven by favorable changes in product mix, business mix, and improvements in labor utilization rates.
The company achieved net income of $3.6 million or $0.05 per share, compared to breakeven results in Q2 2024. Adjusted EBITDA grew to $5.0 million, up from $1.6 million in the prior year quarter.
The following chart illustrates the key factors contributing to the improvement in operating income:
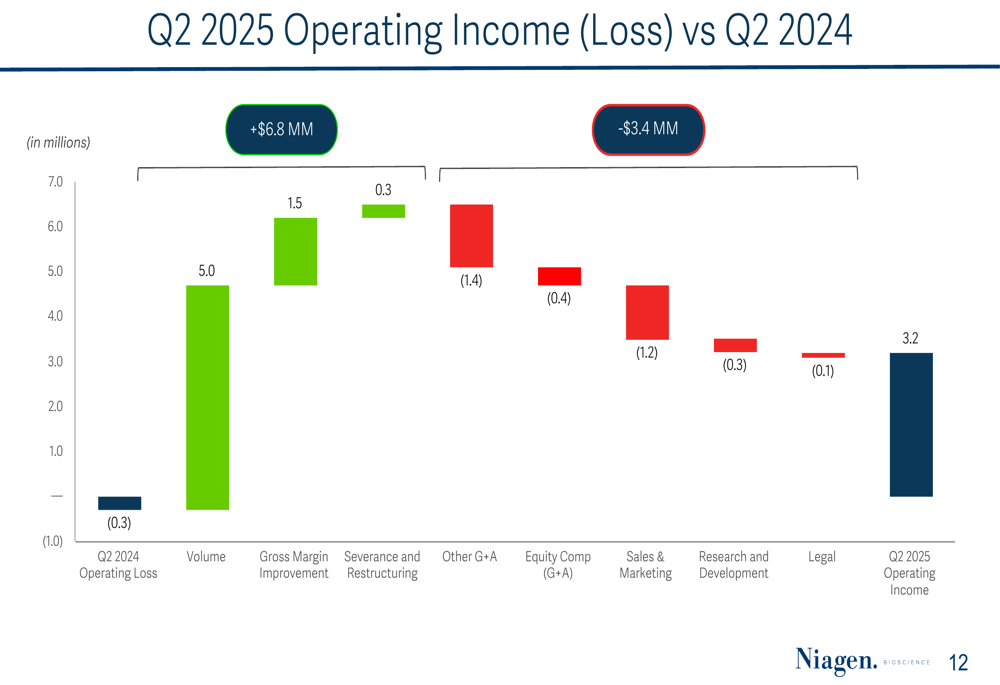
Sales and marketing expenses as a percentage of net sales improved to 26.4%, down from 30.6% in Q2 2024, reflecting the company’s focus on marketing efficiency while continuing to invest in growth. Research and development expenses increased slightly to $1.6 million, while general and administrative expenses rose to $7.3 million due to higher employee-related expenses and share-based compensation.
The comparison of key P&L metrics shows significant improvements across multiple financial indicators:
Balance Sheet and Cash Flow
Niagen Bioscience continues to strengthen its financial position, ending Q2 2025 with $60.5 million in cash and no debt, up from $44.7 million at the end of 2024. This represents an increase of $15.8 million, largely driven by improved profitability and proceeds from stock option exercises.
The company’s inventory levels increased to $14.4 million, up $5.2 million from the end of 2024, as the company scales to meet growing business needs. Trade receivables rose to $9.7 million, reflecting higher sales and the timing of customer orders and collections.
Cash provided from operations reached $9.1 million year-to-date, demonstrating the company’s ability to generate positive cash flow while investing in growth initiatives.
"Strengthened balance sheet reflects profitability, equity growth, and disciplined working capital, with strategic inventory investment to support expansion," the company noted in its presentation.
Strategic Initiatives and Market Expansion
Niagen Bioscience continues to advance its NAD+ science and expand its market presence. Recent clinical and commercial highlights include a peer-reviewed Werner syndrome clinical trial and a new in-licensing agreement for Parkinson’s disease therapy.
The company has expanded its Niagen Plus product to over 800 wellness clinics and announced the debut of Tru Niagen at Equinox Hotel New York, enhancing its premium positioning in the wellness market.
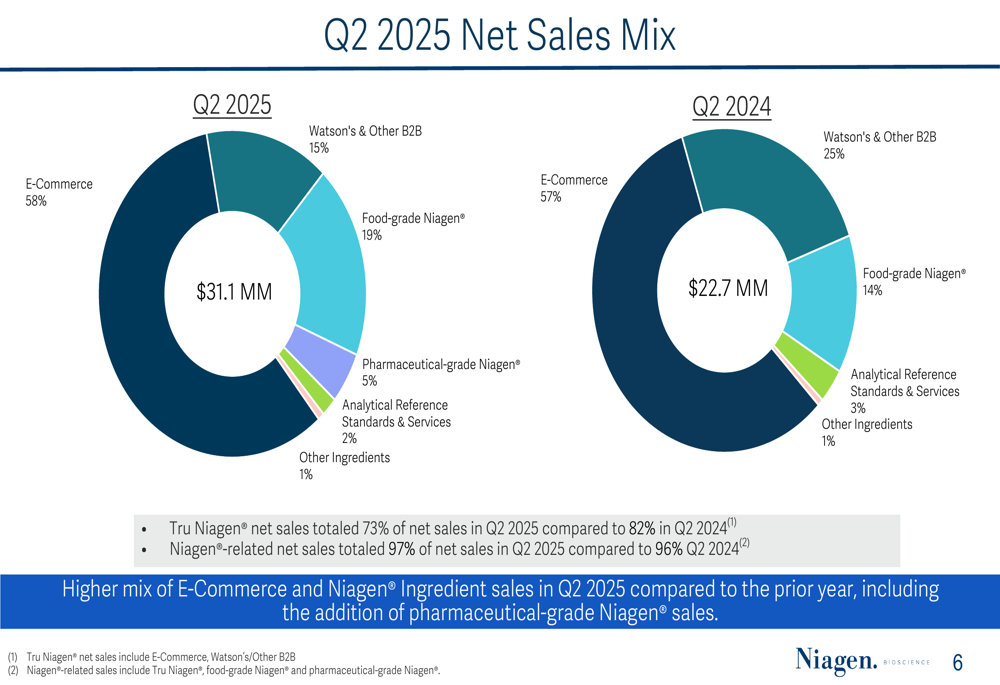
The company’s sales mix has evolved over the past year, with ingredient sales representing a larger portion of total revenue:
Forward-Looking Statements
Niagen Bioscience provided an updated outlook for 2025, projecting net sales growth between 22% and 27% year-over-year. This growth is expected to be driven by continued expansion in the e-commerce business, recurring revenues from established partnerships, and revenues from new partnerships in the expanding NAD+ market.
The company anticipates slight improvement in gross margin year-over-year, driven by favorable product and sales mix, scale effects, and continued supply chain optimization. Sales and marketing expenses are expected to increase in absolute dollars but decrease as a percentage of net sales compared to 2024.
The detailed 2025 financial outlook highlights the company’s strategic priorities:
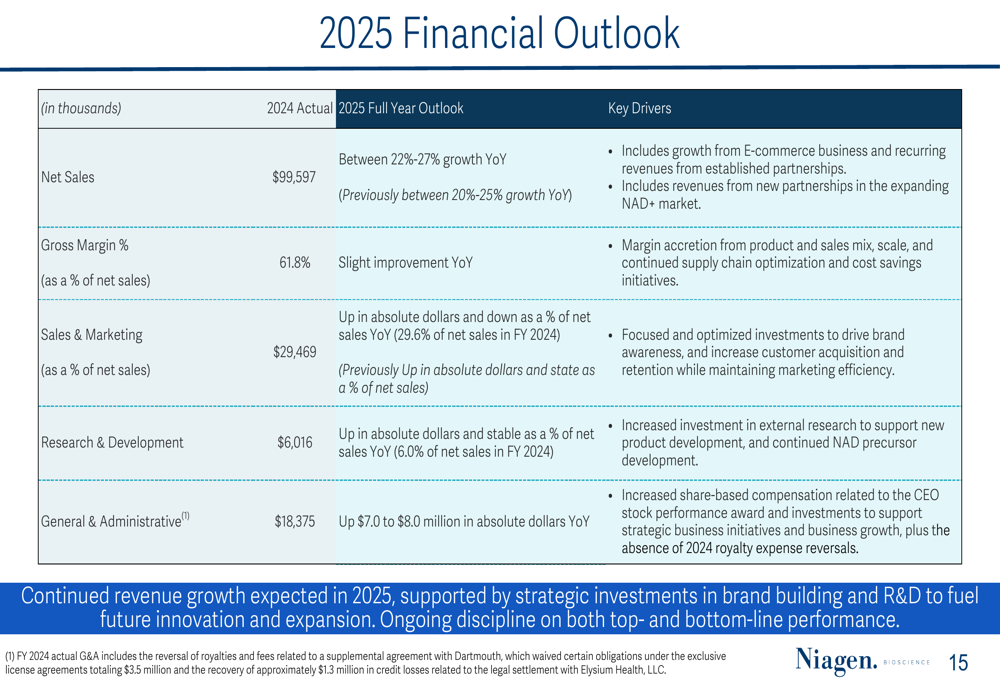
Research and development spending is projected to increase in absolute dollars while remaining stable as a percentage of net sales, as the company invests in external research to support new product development and continued NAD precursor development.
General and administrative expenses are expected to increase by $7.0 to $8.0 million year-over-year, primarily due to increased share-based compensation related to the CEO stock performance award and investments to support strategic business initiatives.
"Continued revenue growth expected in 2025, supported by strategic investments in brand building and R&D to fuel future innovation and expansion. Ongoing discipline on both top- and bottom-line performance," the company stated.
This Q2 performance continues the momentum seen in Q1 2025, when the company reported a 38% year-over-year increase in revenue and significant profitability improvements. With its strengthened balance sheet and expanding product portfolio, Niagen Bioscience appears well-positioned to capitalize on growing interest in NAD+ science and related health applications.
Full presentation:
This article was generated with the support of AI and reviewed by an editor. For more information see our T&C.