Novo Nordisk, Eli Lilly fall after Trump comments on weight loss drug pricing

Phillips Edison & Company (NASDAQ:PECO), a real estate investment trust specializing in grocery-anchored shopping centers, presented its Q1 2025 earnings results on April 25, 2025, highlighting continued growth and the resilience of its necessity-based retail strategy.
Quarterly Performance Highlights
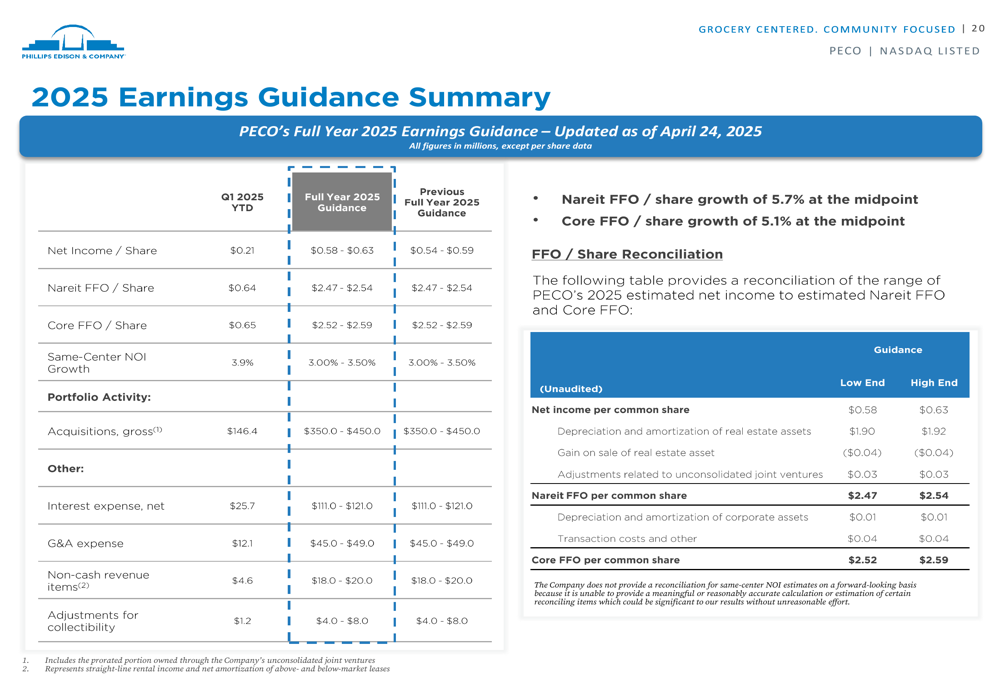
PECO reported Nareit FFO per share growth of 5.7% at the guidance midpoint for Q1 2025, with Core FFO per share growth of 5.1%. Same-center NOI increased by 3.9% during the quarter. The company maintained a strong leased portfolio occupancy of 97% and a portfolio retention rate of 91%, demonstrating the stability of its tenant base.
As shown in the following summary of PECO’s key performance metrics:
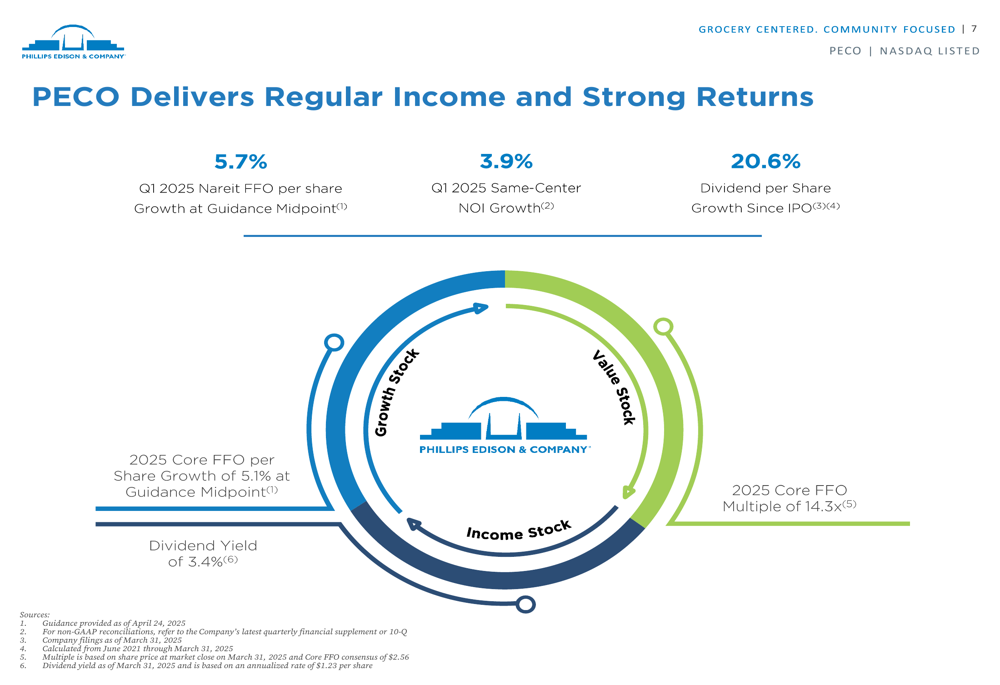
The company’s dividend yield stands at 3.4%, with dividend per share growth of 20.6% since its IPO in 2021. PECO’s 2025 Core FFO multiple is 14.3x, positioning the company as an attractive blend of growth and income.
In aftermarket trading following the presentation, PECO’s stock rose 2.21% to $36.00, recovering from a 1.59% decline during regular trading hours on April 24, when it closed at $35.79.
Strategic Positioning in Grocery-Anchored Retail
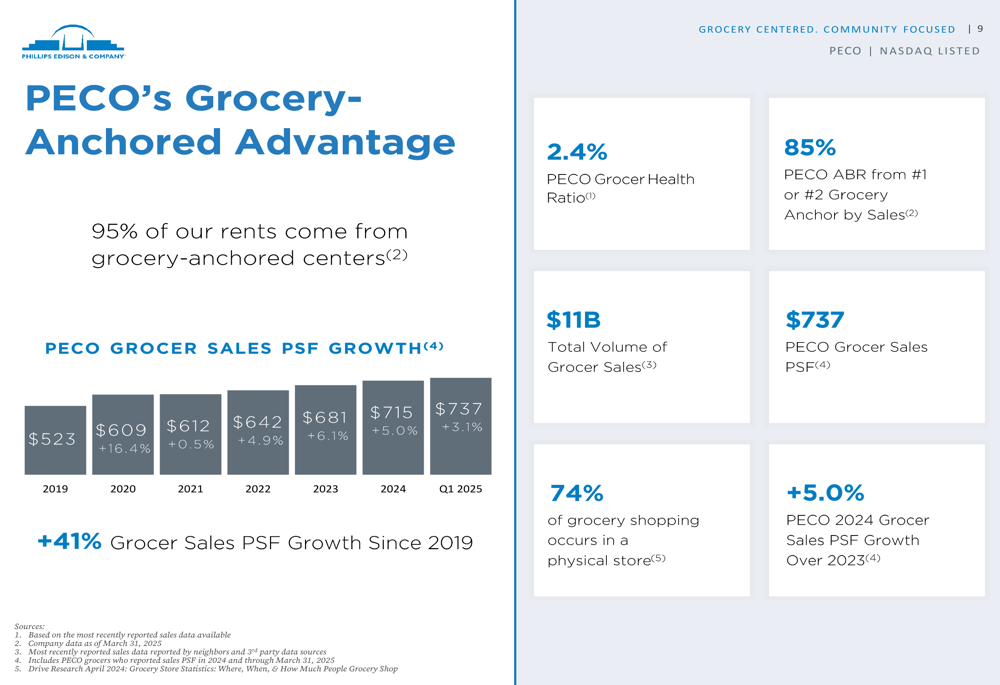
PECO’s strategy continues to focus on high-quality, grocery-anchored neighborhood shopping centers, with 95% of its annualized base rent (ABR) coming from these properties. The company emphasizes locations with the #1 or #2 grocery anchor by sales, which accounts for 85% of its ABR.
The following slide illustrates PECO’s focused strategy:
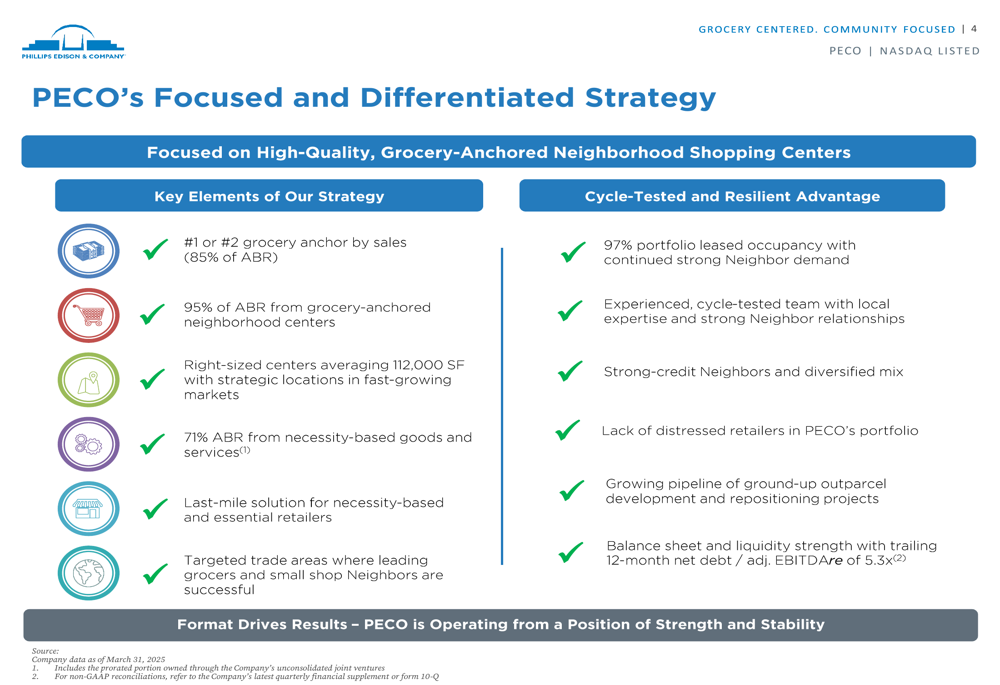
This strategic focus has proven resilient through economic cycles. PECO’s grocery-anchored centers benefit from strong foot traffic, with approximately 31,000 average total trips per week to each center and approximately 520 million total trips made to PECO centers in the last 12 months.
The company’s grocery partners continue to show strong performance, with grocer sales per square foot reaching $737, representing 41% growth since 2019 and 5.0% growth in 2024 over 2023. This robust performance underscores the continued relevance of physical grocery stores, which account for 74% of grocery shopping.
As illustrated in the following chart showing the strength of PECO’s grocery-anchored advantage:
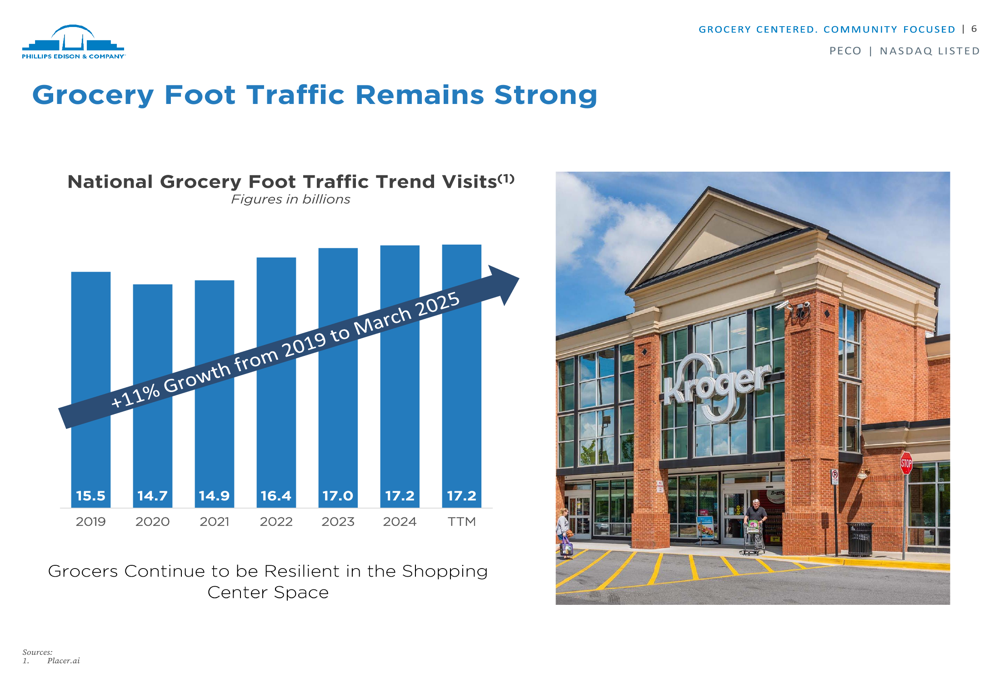
National grocery foot traffic has shown consistent growth, increasing 11% from 2019 to March 2025, reaching 17.2 billion visits on a trailing twelve-month basis.
Tenant Composition and Leasing Performance
PECO maintains a highly diversified tenant mix, with its top grocery anchors including Kroger (NYSE:KR) (5.8% of ABR), Publix (5.1%), and Albertsons/Safeway (3.8%). Beyond grocers, which account for 30% of total ABR, the company’s tenant mix includes restaurants (20%), personal services (16%), other essential retailers (12%), medical (9%), soft goods (8%), and other retailers (5%).
The following breakdown shows PECO’s diversified tenant composition:
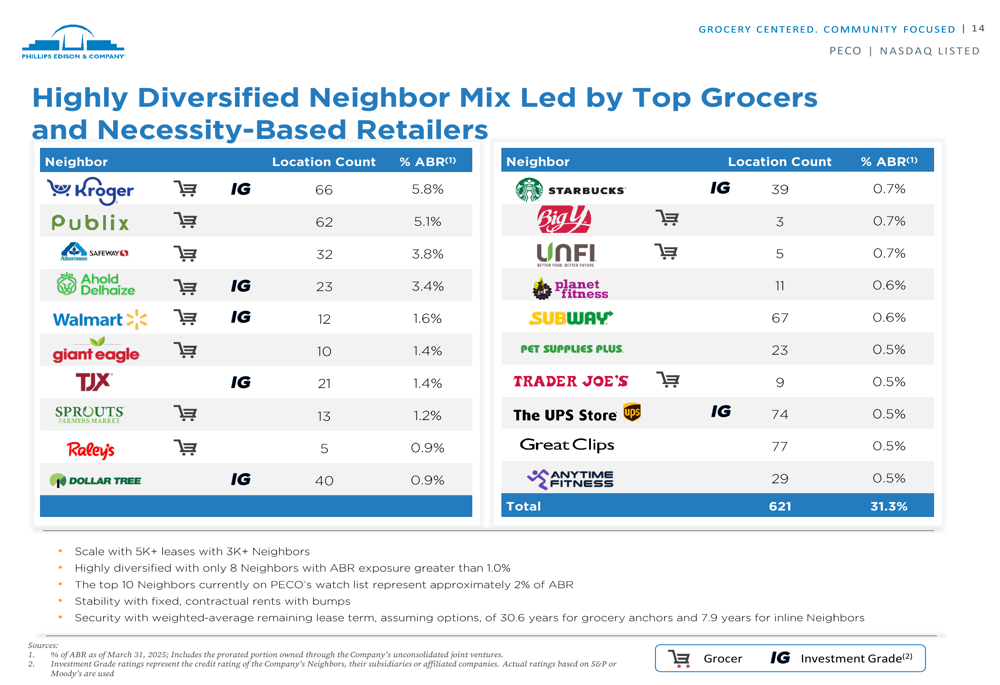
The company has demonstrated strong leasing performance, with inline local tenants showing renewal rent spreads of 21.6% in Q1 2025. Local tenants, which comprise 28% of PECO’s ABR, have proven resilient with an average tenancy of 10 years, well beyond the capital investment payback period of 12 months.
Development and Acquisition Strategy
PECO continues to expand through both development and acquisitions. The company has 16 projects under active construction on land it already owned, plus one additional project on recently acquired land. The total investment in these projects is estimated at $46.9 million with an average estimated yield between 9% and 12%.
As shown in the following development activity summary:
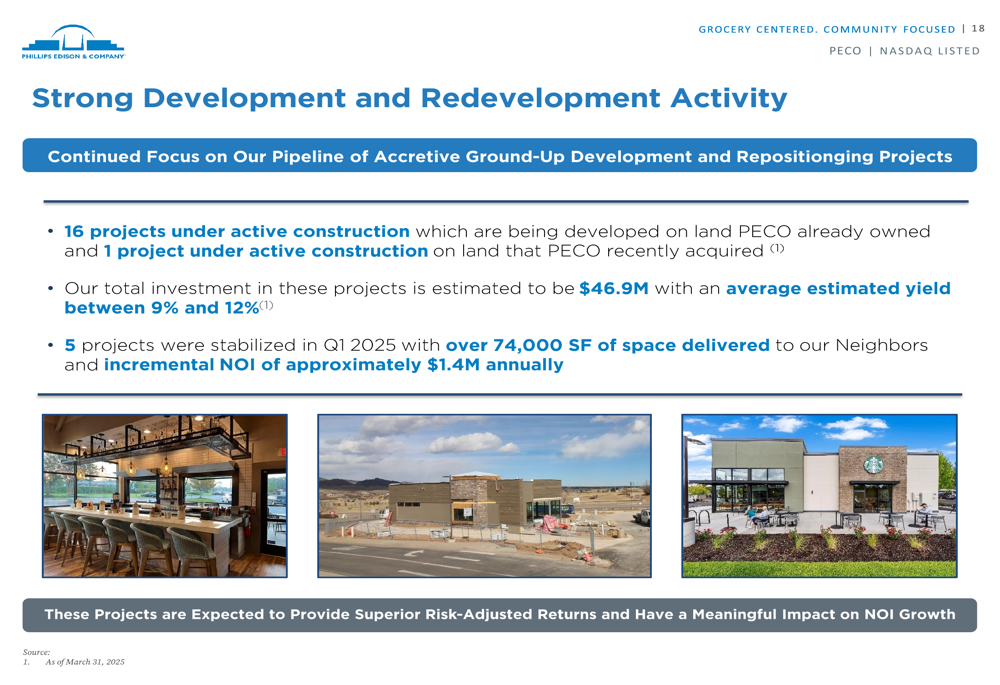
In Q1 2025, PECO stabilized five projects, delivering over 74,000 square feet of space and generating incremental NOI of approximately $1.4 million annually.
On the acquisition front, PECO has been active in 2025, acquiring several properties including Oak Grove Shoppes, Irmo Station, Market at Cross Creek Ranch, Foothill Park Plaza, Broomfield Marketplace, Westgate North Shopping Center, and Clayton Station.
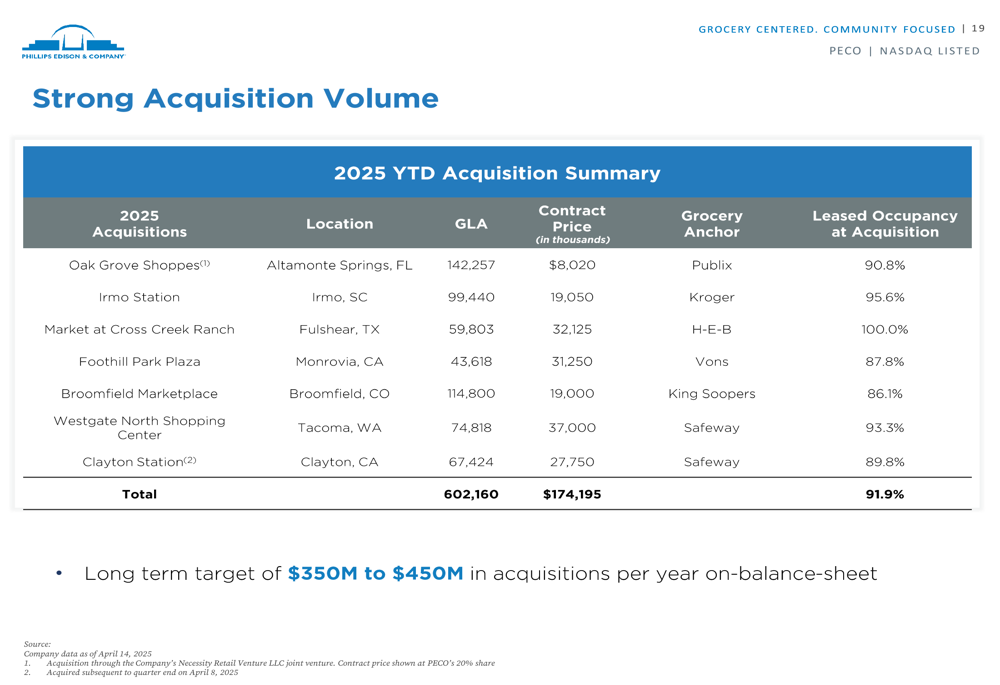
This acquisition activity aligns with the company’s long-term target of $350 million to $450 million in on-balance-sheet acquisitions per year, continuing the momentum from its joint venture with Cohen & Steers (NYSE:CNS) announced in 2024.
Balance Sheet and Financial Outlook
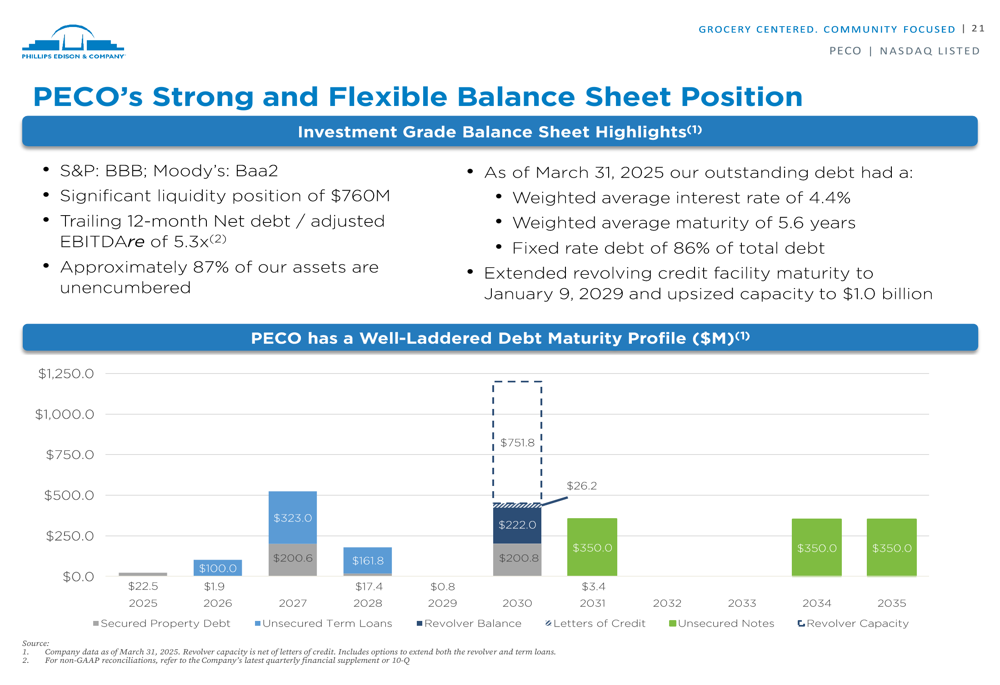
PECO maintains a strong balance sheet with investment-grade ratings (S&P:BBB, Moody’s: Baa2) and significant liquidity of $760 million. The company’s trailing 12-month net debt to adjusted EBITDAre ratio stands at 5.3x, slightly higher than the 5.1x reported in Q2 2024.
The company’s debt profile features a weighted average interest rate of 4.4%, a weighted average maturity of 5.6 years, and 86% fixed-rate debt, providing stability in the current interest rate environment.
As illustrated in the following debt maturity profile:
Looking ahead, PECO has updated its full-year 2025 guidance, projecting Nareit FFO per share of $2.41 to $2.47 (representing 5.7% growth at the midpoint) and Core FFO per share of $2.47 to $2.53 (representing 5.1% growth at the midpoint).
PECO’s Q1 2025 results and guidance demonstrate the continued resilience of its grocery-anchored retail strategy, with strong occupancy, leasing spreads, and tenant retention driving consistent growth in a challenging retail environment.
Full presentation:
This article was generated with the support of AI and reviewed by an editor. For more information see our T&C.