BETA Technologies launches IPO of 25 million shares priced $27-$33

Phillips Edison & Company (NASDAQ:PECO) showcased strong second-quarter performance in its latest earnings presentation, highlighting the resilience of its grocery-anchored shopping center strategy. The retail REIT reported impressive growth metrics and raised its full-year guidance, backed by robust leasing activity and strategic acquisitions.
Financial Performance Highlights
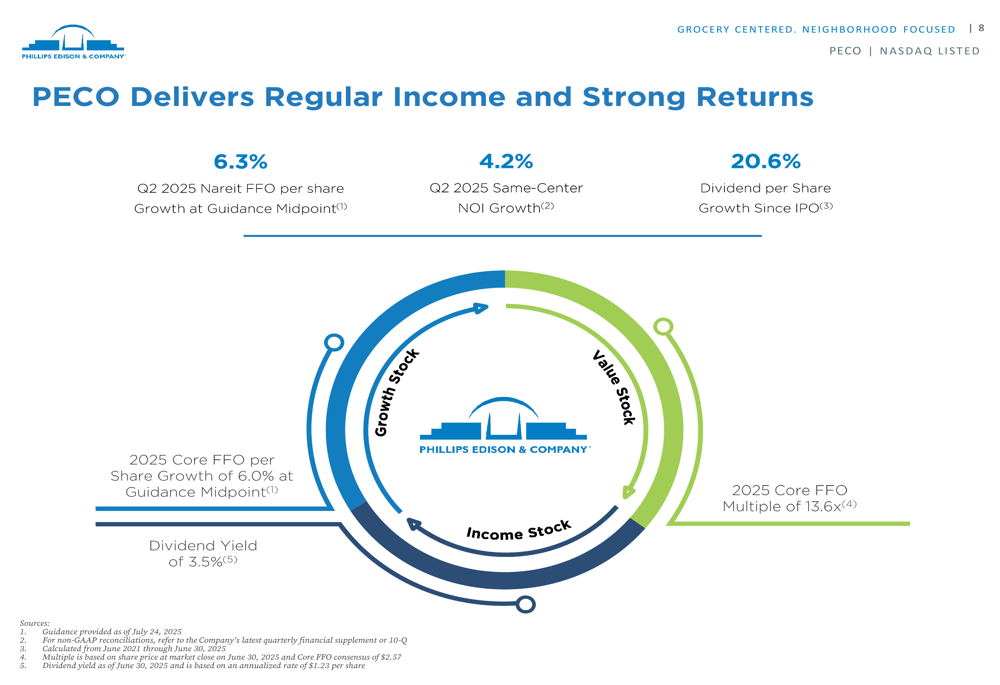
Phillips Edison reported Nareit FFO per share growth of 6.3% at the guidance midpoint for Q2 2025, alongside Same-Center NOI growth of 4.2%. Core FFO per share growth reached 6.0% at the guidance midpoint, reflecting the company’s strong operational performance.
As shown in the following chart detailing the company’s growth metrics:
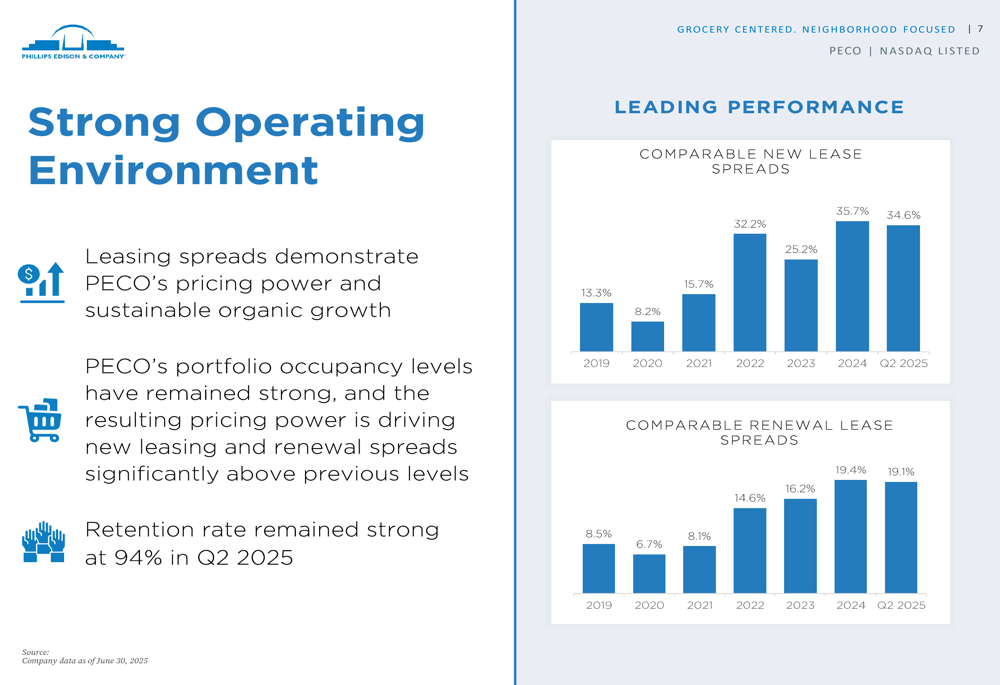
The company maintained a high leased portfolio occupancy rate of 97%, with a portfolio retention rate of 94%. This strong occupancy has enabled PECO to achieve impressive leasing spreads, with comparable new lease spreads of 34.6% and renewal lease spreads of 19.1% in Q2 2025, significantly above historical levels.
The following chart illustrates the company’s consistent improvement in leasing spreads over time:
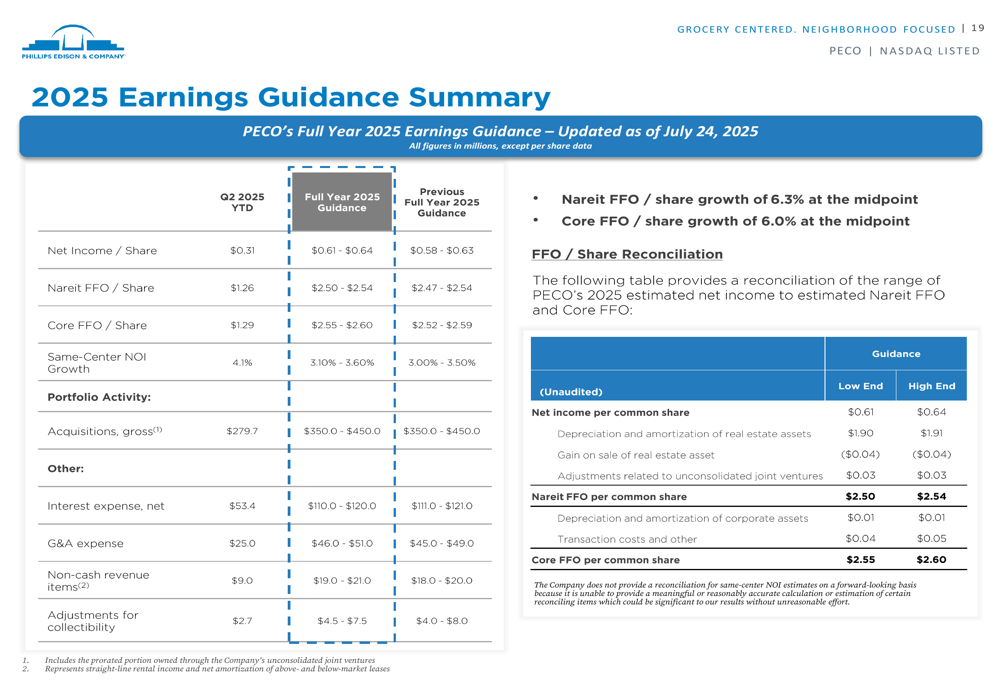
PECO updated its full-year 2025 guidance, raising projections for both Nareit FFO and Core FFO. The updated guidance reflects confidence in continued strong performance through the remainder of the year.
As detailed in this comprehensive guidance summary:
Strategic Acquisitions and Development
Phillips Edison has maintained an active acquisition strategy, completing $287.3 million in acquisitions year-to-date across 13 properties totaling over 1.17 million square feet of gross leasable area. The company’s long-term target is $350-450 million in gross acquisitions per year.
The company’s development pipeline remains robust, with 21 projects under active construction representing a total investment of approximately $65 million. These projects are expected to generate yields between 9% and 12%. Additionally, PECO stabilized 9 projects in the first six months of 2025, delivering over 180,000 square feet of space and generating incremental NOI of approximately $3.7 million annually.
Grocery-Anchored Advantage
Phillips Edison’s strategic focus on grocery-anchored shopping centers continues to drive its success, with 95% of annual base rent (ABR) coming from grocery-anchored centers. The company emphasizes that 85% of its ABR comes from shopping centers anchored by the #1 or #2 grocery store by sales in their respective markets.
The following chart illustrates PECO’s grocery-anchored advantage, showing consistent growth in grocer sales per square foot:
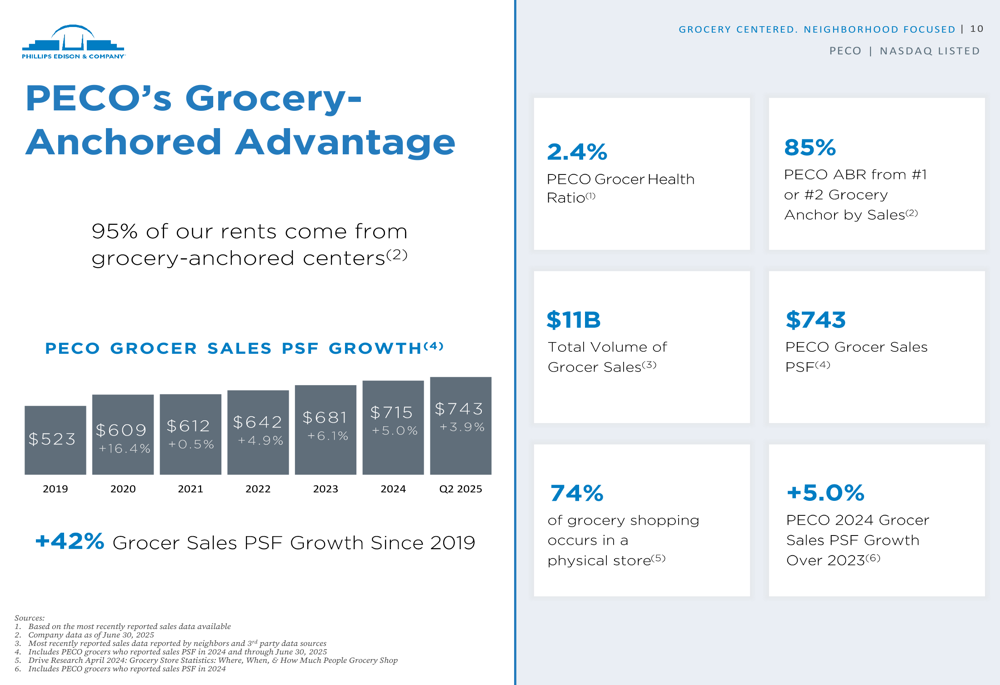
Grocery foot traffic has shown strong resilience, with national grocery foot traffic increasing 12% from 2019 to June 2025. This trend supports PECO’s strategy, as grocery stores continue to drive consistent customer traffic to its shopping centers.
Diversified Tenant Mix
Phillips Edison maintains a highly diversified tenant mix, with 70% of ABR coming from necessity-based goods and services retailers. The company’s top tenants include leading grocers such as Kroger, Publix, and Safeway, but no single tenant accounts for more than 5.6% of ABR.
The following chart details PECO’s tenant diversification:
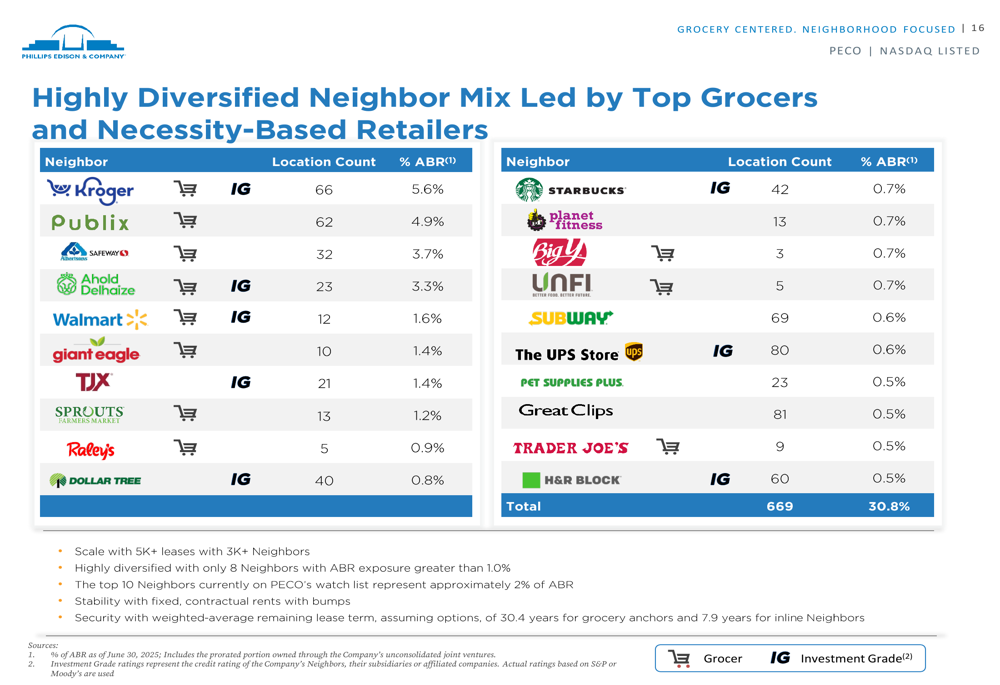
This diversification provides stability and reduces risk, with only eight tenants having ABR exposure greater than 1.0%. The company also notes that its top 10 tenants on its watch list represent only approximately 2% of ABR.
Balance Sheet Strength and Outlook
Phillips Edison maintains a strong balance sheet with investment grade ratings (S&P:BBB; Moody’s:Baa2) and significant liquidity of $972 million. The company’s trailing 12-month net debt to adjusted EBITDAre ratio stands at 5.4x, with approximately 88% of assets unencumbered.
As illustrated in the following debt maturity profile:
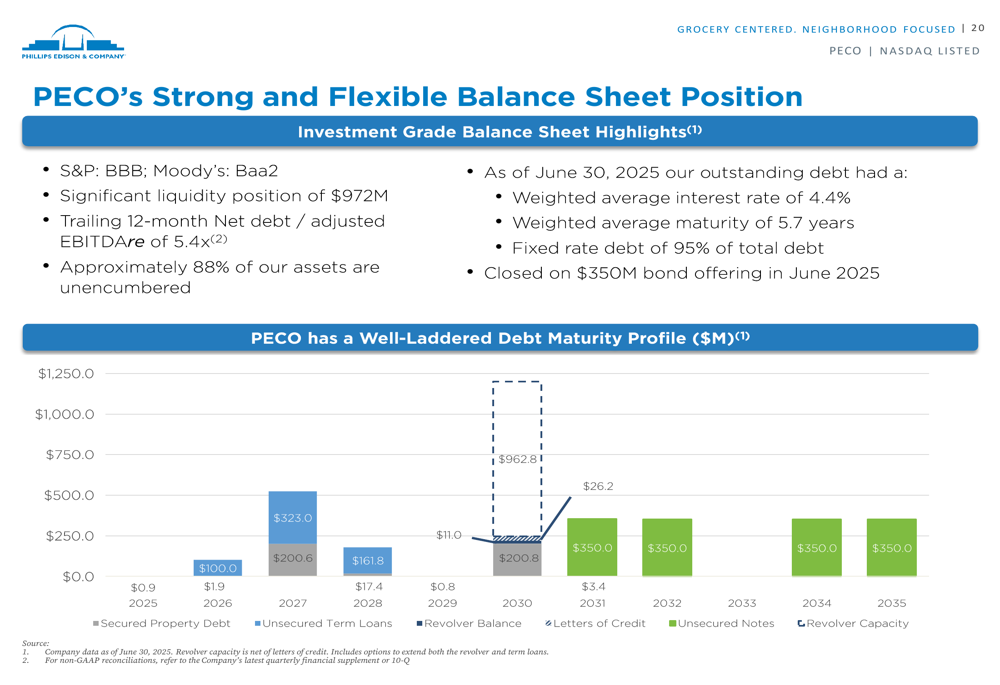
The company’s debt has a weighted average interest rate of 4.4% and a weighted average maturity of 5.7 years, with 95% of total debt at fixed rates. This strong financial position supports PECO’s ongoing acquisition and development strategies.
Market Position and Future Prospects
Phillips Edison’s focus on necessity-based retail has positioned it well in the current market environment. The company highlights its low exposure to tariff risks compared to other REITs, with 85% of its tenants having low tariff risk exposure.
Looking ahead, PECO expects continued strong performance driven by its grocery-anchored strategy, with same-center NOI growth projected between 3.1% and 3.6% for the full year 2025. The company’s dividend yield stands at 3.5%, with dividend per share growth of 20.6% since its IPO.
The earnings presentation aligns closely with the company’s actual Q2 2025 results, which showed NAREIT FFO of $86 million ($0.62/share) representing 8.8% year-over-year growth. The slight discrepancy in reported portfolio occupancy (97% in the presentation versus 97.4% in the earnings report) reflects continued improvement in leasing performance.
Full presentation:
This article was generated with the support of AI and reviewed by an editor. For more information see our T&C.