Gold rally takes a breather amid Gaza ceasefire, Fed minutes

Raymond James Financial Inc (NYSE:RJF) reported solid year-over-year growth in its fiscal second quarter 2025 results, with net revenues reaching $3.4 billion, up 9% from the same period last year. The financial services firm released its quarterly presentation on April 23, 2025, showing adjusted earnings per share of $2.42, though this marked a sequential decline from the record $2.93 reported in Q1.
Quarterly Performance Highlights
Raymond (NSE:RYMD) James achieved a pre-tax margin of 19.7% (20.3% on an adjusted basis) and return on common equity of 16.4% for the quarter ended March 31, 2025. The company’s client assets under administration reached $1.54 trillion, with $873 billion in fee-based accounts within its Private Client Group.
As shown in the following comprehensive overview of key metrics from the presentation:
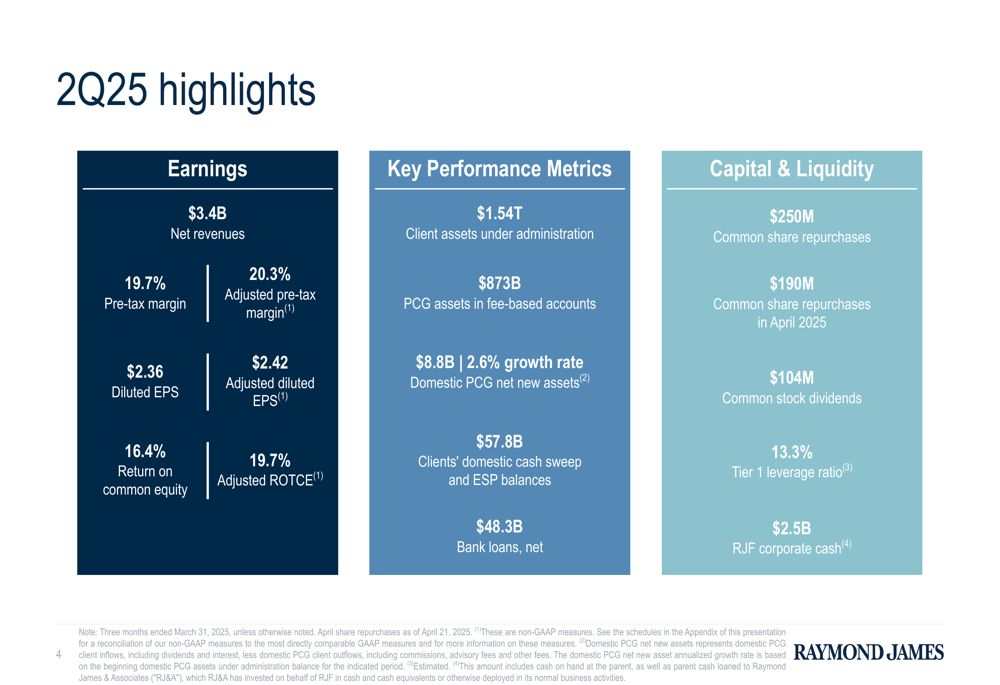
The company’s domestic Private Client Group generated net new assets of $8.8 billion, representing a 2.6% annualized growth rate. This solid asset gathering occurred despite a slight decline in clients’ domestic cash sweep and Enhanced Savings Program balances, which fell to $57.8 billion from $59.7 billion in the previous quarter.
Segment Results Analysis
All major business segments showed year-over-year improvement in pre-tax income, with particularly strong performance in the Capital Markets segment, which swung from a $5 million loss in Q2 2024 to a $36 million profit in Q2 2025. The Asset Management segment saw pre-tax income rise to $121 million from $100 million a year earlier, while the Bank segment improved to $117 million from $75 million.
The detailed segment breakdown reveals the contribution of each business unit to the overall results:
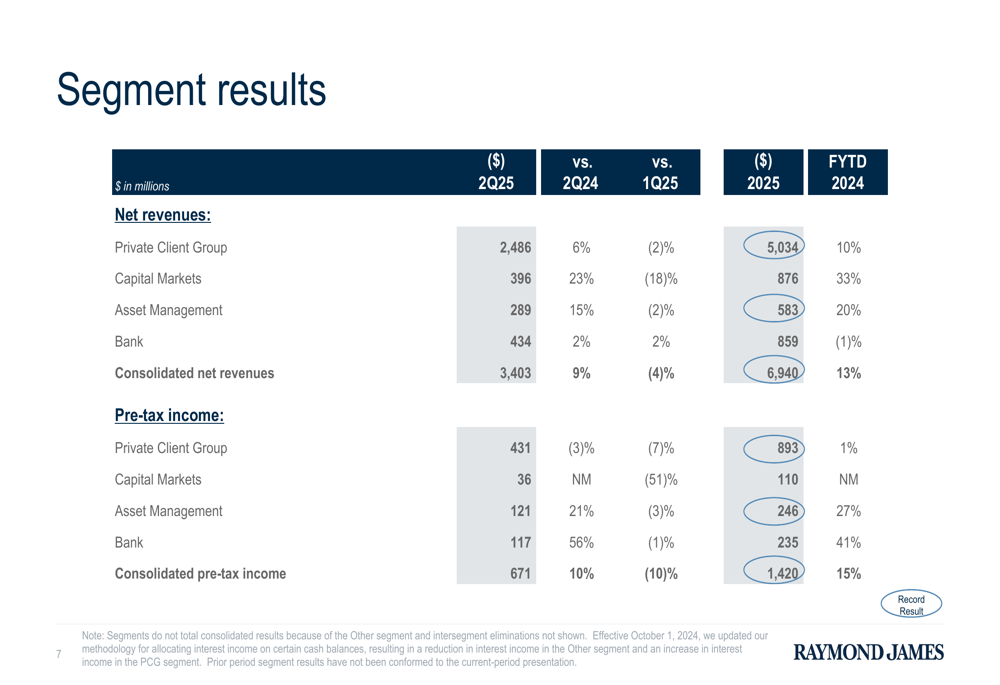
The Private Client Group, Raymond James’ largest segment, generated net revenues of $2.49 billion but saw a slight year-over-year decline in pre-tax income to $431 million from $443 million. This segment continues to be the primary driver of the firm’s overall performance, accounting for approximately 73% of total net revenues.
Financial Summary and Market Context
Raymond James’ consolidated financial summary shows consistent improvement across key metrics compared to the prior year:
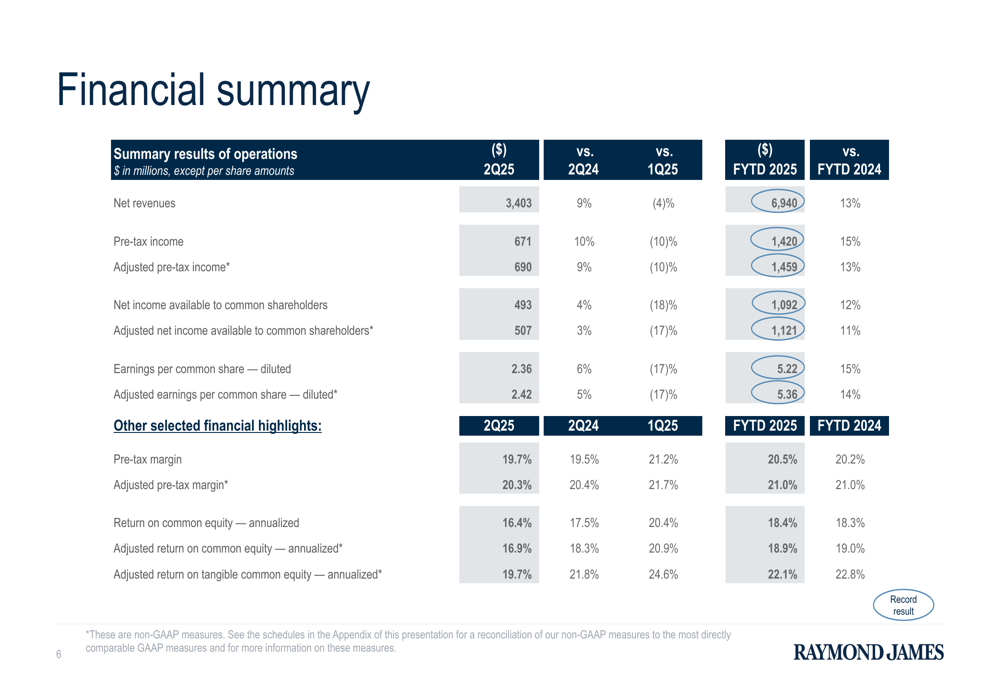
Despite these solid results, Raymond James stock declined 2.33% in aftermarket trading to $132.18, according to the provided fundamentals data. This reaction came despite the company’s year-over-year growth and continued capital return to shareholders.
Net Interest Income and Cash Balance Trends
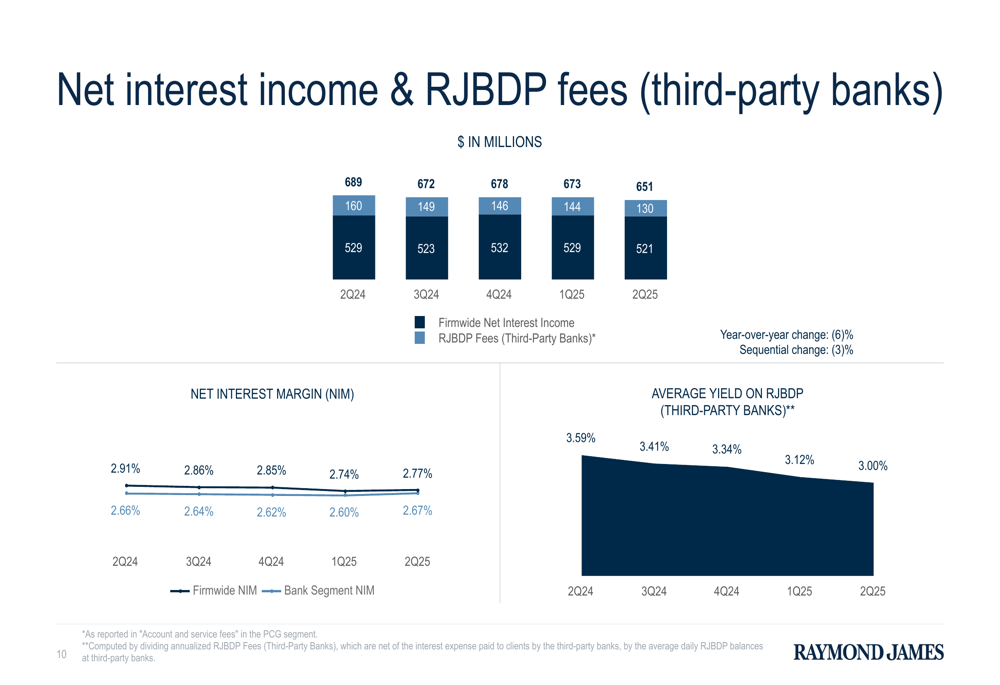
The company reported firmwide net interest income of $651 million, down 6% year-over-year and 3% sequentially. This decline reflects the challenging interest rate environment and changes in client cash balances. The net interest margin for the firm was 2.67%, while the Bank segment’s net interest margin was 2.77%.
The following chart illustrates the trend in domestic cash sweep and ESP balances:
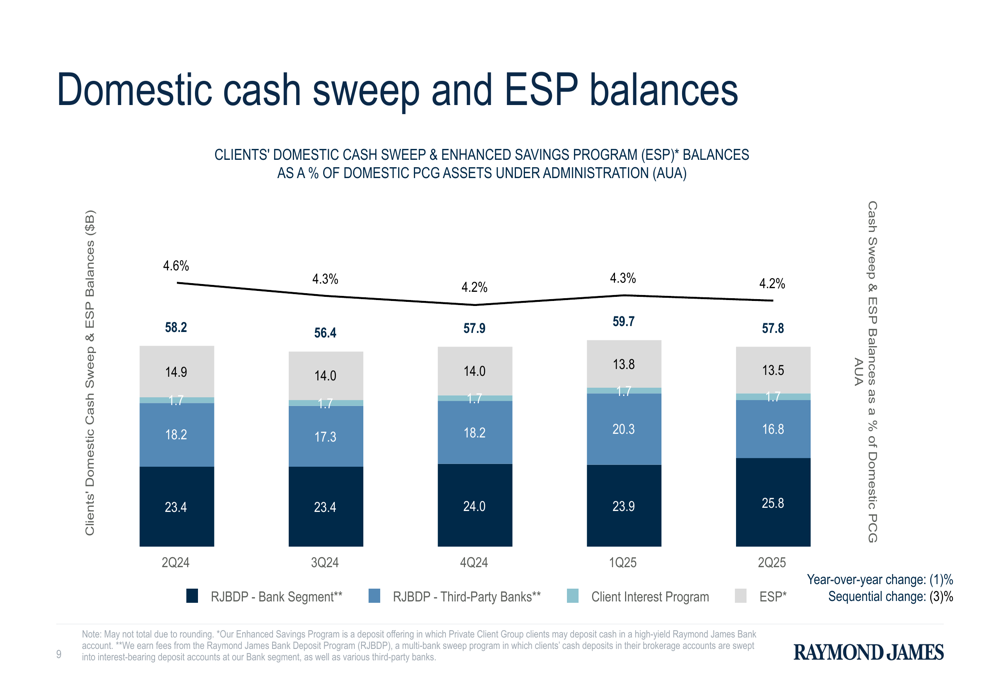
Cash balances as a percentage of domestic PCG assets under administration remained relatively stable at 4.2%, compared to 4.3% in the previous quarter and 4.6% a year ago. The composition of these balances has shifted, with Enhanced Savings Program balances increasing to $25.8 billion from $23.4 billion a year earlier.
The firm’s net interest income and RJBDP fees from third-party banks show the following trends:
Capital Management and Outlook
Raymond James continued its strong capital management program, repurchasing $250 million of common stock during Q2 2025, followed by an additional $190 million in April 2025 at an average price of $125 per share. The company also paid $104 million in dividends during the quarter.
The presentation highlights the firm’s capital return activities over the past five quarters:
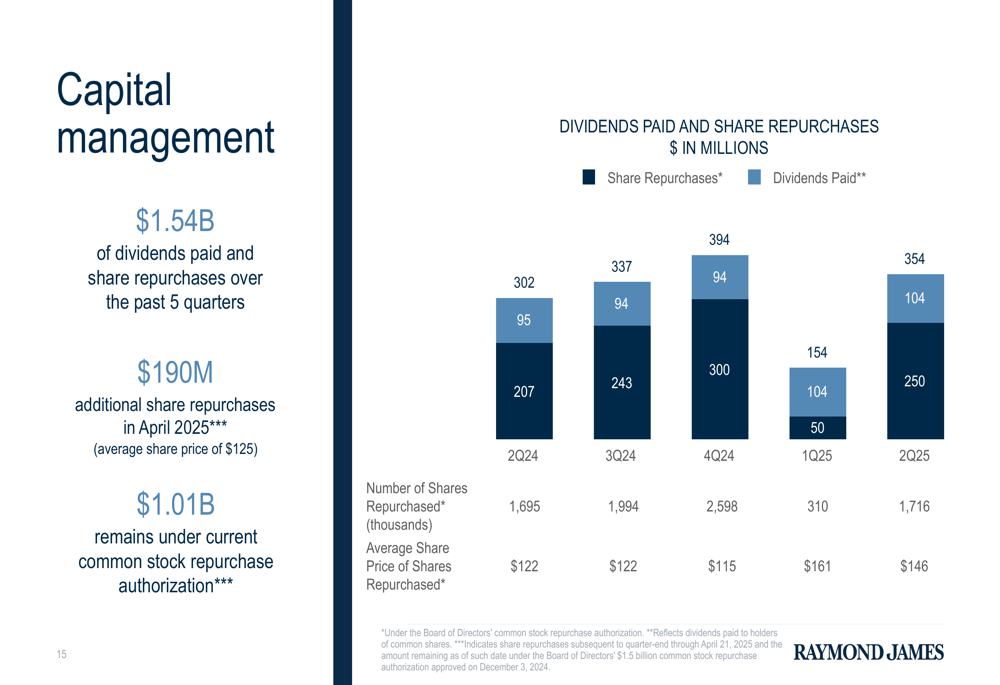
In total, Raymond James has returned $1.54 billion to shareholders through dividends and share repurchases over the past five quarters. The company still has $1.01 billion remaining under its current share repurchase authorization, suggesting continued focus on returning capital to shareholders.
Raymond James maintained a strong capital position with a Tier 1 leverage ratio of 13.3%, up from 12.3% a year ago, and corporate cash of $2.5 billion. Book value per share increased to $59.74 from $52.60 in the prior year, while tangible book value per share rose to $51.29 from $44.11.
Expense Management
The company’s consolidated expenses increased year-over-year, with total non-interest expenses rising to $2.73 billion from $2.51 billion in Q2 2024. Compensation, commissions, and benefits, which represent the largest expense category, increased to $2.2 billion from $2.04 billion a year ago.
The following chart shows the breakdown of consolidated expenses:
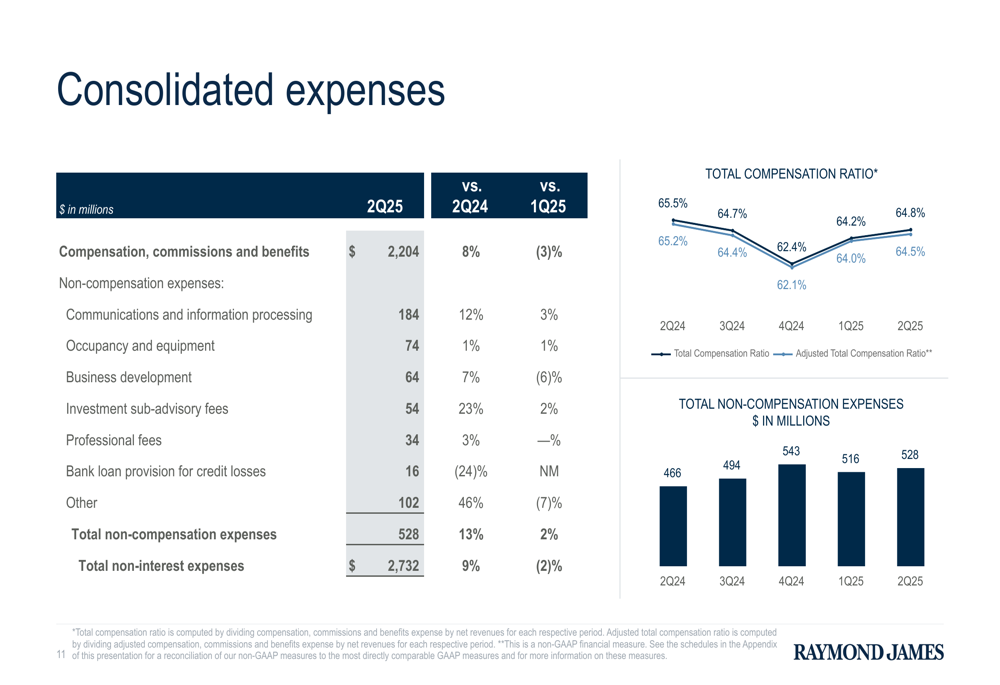
The total compensation ratio was 64.8% for Q2 2025, slightly lower than the 65.5% reported in Q2 2024. Non-compensation expenses increased to $528 million from $466 million a year earlier, partly due to higher communications and information processing costs and other expenses.
Overall, Raymond James’ Q2 2025 results demonstrate the company’s ability to generate year-over-year growth despite sequential moderation from the record first quarter. The firm’s continued focus on capital management and strong performance across business segments positions it well for the remainder of fiscal 2025.
Full presentation:
This article was generated with the support of AI and reviewed by an editor. For more information see our T&C.