Adaptimmune stock plunges after announcing Nasdaq delisting plans

Rexford Industrial Realty (NYSE:REXR) released its second quarter 2025 earnings presentation on July 17, showcasing resilient performance despite challenging market conditions in Southern California’s industrial real estate sector. The industrial REIT maintained its full-year guidance while highlighting substantial embedded NOI growth potential and strong leasing spreads, even as market rents declined across its portfolio.
Quarterly Performance Highlights
For Q2 2025, Rexford reported Core FFO of $0.59 per share, representing a 1.7% year-over-year decline but a slight improvement from the previous quarter. The company achieved Same Property Cash NOI growth of 3.9% for the quarter and 4.5% year-to-date, while maintaining high occupancy levels at 96.1%.
"Our irreplaceable infill portfolio, substantial embedded NOI growth, and value creation strategy position us to deliver significant shareholder value," noted Laura Clark, COO, according to the earnings call transcript.
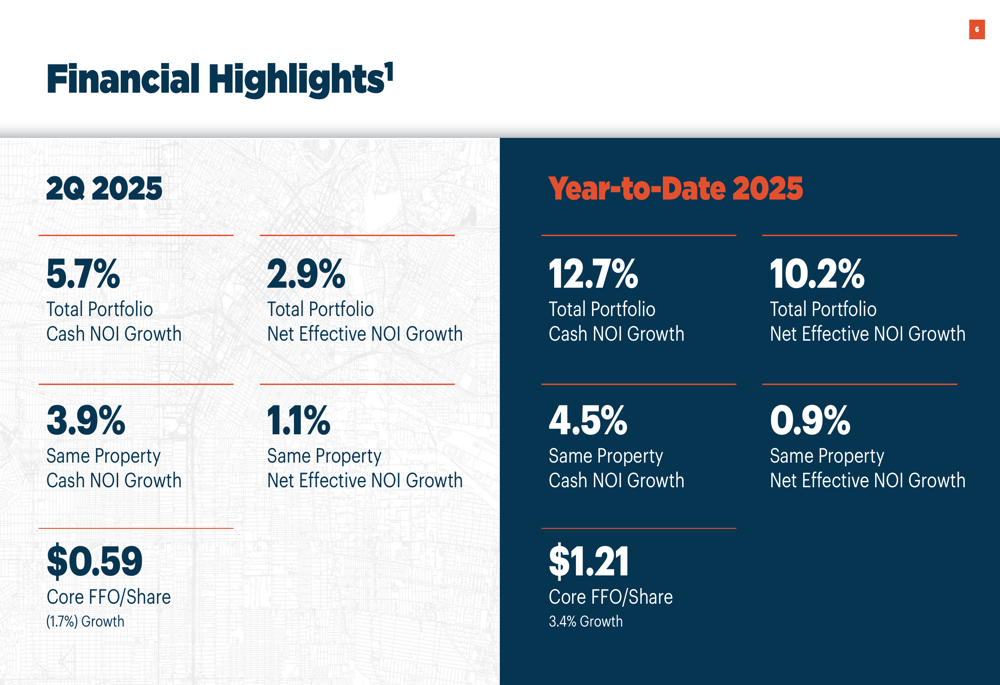
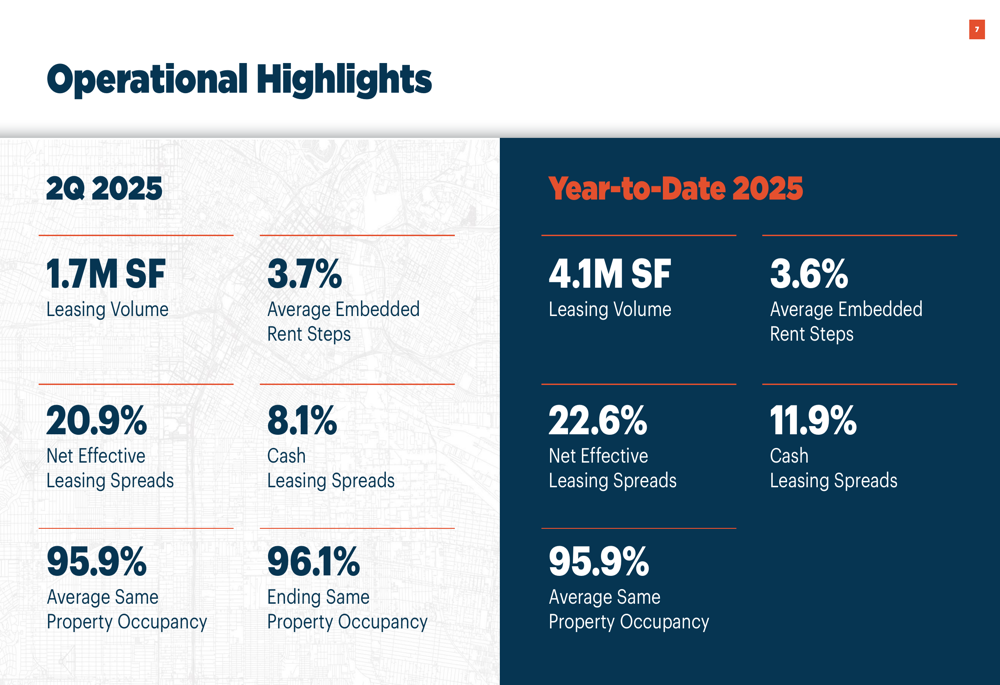
The company executed 1.7 million square feet of leasing during the quarter, achieving impressive net effective leasing spreads of 20.9% and cash leasing spreads of 8.1%. Year-to-date, Rexford has completed 4.1 million square feet of leasing with net effective spreads of 22.6%.
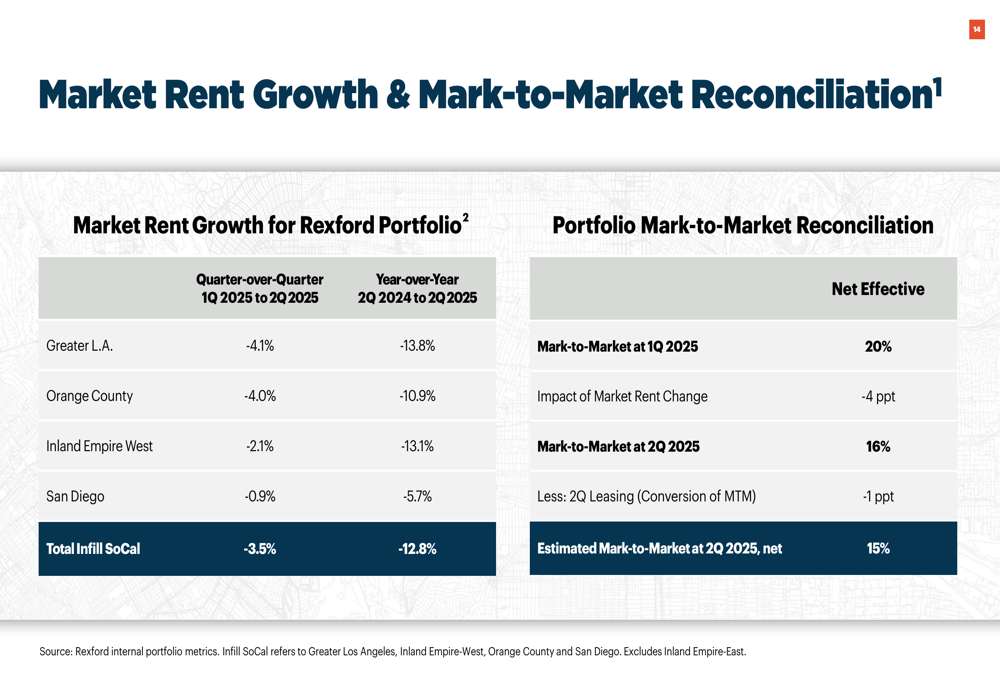
Despite these positive leasing results, Rexford faced headwinds from declining market rents across its Southern California portfolio. Market rents decreased by 3.5% sequentially and 12.8% year-over-year, with Greater Los Angeles experiencing the steepest declines at 4.1% sequentially and 13.8% year-over-year.
Strategic Initiatives & Capital Allocation
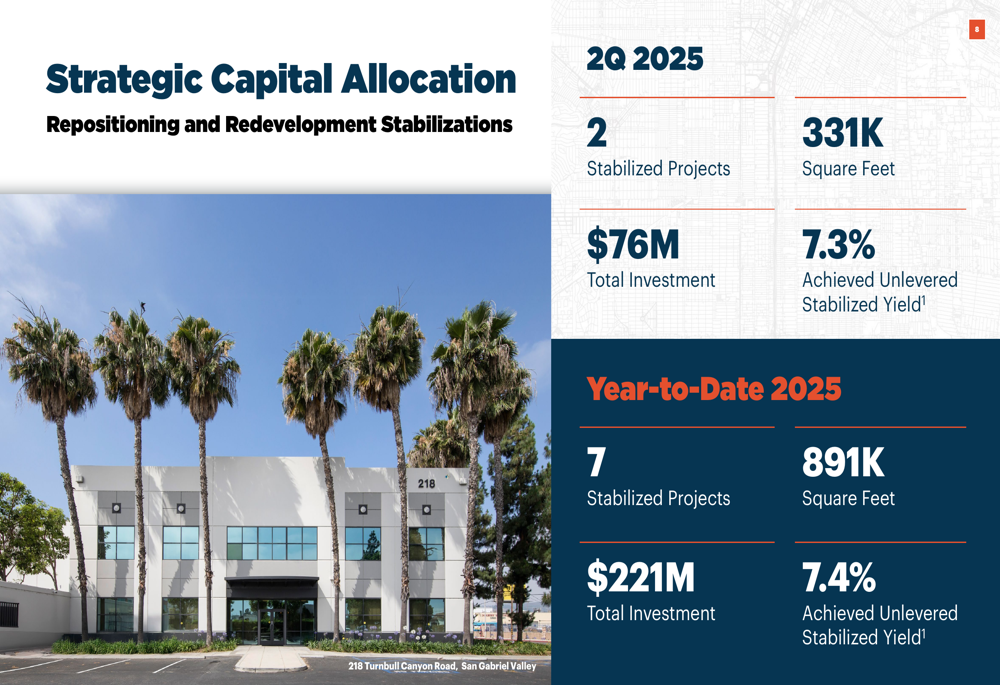
Rexford continues to focus on its value-add repositioning and redevelopment strategy. During Q2, the company stabilized two projects totaling 331,000 square feet with a total investment of $76 million, achieving an unlevered stabilized yield of 7.3%. Year-to-date, Rexford has stabilized seven projects totaling 891,000 square feet with a 7.4% unlevered yield.
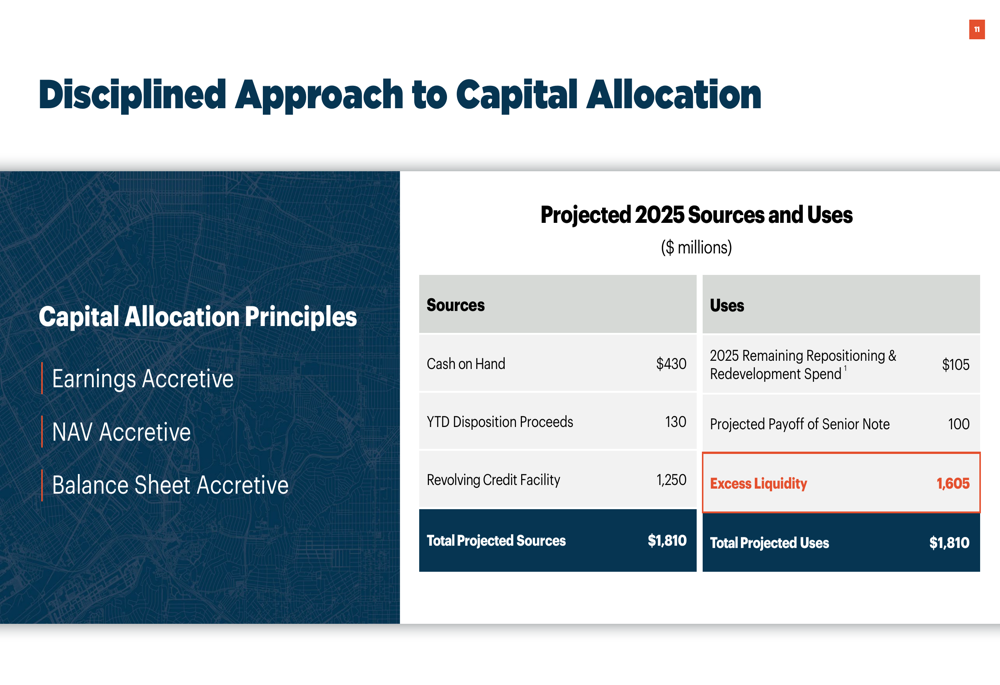
The company is pursuing a disciplined capital allocation approach, focusing on earnings accretion, NAV accretion, and balance sheet strength. For 2025, Rexford projects $1.81 billion in capital sources, including cash on hand, disposition proceeds, and its revolving credit facility, with planned uses including repositioning and redevelopment spending and debt payoff.
On the transaction front, Rexford completed two dispositions in Q2 totaling 209,000 square feet for $82 million, achieving an unlevered IRR of 12.8%. Year-to-date, the company has sold three properties for $134 million with an 11.9% unlevered IRR. The company had no acquisitions under contract, reflecting its cautious approach in the current market environment.
Balance Sheet & Liquidity
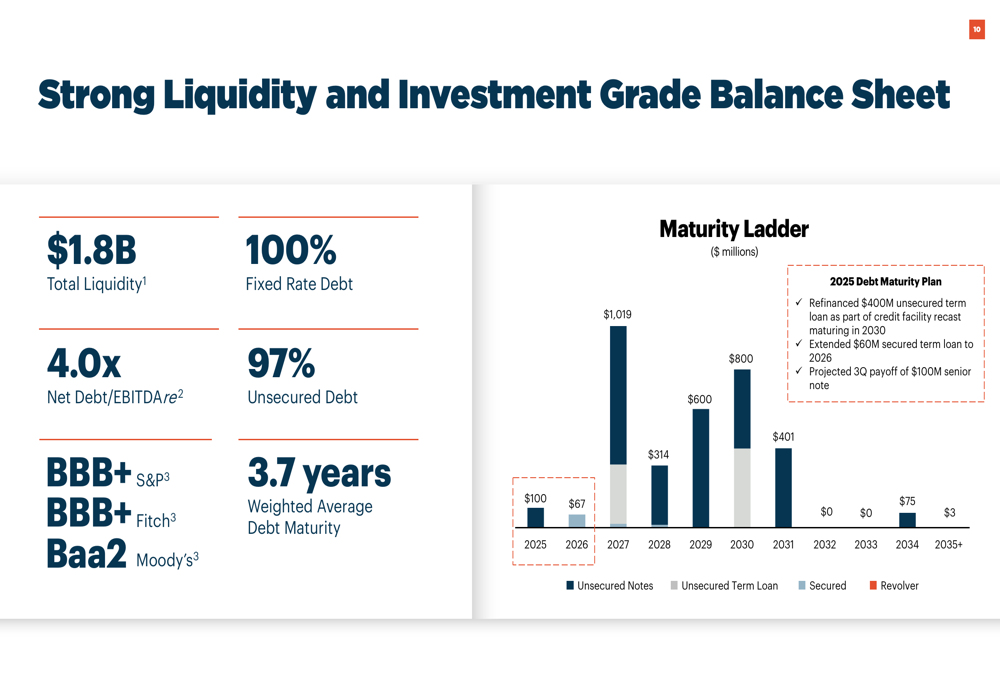
Rexford maintains a strong financial position with $1.8 billion in total liquidity and an investment-grade balance sheet. The company has a Net Debt to EBITDAre ratio of 4.0x, with 100% fixed-rate debt and 97% unsecured debt. Rexford holds investment grade ratings from all three major agencies (BBB+ from S&P and Fitch, Baa2 from Moody’s).
"The markets where Rexford Industrial Realty is present, our strategy is to own the best locations within the strongest infill market in the country, possibly the world," emphasized Co-CEO Michael Frankel during the earnings call.
Forward-Looking Statements & Guidance
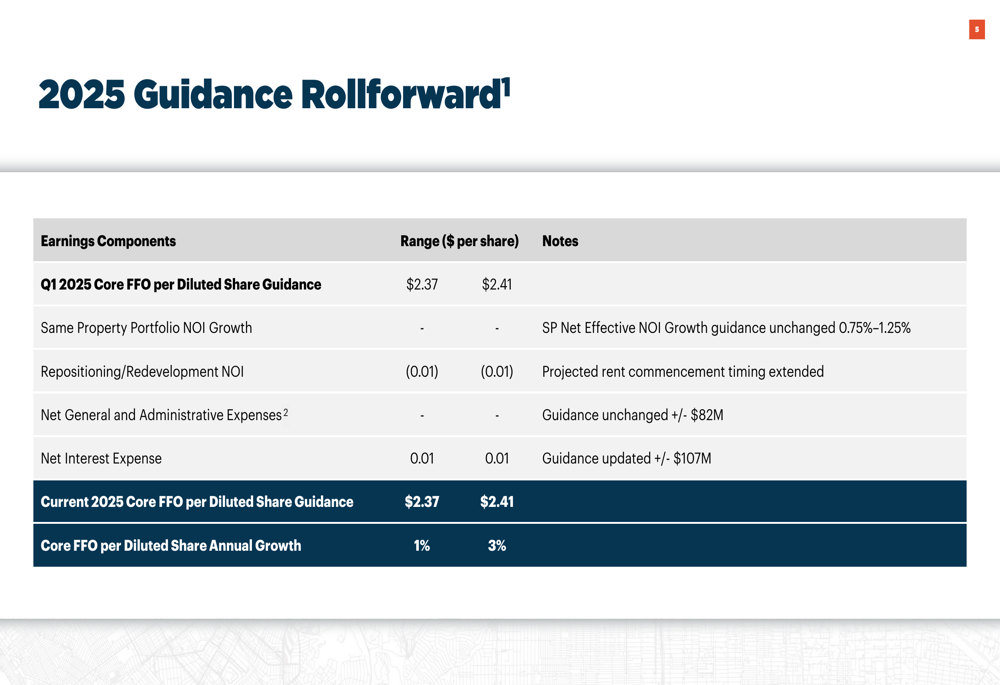
Despite market challenges, Rexford maintained its 2025 Core FFO per share guidance range of $2.37 to $2.41, representing annual growth of 1% to 3%. The company noted that while repositioning and redevelopment NOI has projected rent commencement timing extended, other guidance components remain unchanged.
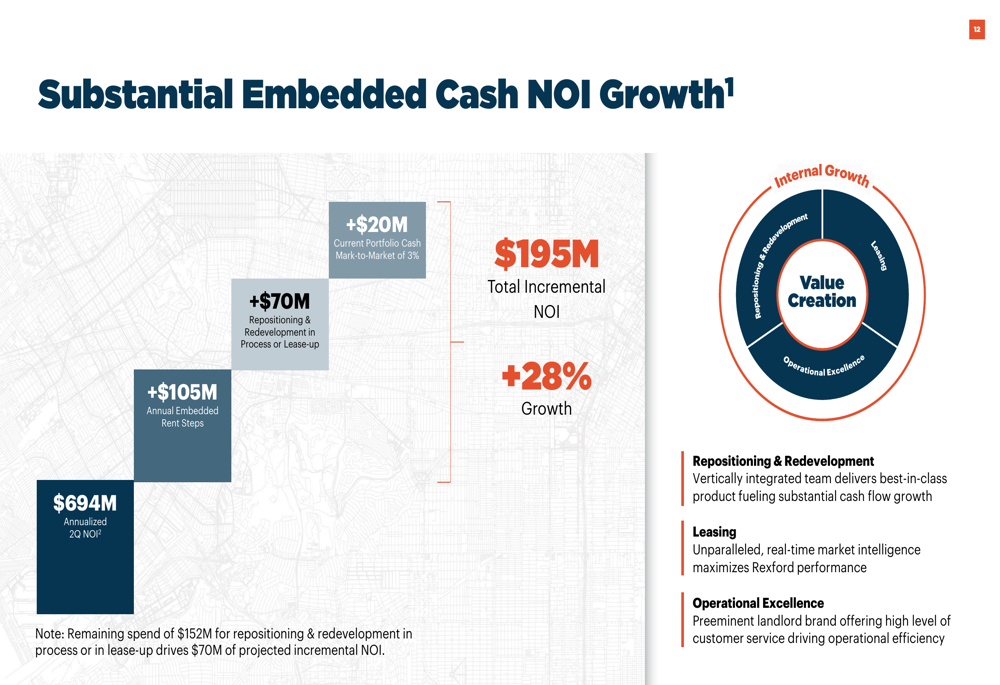
Perhaps most significantly, Rexford highlighted substantial embedded cash NOI growth potential of $195 million, representing a 28% increase over current levels. This growth is expected to come from three main sources: annual embedded rent steps (+$105 million), repositioning and redevelopment projects (+$70 million), and mark-to-market opportunities (+$20 million).
The stock saw a premarket dip of 1.68% to $39.86 following the earnings release, reflecting broader market pressures and specific regional challenges. However, Rexford’s focus on high-quality infill locations in Southern California, combined with its strong balance sheet and embedded growth potential, positions the company to navigate the current market environment.
During the Q&A session of the earnings call, executives addressed concerns about the Hertz asset lease expiration in March 2026, which could affect $9 million in NOI, and reaffirmed their cautious approach to acquisitions while focusing on repositioning and redevelopment projects to drive future growth.
Full presentation:
This article was generated with the support of AI and reviewed by an editor. For more information see our T&C.