One & One Green Technologies stock soars 100% after IPO debut

Introduction & Market Context
SAF-Holland SE (ETR:SFQ) presented its first quarter 2025 results on May 8, revealing an 11.1% year-over-year revenue decline amid challenging market conditions across its global operations. The commercial vehicle supplier’s stock reacted negatively to the results, with shares falling 2.47% to €16.58 in recent trading, according to market data.
Despite the revenue contraction, the company demonstrated resilience by maintaining solid profitability metrics and generating positive free cash flow. Management also unveiled its new "drive2030" corporate strategy while reaffirming its full-year 2025 guidance.
Quarterly Performance Highlights
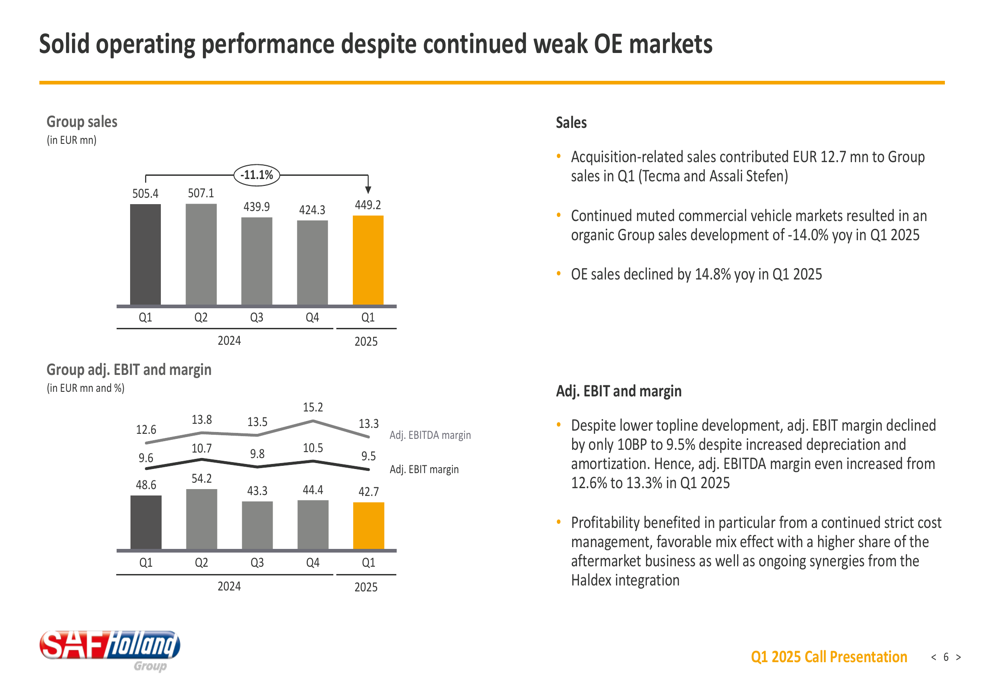
SAF-Holland reported Q1 2025 sales of €449.2 million, down from €505.4 million in the same period last year. The decline was primarily attributed to weakness in original equipment (OE) markets, with OE sales falling 14.8% year-over-year. However, the company’s aftermarket business continued to show resilience, helping to partially offset the OE market challenges.
As shown in the following financial highlights chart:
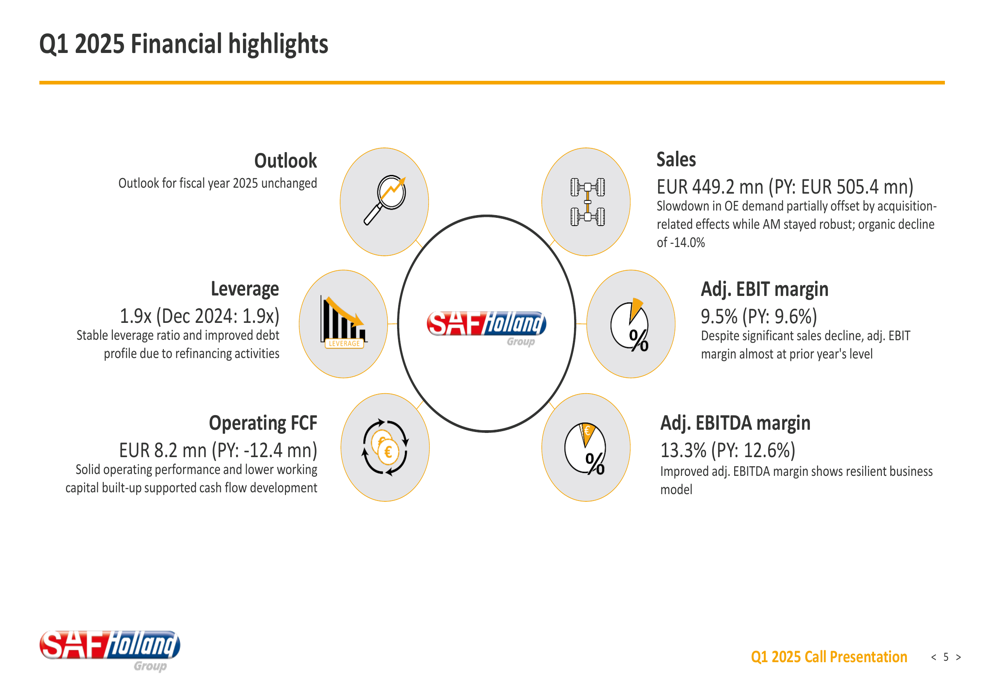
Despite the revenue decline, SAF-Holland maintained a solid adjusted EBIT margin of 9.5%, only slightly below the 9.6% achieved in Q1 2024. More impressively, the adjusted EBITDA margin improved to 13.3% from 12.6% in the prior year period, demonstrating the company’s ability to manage costs effectively in a challenging environment.
The company’s quarterly performance trend illustrates the revenue decline while highlighting the relatively stable profit margins:
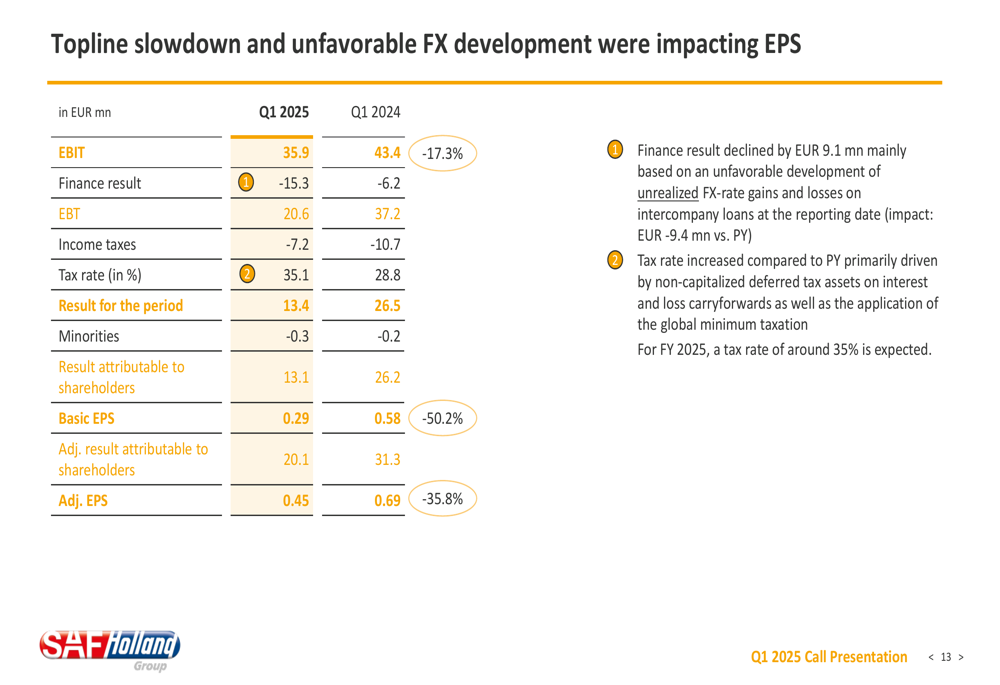
SAF-Holland’s earnings per share declined significantly to €0.29, down 50.2% from €0.58 in Q1 2024. Adjusted EPS fell 35.8% to €0.45. This substantial decline was partly due to an unfavorable finance result, which was negatively impacted by unrealized foreign exchange valuation effects:
On a positive note, the company generated operating free cash flow of €8.2 million, a marked improvement from the negative €12.4 million in Q1 2024. This improvement was driven by favorable working capital development and strong operational performance.
Regional Performance Analysis
SAF-Holland’s performance varied across its three main regions, with all experiencing organic sales declines but maintaining profitability at different levels.
The company’s sales remained diversified across regions, with Americas representing 39.3% of total sales, EMEA 48.7%, and APAC 12.0% in Q1 2025:
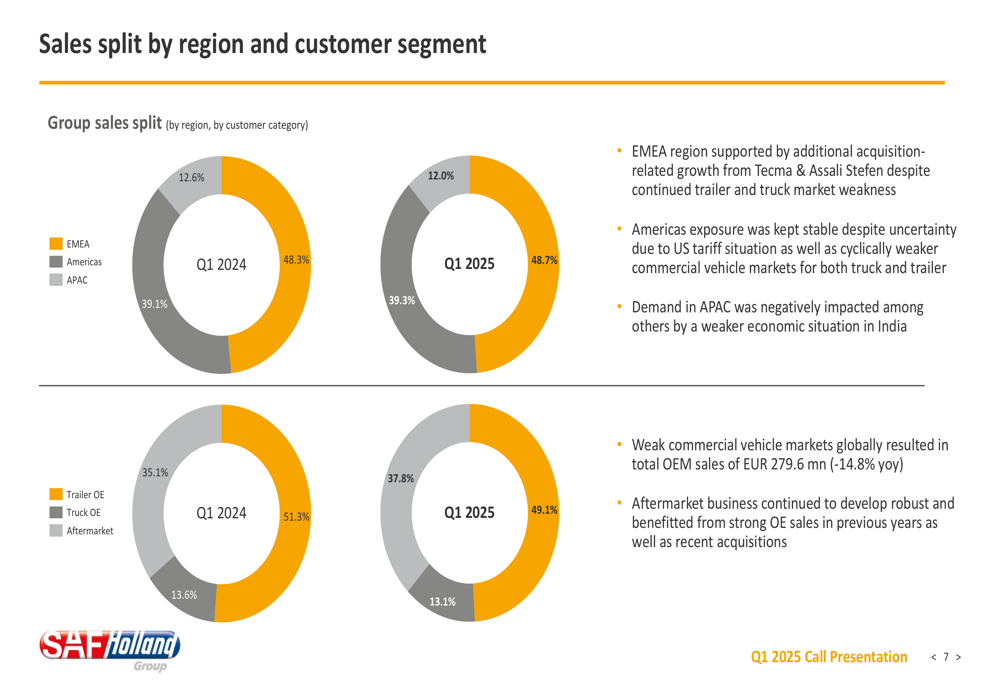
In the EMEA region, sales reached €218.9 million, with organic sales declining 16.0% year-over-year, primarily due to weakness in the trailer market. The adjusted EBIT margin in this region fell to 7.5% from 8.1% in Q1 2024, impacted by higher depreciation costs.
The Americas region recorded sales of €176.4 million, with organic sales down 11.2% compared to the previous year. Despite this decline, the region achieved an improved adjusted EBIT margin of 11.4%, up from 10.6% in Q1 2024, supported by ongoing cost-cutting measures.
In the APAC region, sales totaled €53.9 million, with organic sales declining 14.8% year-over-year, primarily due to weakness in the Indian trailer OE business. The region maintained a solid adjusted EBIT margin of 11.4%, though down from 12.1% in the prior year period.
Strategic Initiatives
A key highlight of SAF-Holland’s Q1 presentation was the introduction of its new "drive2030" corporate strategy, which outlines ambitious long-term targets and strategic priorities:
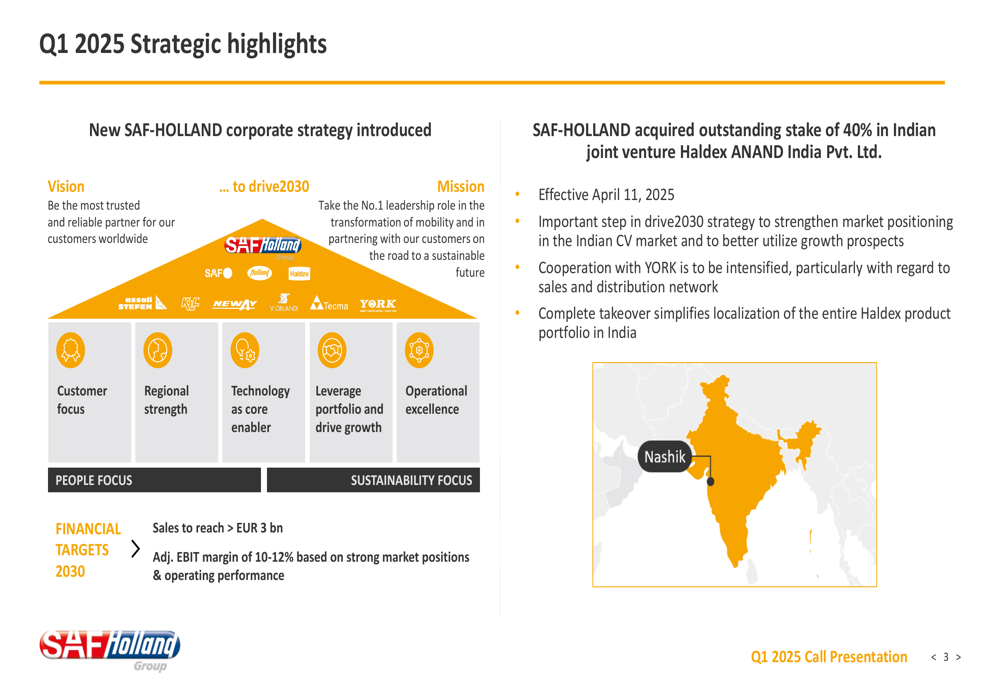
The strategy centers on the company’s vision to "be the most trusted and reliable partner for customers worldwide" and its mission to "take the No.1 leadership role in the transformation of mobility." Financial targets for 2030 include growing sales to more than €3 billion and achieving an adjusted EBIT margin of 10-12%.
As part of its strategic expansion, SAF-Holland acquired the outstanding 40% stake in its Indian joint venture, Haldex ANAND India Pvt. Ltd., effective April 11, 2025. This acquisition aims to strengthen the company’s market position in the Indian commercial vehicle market and better utilize growth prospects in the region.
Outlook & Forward Guidance
Despite the challenging market conditions in Q1, SAF-Holland maintained its full-year 2025 guidance:
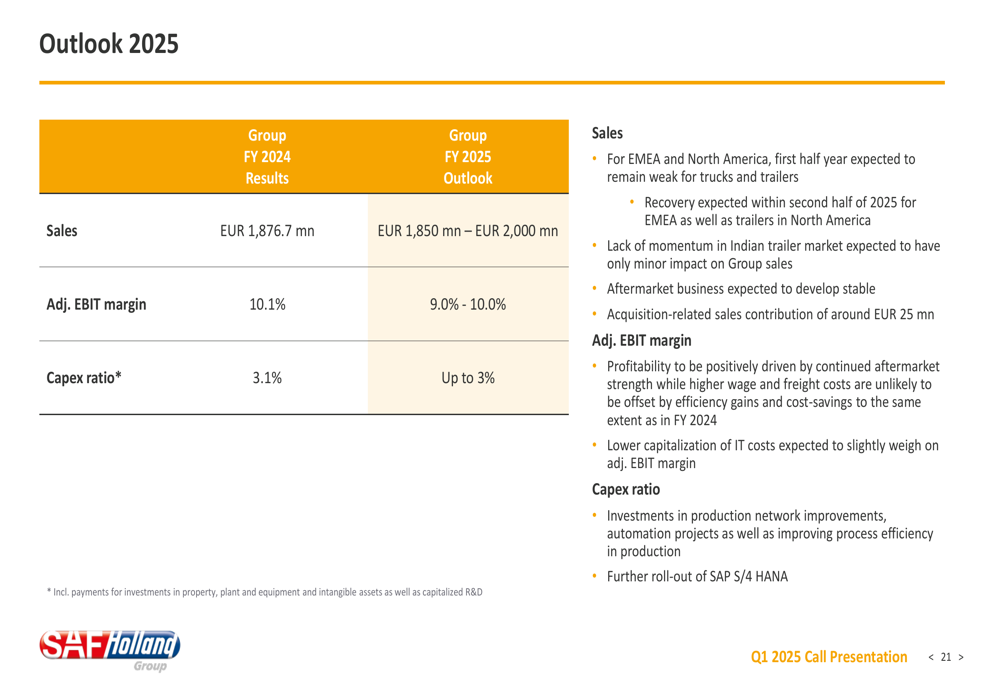
The company expects sales between €1.85 billion and €2.0 billion for the full year, with an adjusted EBIT margin of 9.0-10.0% and a capital expenditure ratio of up to 3%. This outlook reflects management’s confidence in a potential market recovery in the second half of the year, particularly in the trailer segment.
SAF-Holland’s key takeaways from the quarter emphasize its resilience in the current market environment:
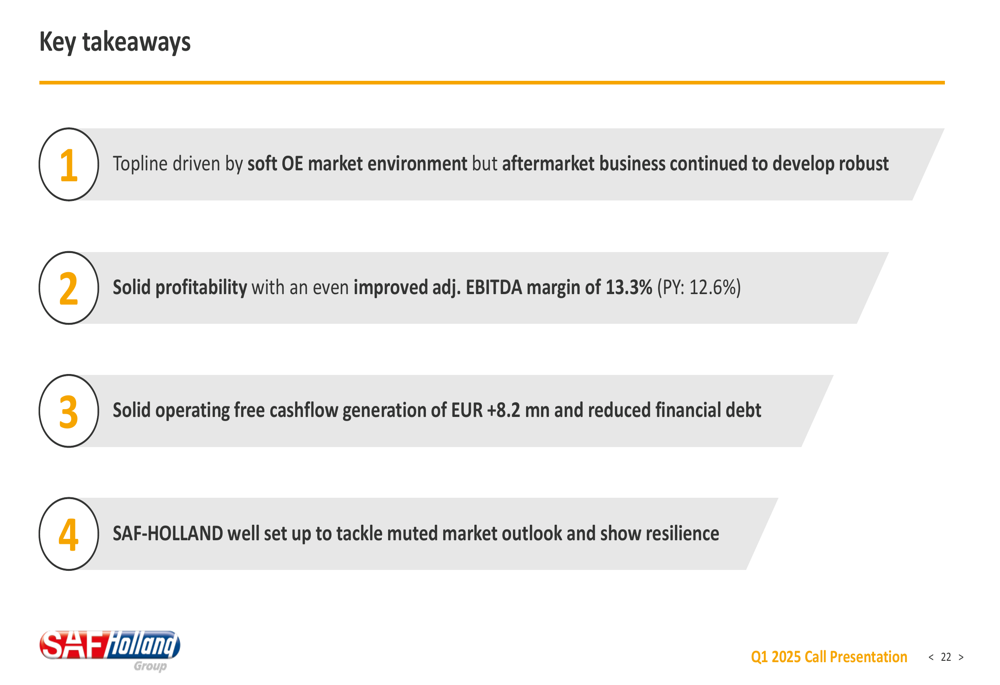
The company highlighted its solid profitability with an improved adjusted EBITDA margin, robust operating free cash flow generation, and reduced financial debt. Management expressed confidence that SAF-Holland is well-positioned to tackle the muted market outlook and demonstrate continued resilience.
With a stable leverage ratio of 1.9x and an improved equity ratio of 31.2%, SAF-Holland maintains a solid financial foundation to navigate current market challenges while pursuing its long-term strategic objectives.
Full presentation:
This article was generated with the support of AI and reviewed by an editor. For more information see our T&C.