Hansen, Mueller Industries director, sells $105,710 in stock

Introduction & Market Context
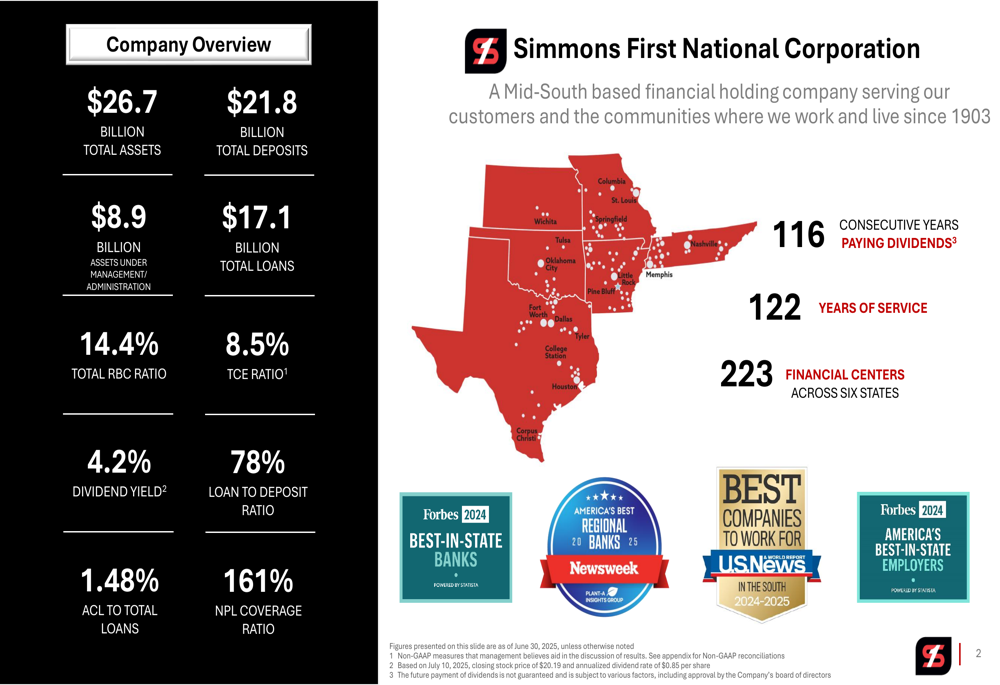
Simmons First National Corporation (NASDAQ:SFNC) released its second quarter 2025 earnings presentation on July 17, highlighting strong net interest margin growth and improved operational efficiency. The regional bank, which operates 223 financial centers across six states, reported total assets of $26.7 billion and has maintained its 116-year dividend payment streak.
The stock closed at $18.93 on October 14, marking a 2.06% increase, though it experienced a slight pre-market dip of 0.95% to $18.75. According to recent analyst coverage, SFNC is trading near its fair value with price targets between $22-24.
As shown in the following company overview, Simmons maintains a strong presence across the south-central United States with a healthy balance sheet and recognition from multiple publications for its service quality:
Quarterly Performance Highlights
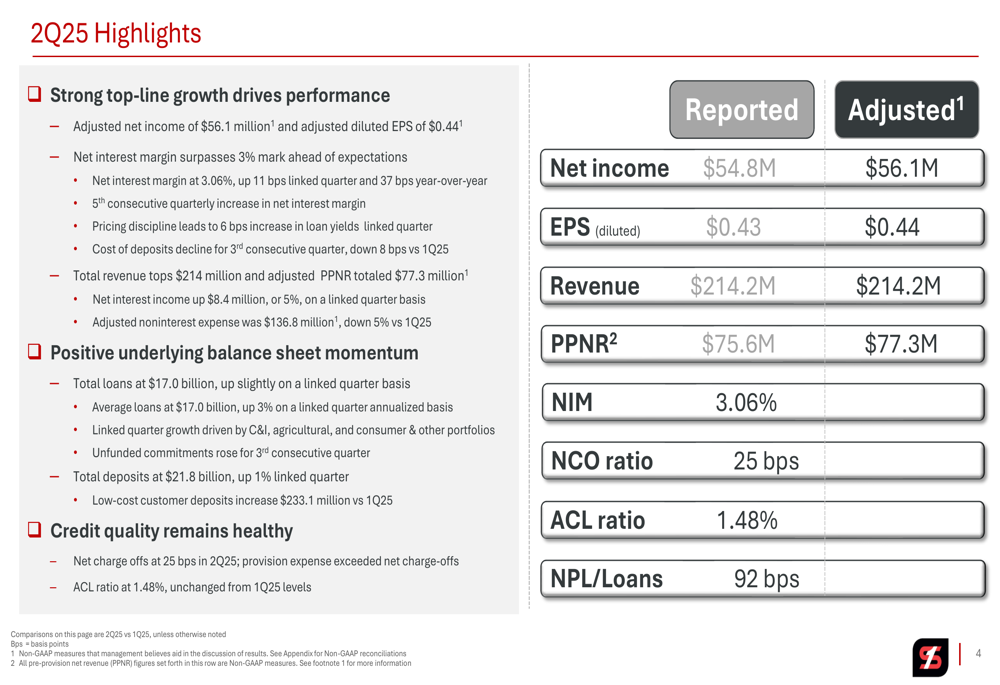
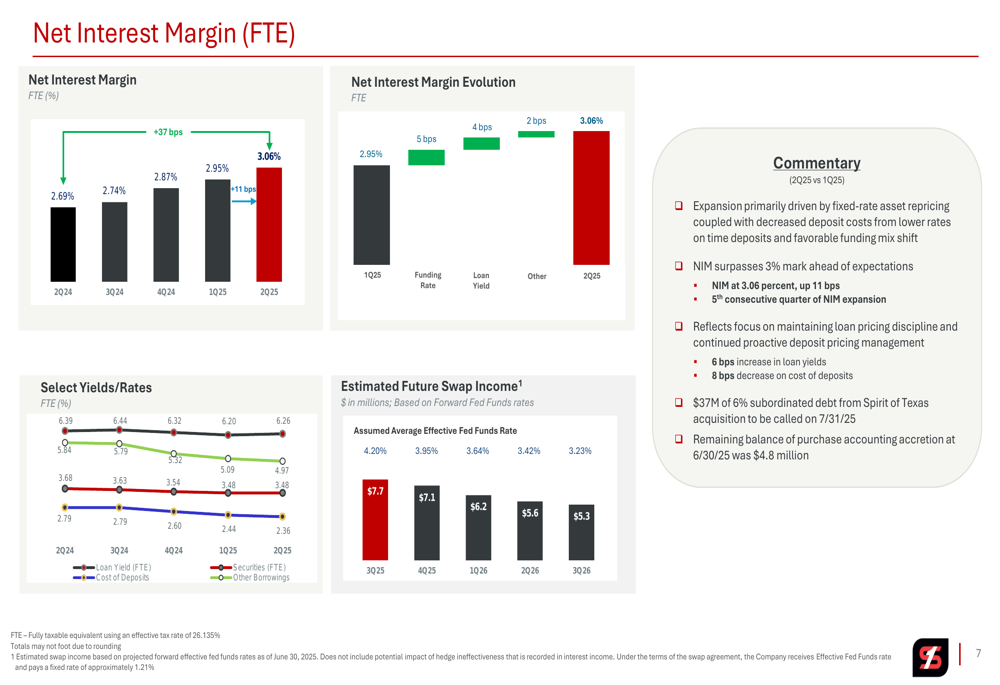
Simmons reported adjusted net income of $56.1 million for Q2 2025, translating to adjusted diluted earnings per share of $0.44. The bank’s net interest margin (NIM) surpassed the 3% mark ahead of expectations, reaching 3.06% - an increase of 11 basis points from the previous quarter and 37 basis points year-over-year.
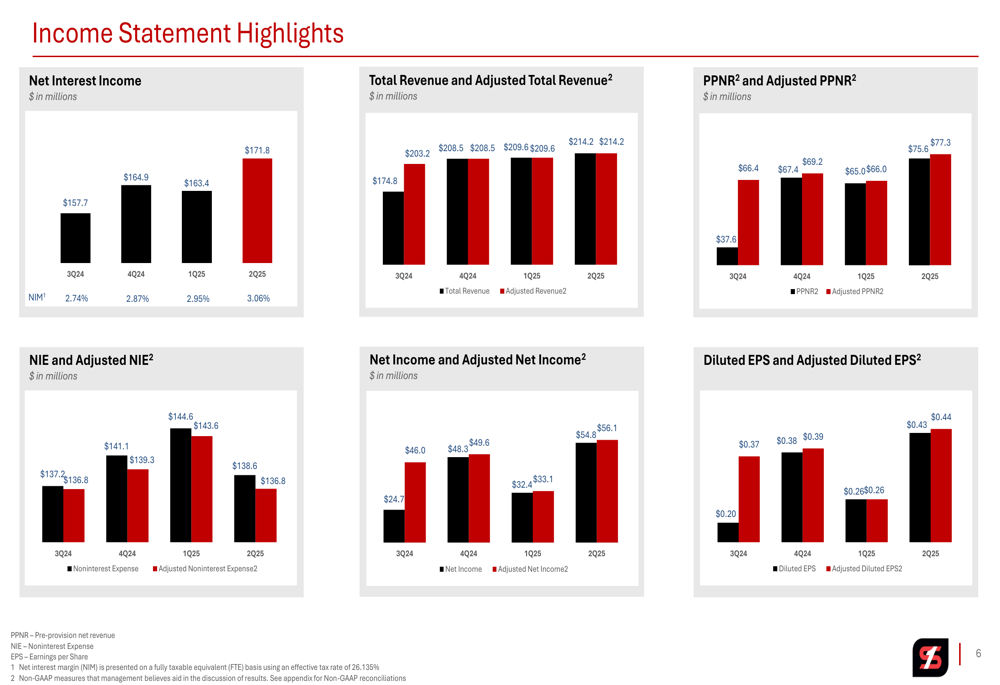
Total revenue exceeded $214 million while adjusted pre-provision net revenue (PPNR) totaled $77.3 million. Net interest income increased by $8.4 million (5%) on a linked-quarter basis, while adjusted noninterest expense decreased to $136.8 million, down 5% compared to Q1 2025.
The following slide details these key performance metrics, showing both reported and adjusted figures:
Detailed Financial Analysis
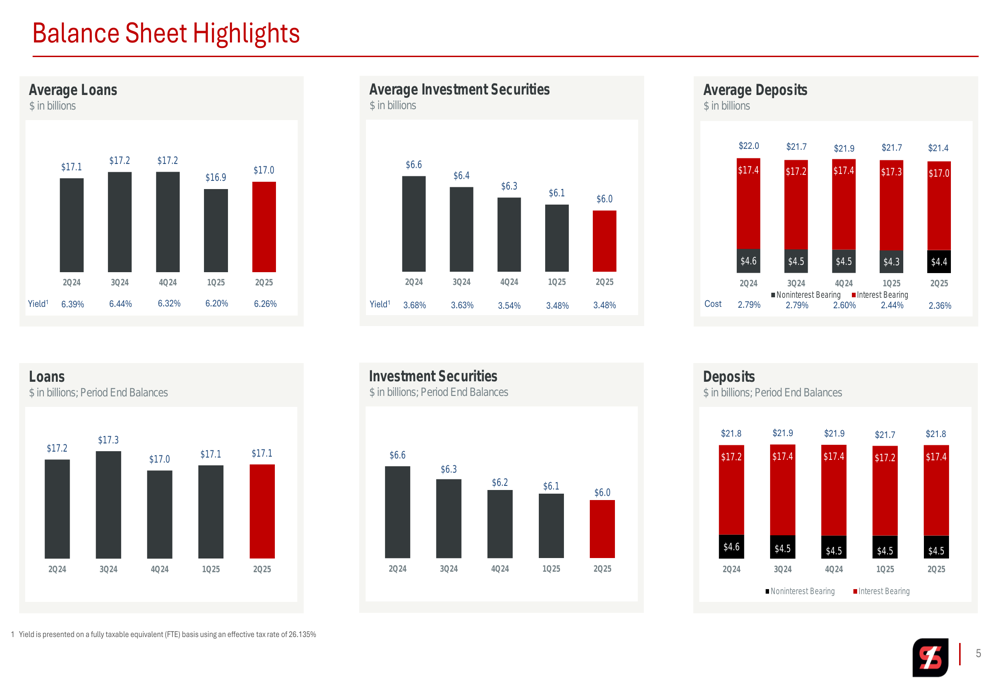
The bank’s balance sheet showed positive momentum with total loans at $17.0 billion, slightly up on a linked-quarter basis. Average loans increased by 3% on an annualized basis compared to the previous quarter. Credit quality remained healthy with net charge-offs at 25 basis points and an allowance for credit losses (ACL) ratio stable at 1.48%.
The following chart illustrates the trends in average loans, investment securities, and deposits over the past five quarters:
Net interest income continued its upward trajectory, reaching $171.8 million in Q2 2025 compared to $164.1 million in Q1 2025 and $157.7 million in Q2 2024. This growth contributed to the improved earnings performance as shown in the income statement highlights:
The net interest margin expansion to 3.06% represents the fifth consecutive quarterly increase, driven primarily by fixed-rate asset repricing and decreasing deposit costs. The bank’s proactive deposit pricing management and loan pricing discipline contributed significantly to this improvement.
As illustrated in the following NIM analysis, the company has projected future swap income based on forward Fed Funds rates, showing expected income of $7.7 million in Q3 2025 declining gradually to $5.3 million by Q3 2026:
Strategic Initiatives
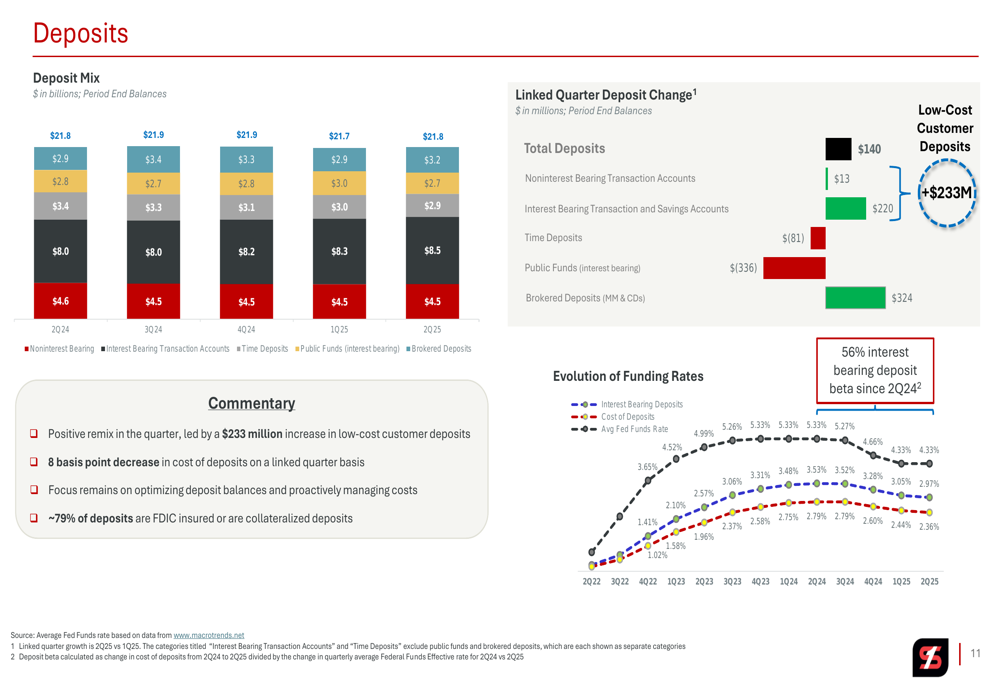
Simmons has focused on optimizing its deposit mix while proactively managing costs. The bank reported a positive remix in Q2, led by a $233 million increase in low-cost customer deposits and an 8 basis point decrease in overall deposit costs. Approximately 79% of deposits are either FDIC insured or collateralized, reflecting a conservative approach to funding.
The deposit strategy is clearly visualized in the following analysis, which shows the evolution of the deposit mix and funding rates:
On the expense side, Simmons implemented an early retirement program and deferred or eliminated certain controllable expenses. The bank also benefited from a $0.7 million recovery of fraud losses. These initiatives contributed to the 5% reduction in adjusted noninterest expenses compared to the previous quarter.
The efficiency ratio improved significantly, decreasing from 65.68% in Q2 2024 to 60.52% in Q2 2025, demonstrating enhanced operational efficiency. Similarly, adjusted noninterest expense as a percentage of total average assets decreased from 2.18% to 2.00% year-over-year.
Forward-Looking Statements
In line with statements from the earnings call, Simmons First National remains optimistic about achieving its performance targets. President Jay Brogdon expressed satisfaction with ongoing business trends, while Chairman and CEO George A. Makris highlighted the team’s discipline as demonstrated in the results.
The company’s securities portfolio strategy aims to maintain earning assets in the mid-teens, with a current mix of 40% Treasury/Agency securities, 44% in states and political subdivisions, and 8% each in MBS/CMO and corporate securities. This conservative approach supports the bank’s liquidity position while providing a stable yield.
The bank faces some challenges, including competitive loan pricing that may affect margins and elevated loan payoffs, particularly in construction lending. Additionally, seasonal variations in agricultural lending could impact growth in certain quarters.
Despite these challenges, Simmons’ strong capital position with a total risk-based capital ratio of 14.4% and tangible common equity ratio of 8.5% positions the bank well for potential growth opportunities in late 2025 and 2026, particularly if interest rates decline as expected.
Full presentation:
This article was generated with the support of AI and reviewed by an editor. For more information see our T&C.