Joby Aviation closes $591 million stock offering with full underwriter option

Introduction & Market Context
The Joint Corp (NASDAQ:JYNT) presented its Q1 2025 financial results on May 8, 2025, highlighting a continued shift toward a franchise-dominant business model while reporting mixed financial performance. The chiropractic care provider saw modest revenue growth but faced challenges with profitability as it implements strategic initiatives aimed at strengthening its core business.
The company’s stock has shown volatility in recent trading, with shares closing at $9.94 before the presentation and rising 6.54% to $10.53 during the session, reflecting investor reaction to the quarterly results and forward guidance.
Quarterly Performance Highlights
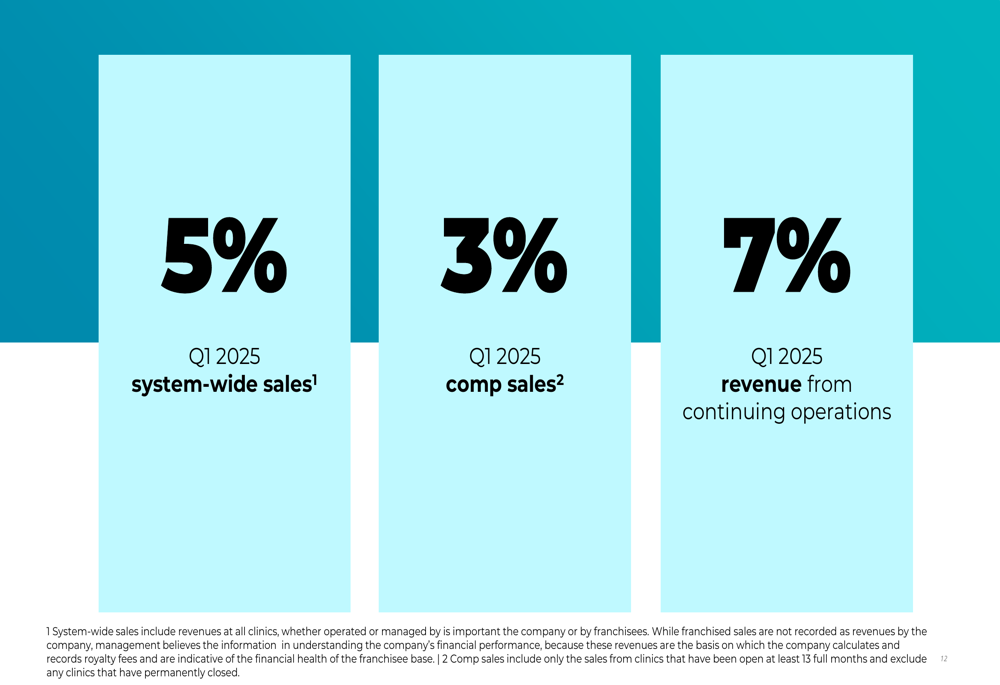
The Joint reported system-wide sales growth of 5% and comparable sales growth of 3% for Q1 2025, with revenue from continuing operations increasing by 7% compared to the same period last year.
As shown in the following financial highlights chart:
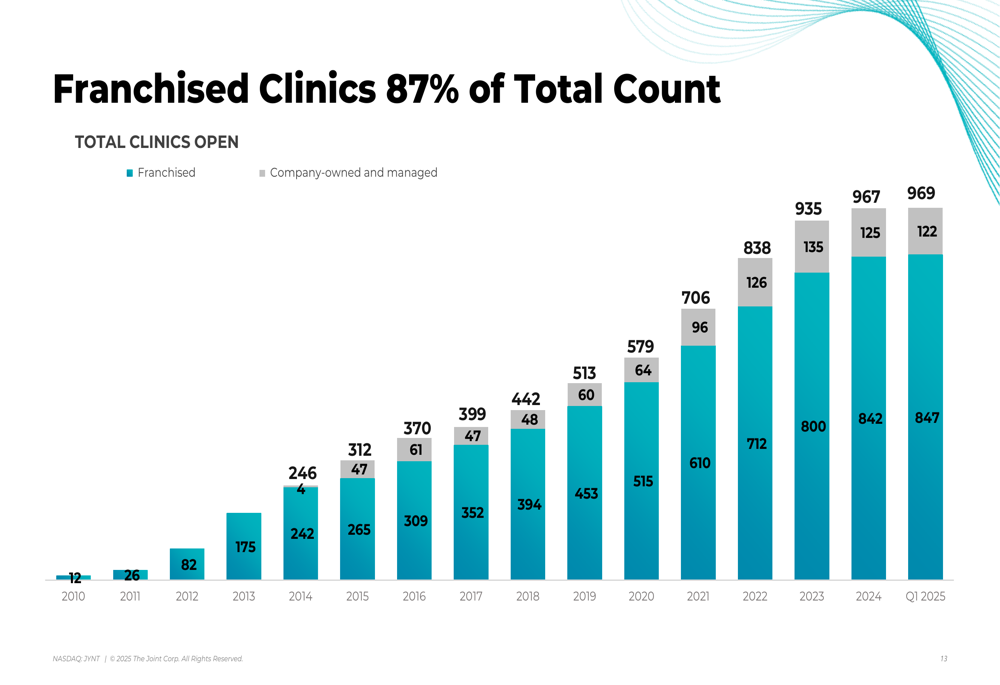
The company’s clinic network continued to expand, reaching a total of 969 clinics by the end of Q1 2025, with franchised locations comprising 87% of the total count. This represents a significant evolution from the company’s position in 2010 when it had just 12 franchised clinics.
The following chart illustrates The Joint’s clinic growth trajectory and increasing franchise dominance:
Detailed Financial Analysis
The Joint’s Q1 2025 financial results showed revenue growth but declining profitability metrics compared to the same period last year. Revenue increased to $13.1 million, up 7% from $12.2 million in Q1 2024, while the company reported a net loss from continuing operations of $0.5 million compared to a $0.4 million loss in the prior year.
The detailed financial breakdown reveals several key trends:
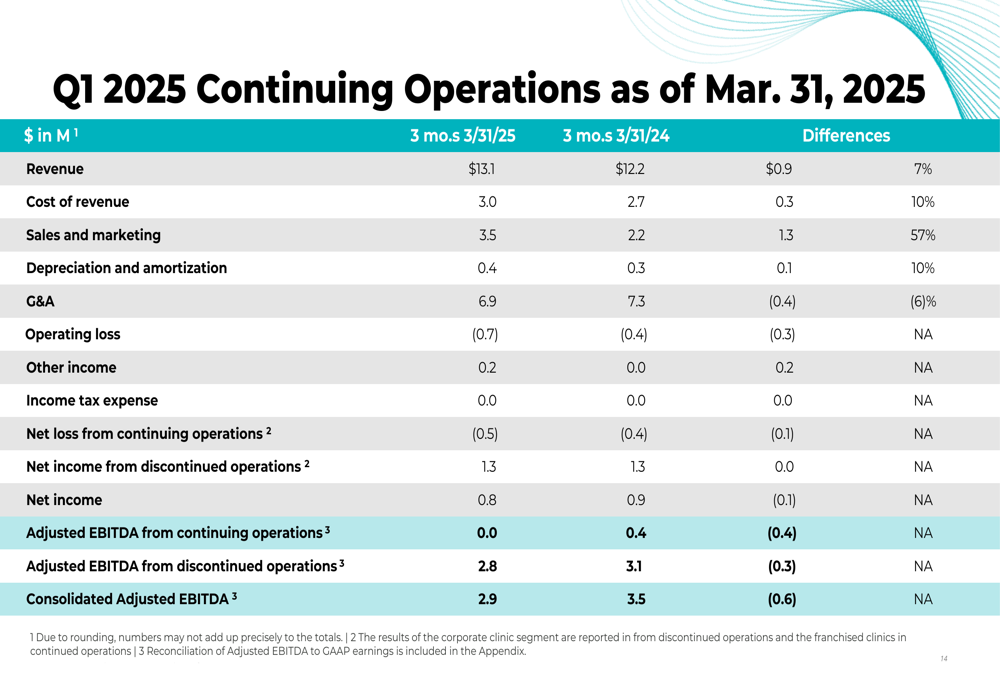
Notably, sales and marketing expenses increased significantly by 57% to $3.5 million, reflecting the company’s investment in growth initiatives. Meanwhile, general and administrative expenses decreased by 6% to $6.9 million, demonstrating efforts to control overhead costs.
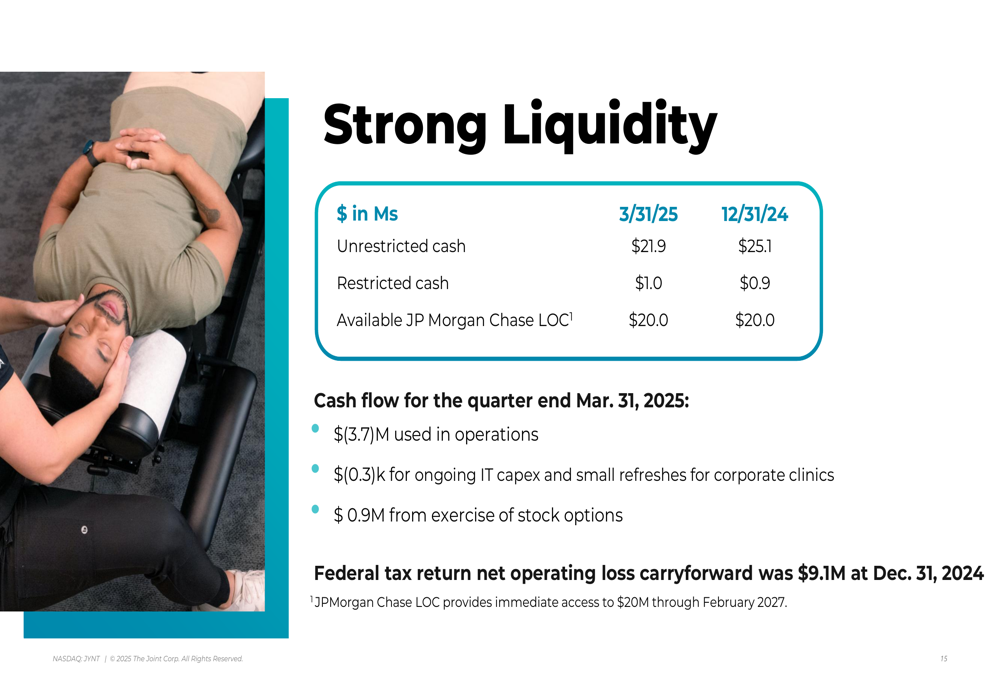
The company maintained a strong liquidity position with $21.9 million in unrestricted cash as of March 31, 2025, though this represents a decrease from $25.1 million at the end of 2024. The Joint also has access to a $20 million credit line through February 2027.
This financial performance follows a mixed Q4 2024, when the company reported earnings per share of $0.06 against a forecast of $0.01, while revenue totaled $14.45 million, below analyst expectations of $28.99 million.
Strategic Initiatives
CEO Sanjiv Razdan outlined The Joint’s multi-year strategic approach, which is currently focused on Phase 2.0: "Strengthen Core & Become Pure Play Franchisor," with plans to eventually move to Phase 3.0: "Capture New Revenue through Additional Channels & Markets."
The company is implementing several key initiatives to drive growth and improve clinic economics:
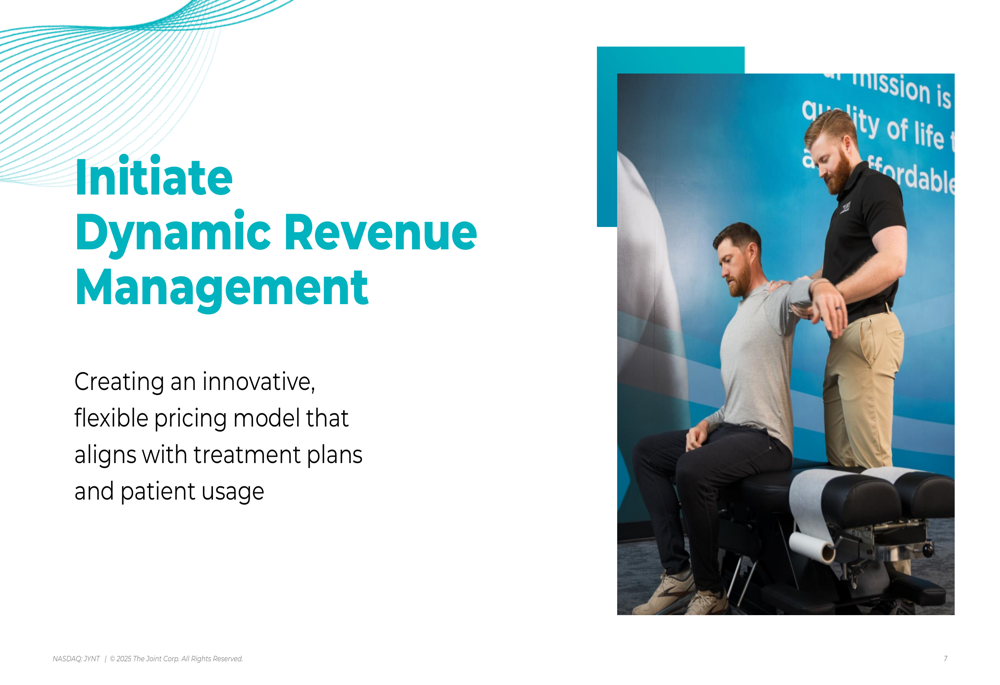
1. Dynamic Revenue Management: Creating a flexible pricing model aligned with treatment plans and patient usage patterns.
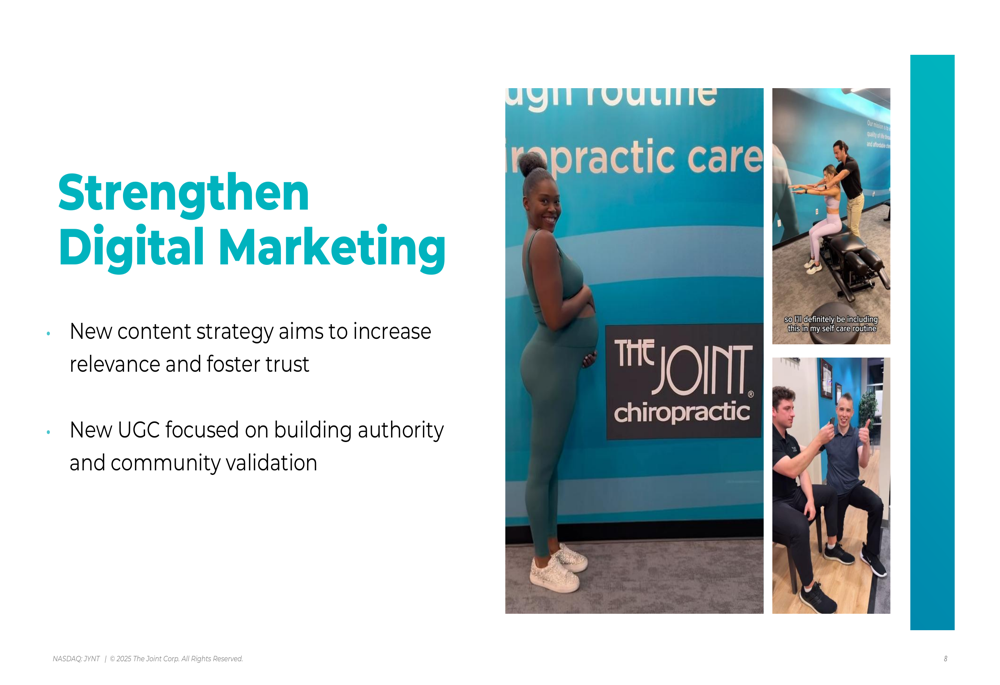
2. Enhanced Digital Marketing: Implementing a new content strategy focused on building authority and community validation.
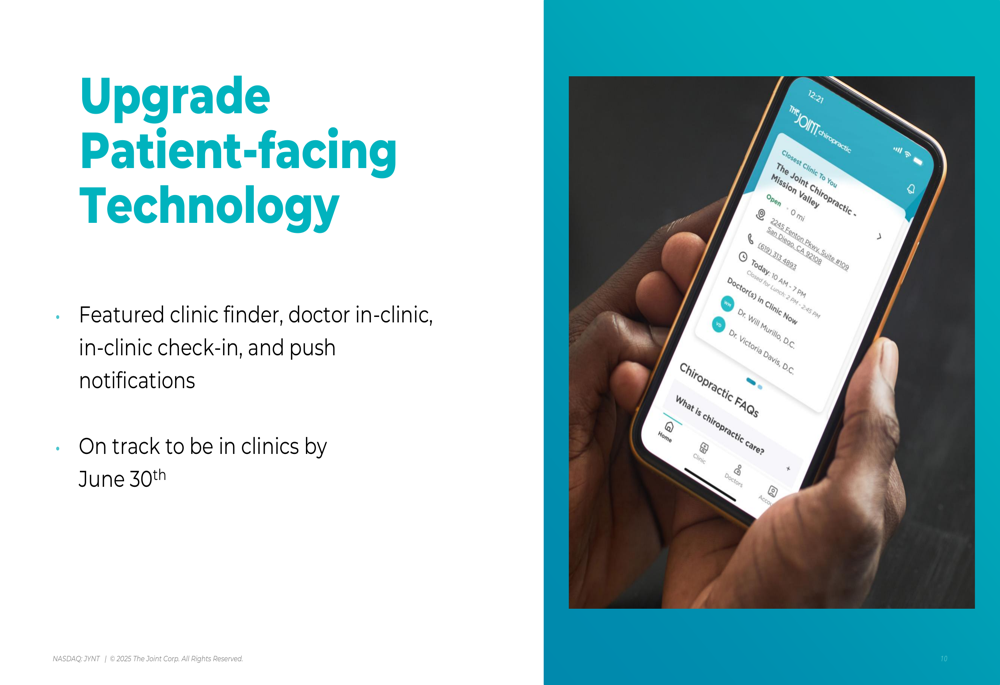
3. Upgraded Patient-facing Technology: Launching new app features including clinic finder, doctor in-clinic information, in-clinic check-in, and push notifications, scheduled for rollout by June 30th.
4. Strengthened Promotional Calendar: Implementing targeted promotions including February’s "Step into Wellness" and June’s "Buy 5, Get 1" Wellness Sale.
Forward-Looking Statements
The Joint reiterated its 2025 guidance, projecting system-wide sales between $550 million and $570 million, up from $530.3 million in 2024. The company expects mid-single-digit comparable sales growth and consolidated adjusted EBITDA between $10.0 million and $11.5 million.
The detailed guidance is presented in the following chart:
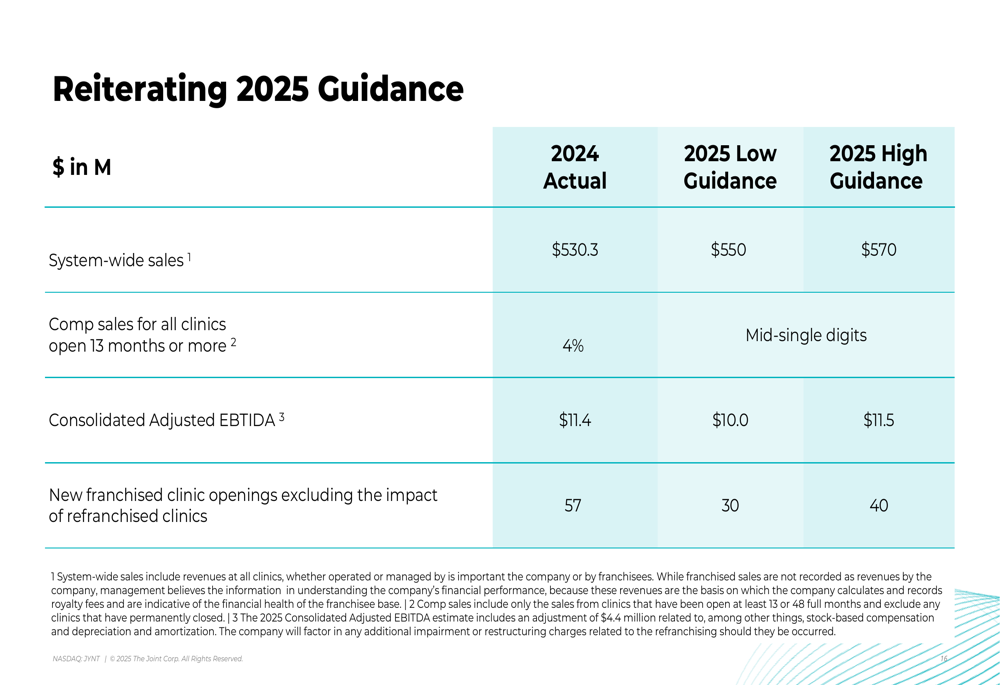
The company also projects 30-40 new franchised clinic openings in 2025, excluding refranchised clinics, which represents a decrease from the 57 new franchised clinics opened in 2024.
CFO Jake Singleton emphasized the company’s strong liquidity position and operational focus, noting that cash flow for Q1 2025 included $3.7 million used in operations and $0.9 million from the exercise of stock options.
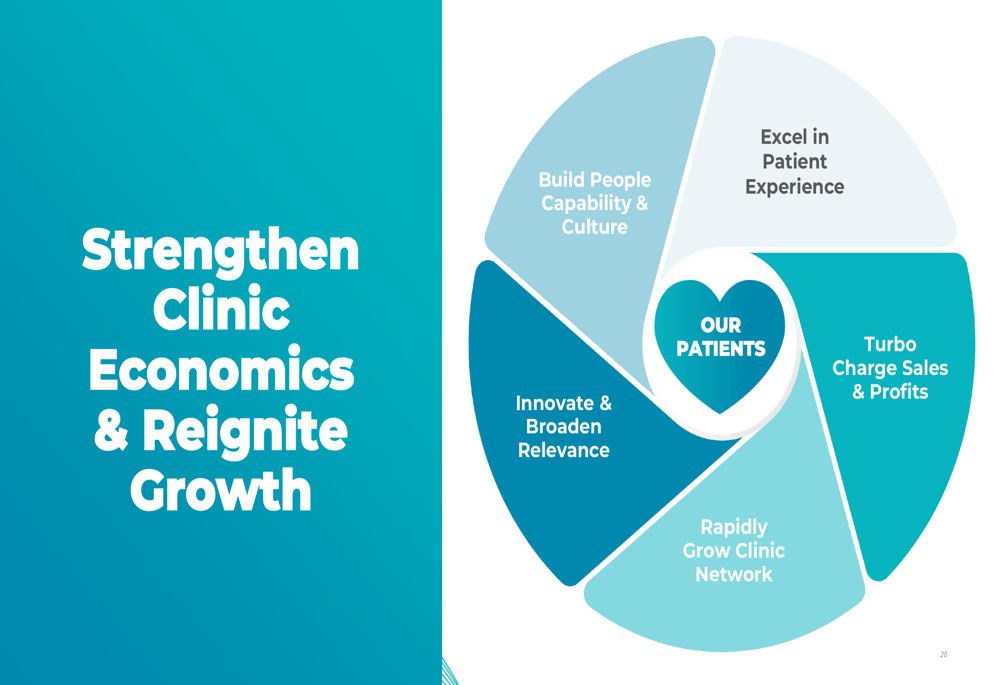
The Joint’s strategy continues to center on strengthening clinic economics and reigniting growth through five key pillars: building people capability and culture, innovating and broadening relevance, excelling in patient experience, driving sales and profits, and rapidly growing the clinic network.
As The Joint progresses with its transition toward a pure franchise model, investors will be watching closely to see if strategic initiatives translate into improved financial performance in the coming quarters.
Full presentation:
This article was generated with the support of AI and reviewed by an editor. For more information see our T&C.