Nvidia and TSMC to unveil first domestic wafer for Blackwell chips, Axios reports

Introduction & Market Context
Trinity Capital Inc (NASDAQ:TRIN), an internally managed business development company (BDC), released its second quarter 2025 investor presentation on August 6, 2025, revealing improved financial performance following a disappointing first quarter. The presentation highlights the company’s continued expansion of its diversified lending platform, which focuses on providing financial solutions to growth-stage companies across multiple verticals.
In premarket trading, Trinity Capital shares rose 2.51% to $15.50, indicating positive investor reaction to the results, a notable contrast to the 0.99% decline following the company’s Q1 earnings miss.
The company’s Q2 performance demonstrates a recovery from its Q1 challenges, when it reported earnings per share of $0.43 against expectations of $0.52, and revenue of $65.4 million versus forecasts of $67.46 million.
Quarterly Performance Highlights
Trinity Capital reported strong financial results for Q2 2025, with total investment income reaching $69.5 million, net investment income (NII) of $34.8 million, and a net interest margin of 11.7%. The company’s NII per share was $0.53, representing an improvement from $0.52 in Q1 2025 and providing 103.9% coverage of its regular dividend.
As shown in the following quarterly highlights summary:
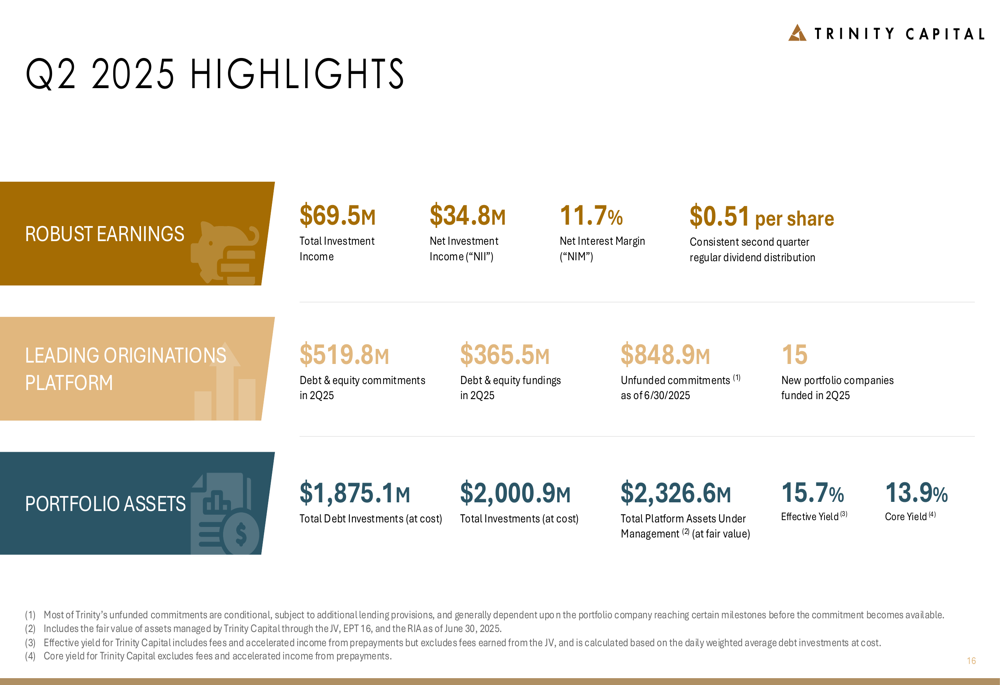
The company demonstrated robust origination activity, with $519.8 million in debt and equity commitments and $365.5 million in fundings during the quarter. Trinity added 15 new portfolio companies, bringing its total debt investments to $1.88 billion at cost, with total platform assets under management reaching $2.33 billion.
The quarterly income statement reveals consistent improvement in financial performance compared to previous quarters:
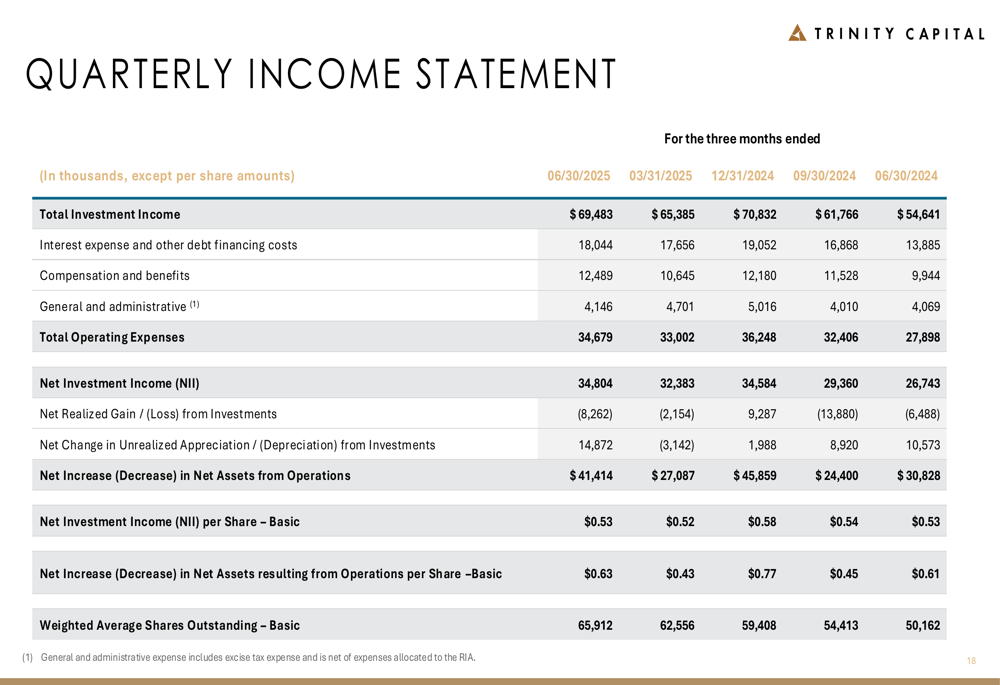
Total (EPA:TTEF) investment income increased to $69.5 million in Q2 2025 from $65.4 million in Q1 2025, representing a 6.3% sequential increase and a 27.2% year-over-year growth compared to Q2 2024’s $54.6 million. Net investment income per share on a basic basis improved to $0.53 from $0.52 in the previous quarter.
Portfolio Strategy & Diversification
Trinity Capital’s investment strategy focuses on diversification across multiple dimensions, including investment type, transaction size, industry, and geography. This approach has helped the company maintain portfolio resilience amid market fluctuations.
The following chart illustrates the company’s diversified portfolio composition:
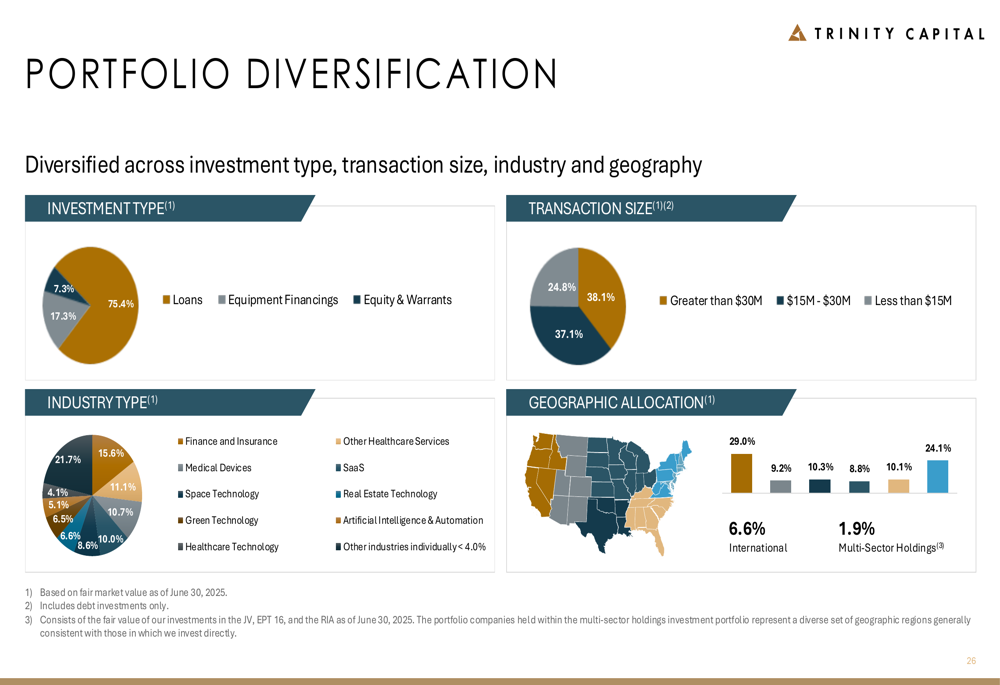
As of June 30, 2025, loans represented 75.4% of the portfolio, with equity and warrants accounting for 17.3% and equipment financings making up 7.3%. The company maintains a balanced approach to transaction sizes, with 37.1% of deals under $15 million, 38.1% between $15-30 million, and 24.8% exceeding $30 million.
Industry diversification shows particular strength in finance and insurance (21.7%), medical devices (15.6%), space technology (11.1%), green technology (10.7%), and healthcare technology (10.0%), with no other individual sector exceeding 4% of the portfolio.
The company has also demonstrated improved credit quality in its portfolio:
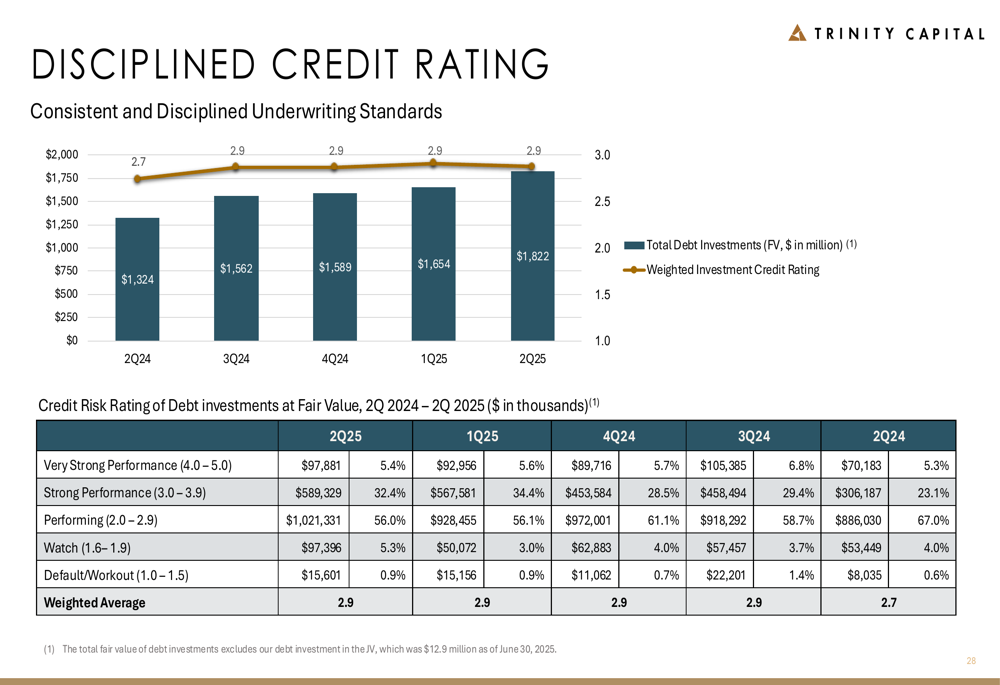
The weighted average credit rating improved from 2.9 in Q1 2025 to 2.7 in Q2 2025, indicating stronger overall credit quality. The percentage of investments rated as "Performing" increased, while those categorized as "Watch" or "Default/Workout" decreased, reflecting Trinity’s disciplined underwriting approach that has maintained an annualized loss rate of just 22 basis points.
Dividend Performance & Shareholder Returns
Trinity Capital has maintained a consistent record of shareholder returns, delivering its 22nd consecutive consistent or increased regular dividend. The company’s dividend history shows steady growth since its inception:
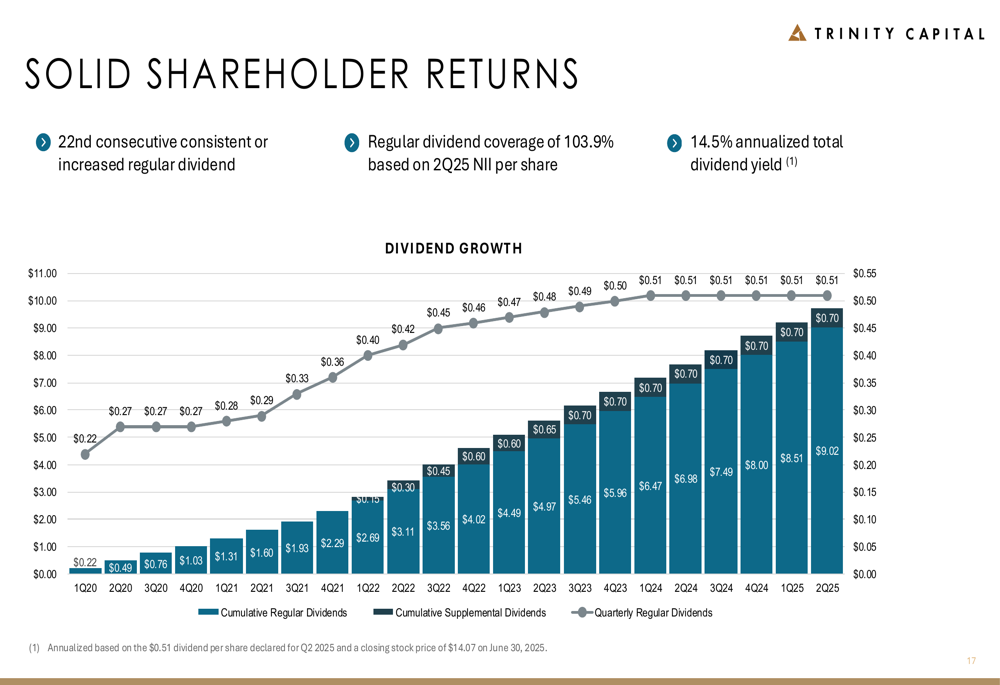
The regular dividend has grown from $0.22 per share in Q1 2020 to $0.51 in Q2 2025, supplemented by additional special dividends in several quarters. The current annualized dividend yield stands at an attractive 14.5%, positioning Trinity among the higher-yielding BDCs in the market.
The company’s ability to maintain and grow its dividend is supported by strong returns on assets and equity:
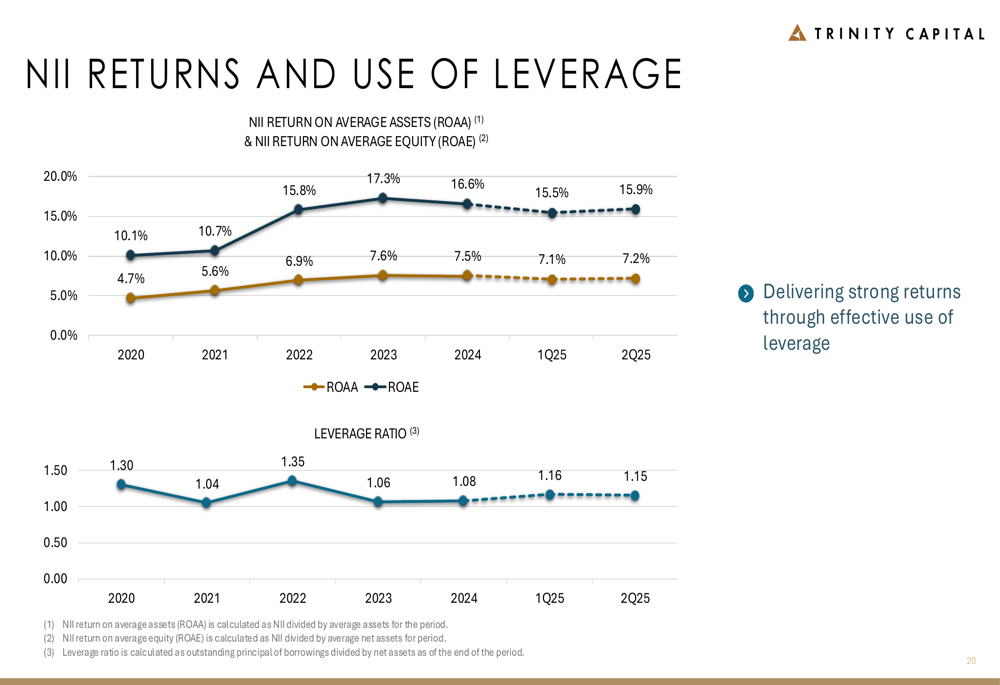
Trinity has consistently generated NII returns on average assets (ROAA) between 4.7% and 7.2%, while maintaining a prudent leverage ratio that has decreased from 1.30 in 2020 to 1.15 as of Q2 2025.
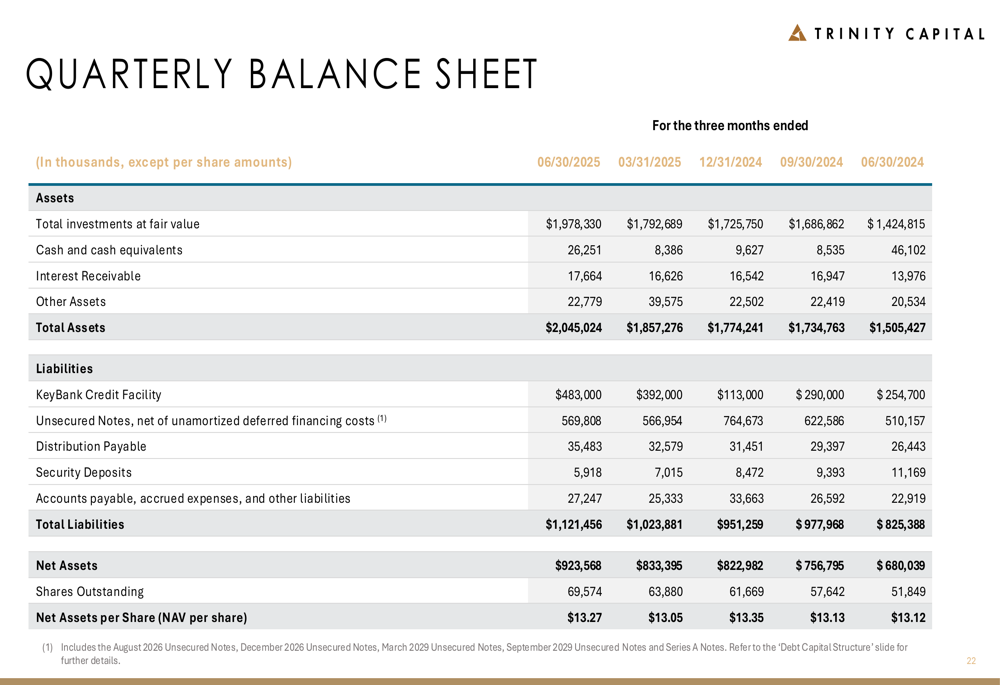
Financial Position & Outlook
Trinity Capital’s balance sheet strengthened during Q2 2025, with net assets increasing to $923.6 million from $833.4 million in Q1 2025. The net asset value (NAV) per share improved to $13.27 from $13.05 in the previous quarter:
The improvement in NAV per share can be attributed to several factors, as illustrated in the following bridge analysis:
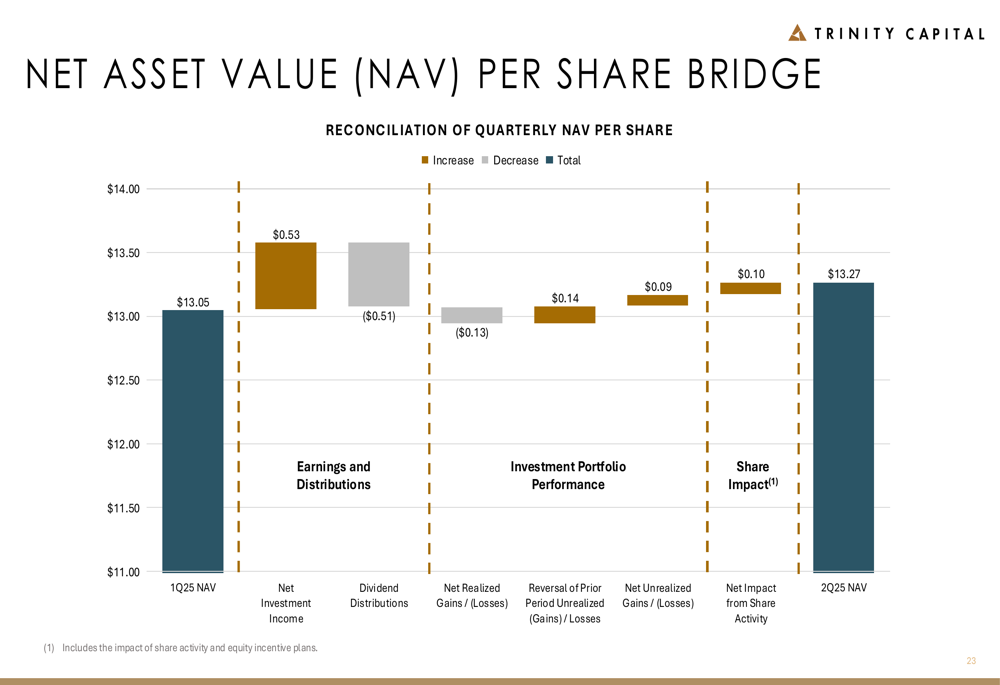
Net investment income contributed $0.53 per share, partially offset by dividend distributions of $0.51 per share. Net realized losses of $0.13 per share were more than compensated for by reversals of prior period unrealized losses ($0.14) and net unrealized gains ($0.09), while share activity added $0.10 to NAV per share.
The company maintains a diversified debt capital structure with staggered maturities:
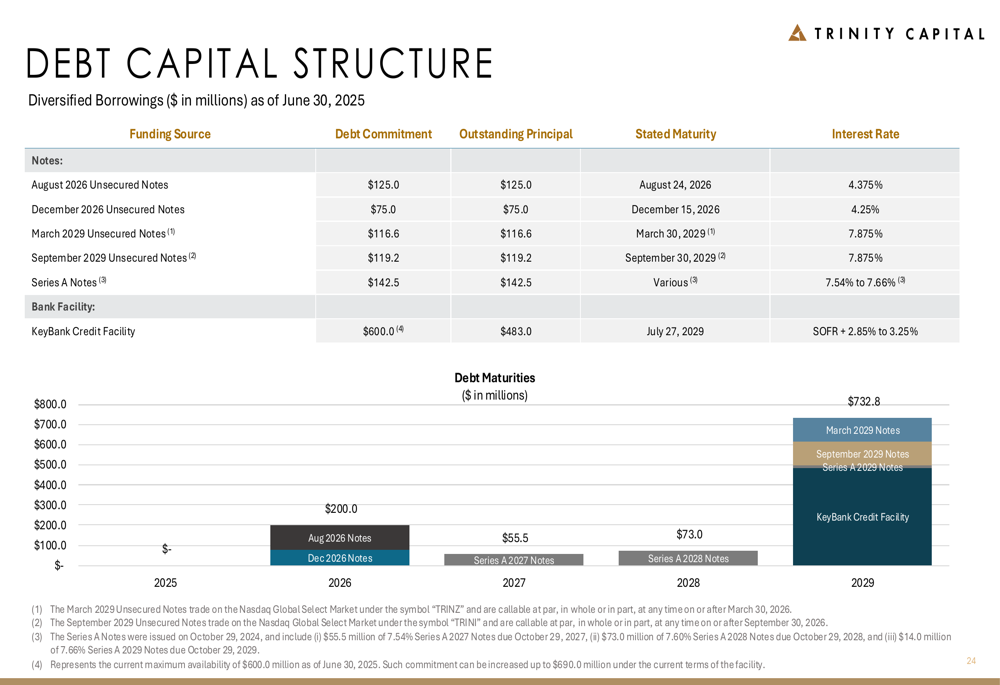
With $143.3 million in available liquidity and investment-grade ratings from major agencies (BBB, BBB(low), and Baa3), Trinity is well-positioned to continue its growth trajectory. The company’s interest rate positioning is also favorable, with 80% of its debt investment portfolio in floating rate instruments while only 45.5% of its borrowings are floating rate, creating a positive impact from the current interest rate environment.
Strategic Initiatives
Trinity Capital continues to expand its platform through complementary verticals that provide diversified revenue streams. The company’s internally managed structure aligns employee interests with shareholders and provides full ownership and control of the deal pipeline.
The Trinity platform has evolved to include multiple entities that enhance shareholder value:
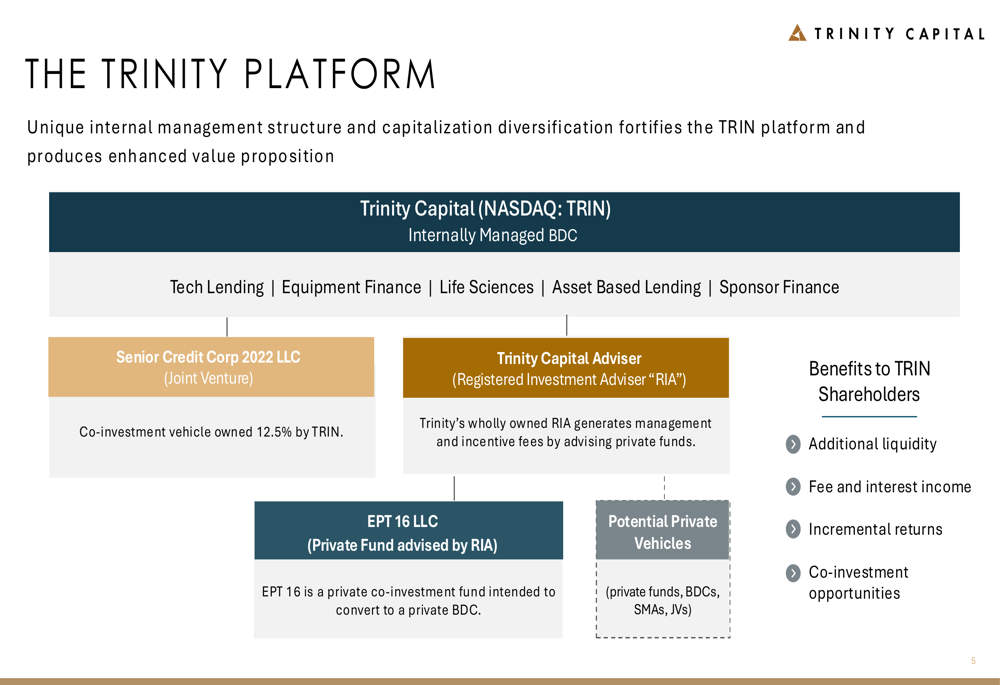
This structure provides additional liquidity, fee and interest income, incremental returns, and co-investment opportunities for TRIN shareholders. The company’s five core verticals – Tech Lending, Equipment Finance, Life Sciences, Asset Based Lending, and Sponsor Finance – enable it to address diverse market opportunities while maintaining a disciplined approach to risk management.
Looking ahead, Trinity Capital appears well-positioned to capitalize on growth opportunities in the venture debt market while maintaining its focus on portfolio quality and shareholder returns. The company’s recovery from its Q1 earnings miss demonstrates resilience and adaptability in a challenging market environment.
Full presentation:
This article was generated with the support of AI and reviewed by an editor. For more information see our T&C.