Domino’s Pizza Australia surges on report Bain Capital exploring $2.6 bln buyout

Introduction & Market Context
Vishay Precision Group Inc (NYSE:VPG) presented its second quarter 2025 earnings results on August 5, 2025, showing a significant sequential improvement after a disappointing first quarter. The precision measurement technology company reported revenue growth across two of its three business segments, with overall orders increasing by 7.5% compared to the previous quarter.
The company’s performance comes amid a challenging macroeconomic environment, but shows signs of recovery with improved profitability metrics and a positive book-to-bill ratio. VPG’s stock closed at $26.07 on August 4, 2025, up 1.05% ahead of the earnings presentation, and has been trading between $18.57 and $31.20 over the past 52 weeks.
Quarterly Performance Highlights
VPG reported second quarter revenue of $75.2 million, representing a 4.8% sequential increase from the $71.7 million reported in the first quarter of 2025. This improvement marks a reversal from the declining trend seen in previous quarters. Orders also showed strong momentum, reaching $79.9 million, a 7.5% increase from Q1 2025, resulting in a book-to-bill ratio of 1.06.
As shown in the following chart of consolidated revenue and bookings:
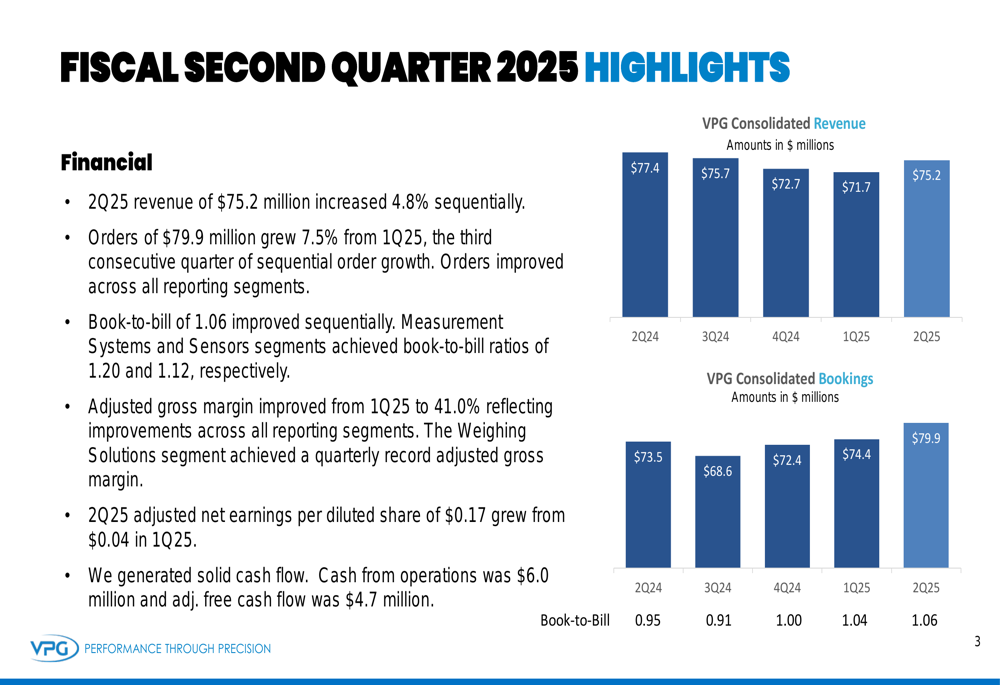
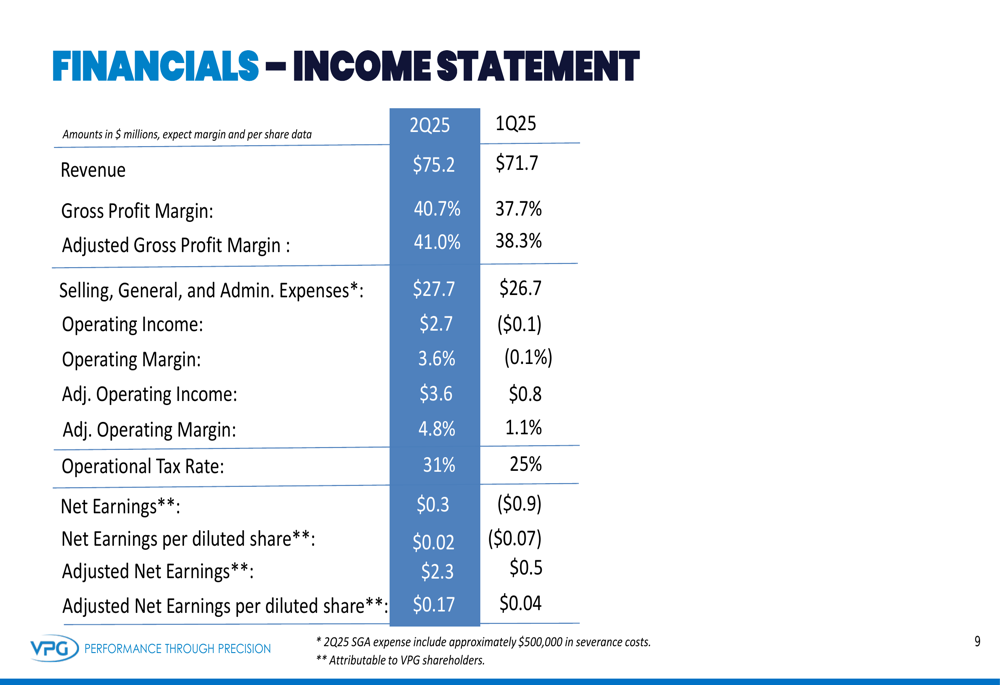
The company’s profitability metrics showed substantial improvement, with adjusted gross margin expanding to 41.0% from 38.3% in the previous quarter. Adjusted operating income increased to $3.6 million from $0.8 million in Q1, resulting in an adjusted operating margin of 4.8% compared to 1.1% in the first quarter.
Adjusted net earnings per diluted share grew to $0.17, a significant improvement from $0.04 in Q1 2025, reflecting the company’s enhanced operational efficiency and higher sales volume. This represents a substantial recovery from the earnings miss reported in the previous quarter, when VPG fell short of analyst expectations with EPS of $0.04 against a forecast of $0.1802.
The detailed income statement comparison between Q2 and Q1 2025 illustrates the extent of the financial improvement:
Segment Analysis
VPG’s performance varied across its three business segments, with two showing sequential revenue growth while one experienced a slight decline.
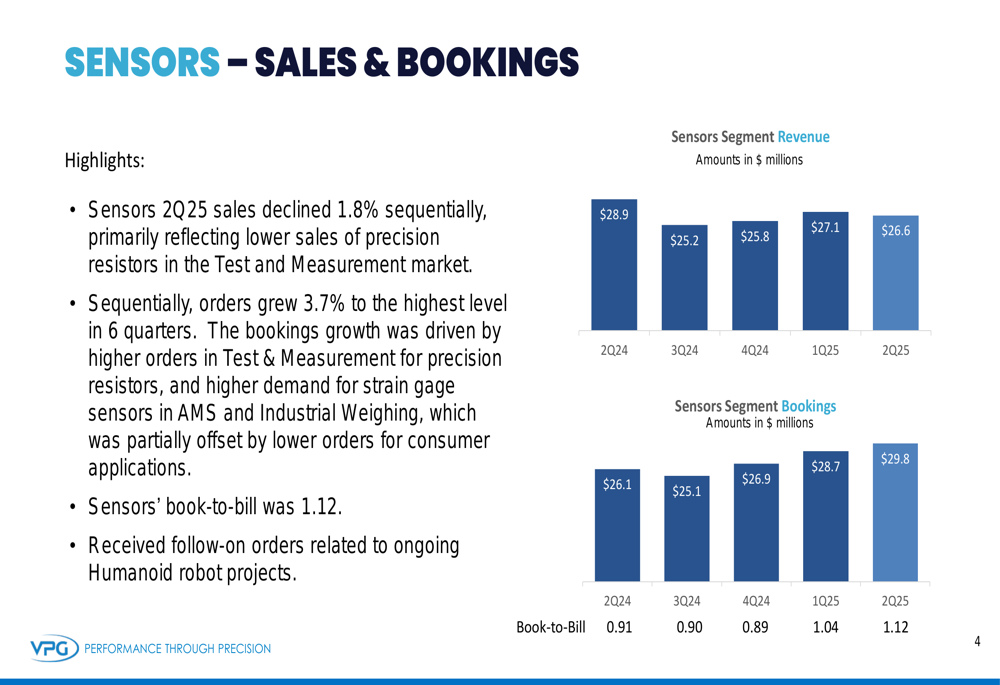
The Sensors segment, which includes precision resistors and strain gauge sensors, saw a 1.8% sequential decline in sales to $26.6 million, primarily due to lower sales of precision resistors in the Test and Measurement market. However, orders grew 3.7% sequentially to $29.8 million, resulting in a book-to-bill ratio of 1.12, the highest in six quarters. The company also highlighted follow-on orders for ongoing humanoid robot projects, indicating potential growth opportunities in this emerging market.
The Sensors segment performance is illustrated in the following chart:
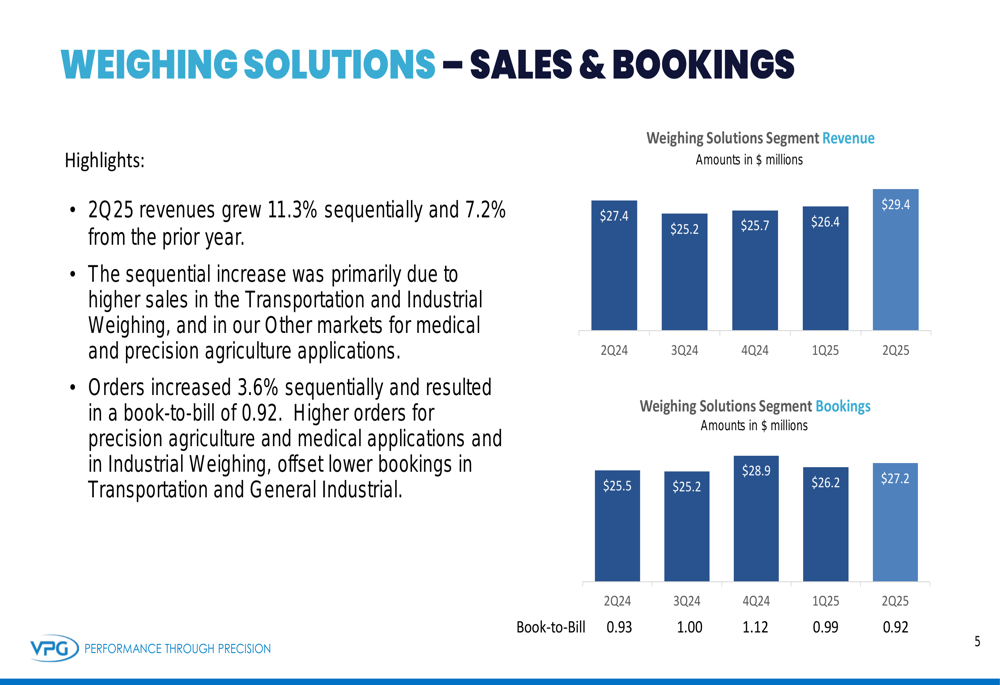
The Weighing Solutions segment delivered the strongest performance, with revenues growing 11.3% sequentially and 7.2% year-over-year to $29.4 million. This growth was primarily driven by higher sales in Transportation and Industrial Weighing, as well as in medical and precision agriculture applications. Orders increased 3.6% sequentially to $27.2 million, resulting in a book-to-bill ratio of 0.92.
The following chart shows the Weighing Solutions segment’s revenue and bookings trends:
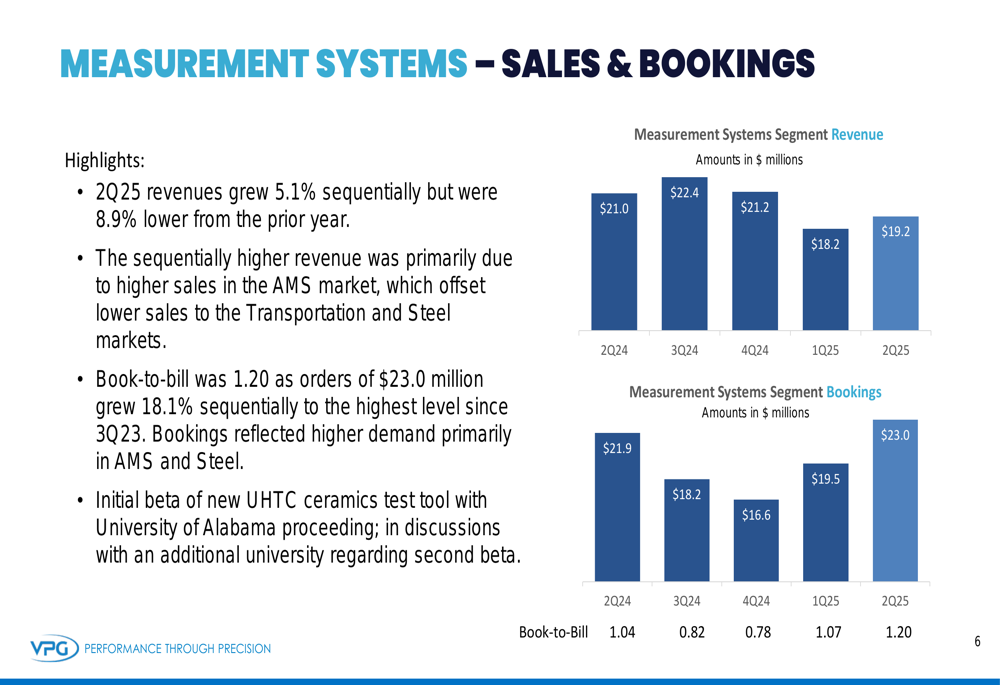
The Measurement Systems segment saw revenues grow 5.1% sequentially to $19.2 million, though this was 8.9% lower than the prior year. The sequential increase was mainly attributed to higher sales in the Avionic, Military & Space ( AMS (VIE:AMS2)) market. Orders grew 18.1% sequentially to $23.0 million, resulting in a strong book-to-bill ratio of 1.20, suggesting potential future growth for this segment.
The Measurement Systems segment performance is illustrated below:
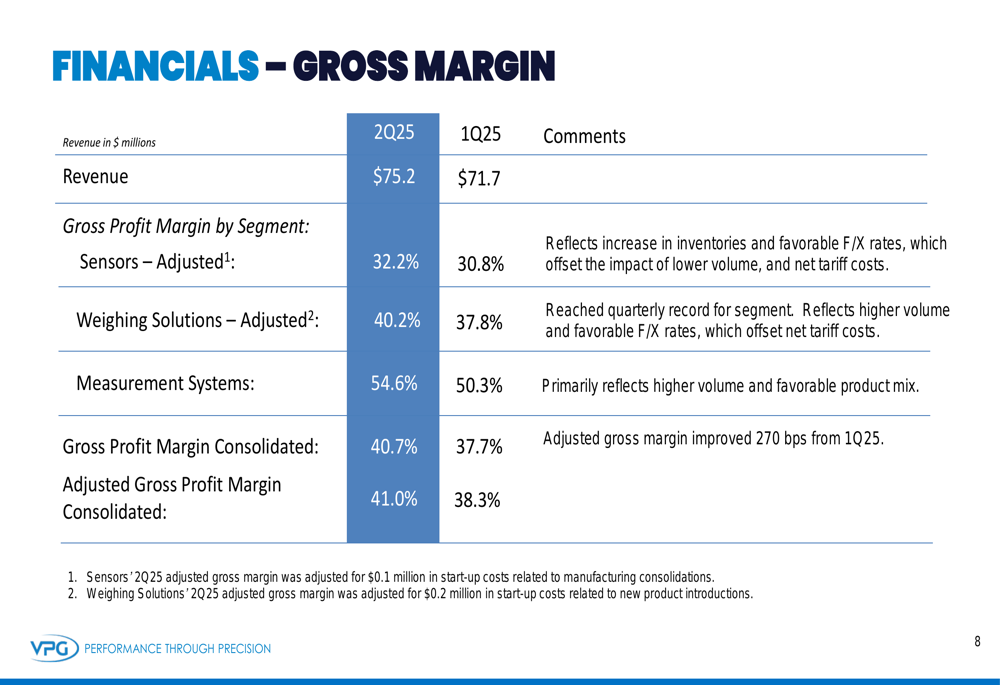
Gross margin improved across all segments, with Weighing Solutions achieving a record quarterly adjusted gross margin of 40.2%, up from 37.8% in Q1. The Measurement Systems segment continued to deliver the highest margins at 54.6%, up from 50.3% in the previous quarter, while the Sensors segment improved to 32.2% from 30.8%.
The following table provides a detailed breakdown of gross margin by segment:
Financial Position and Outlook
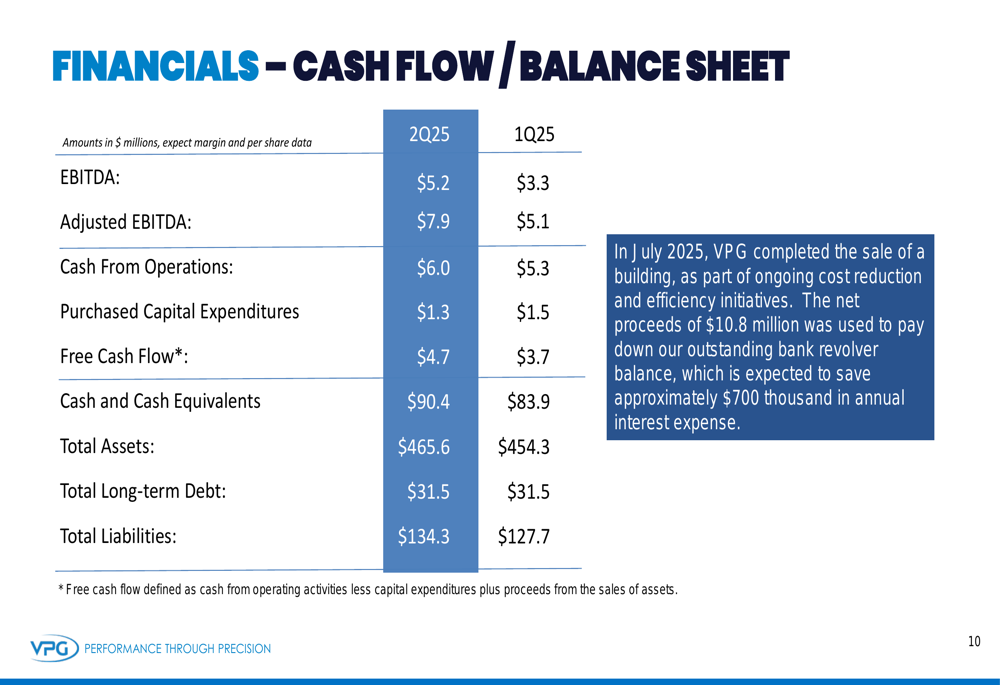
VPG maintained a strong financial position, with cash and cash equivalents increasing to $90.4 million from $83.9 million in the previous quarter. The company generated $6.0 million in cash from operations and $4.7 million in adjusted free cash flow during the quarter, demonstrating solid cash generation capabilities.
Total (EPA:TTEF) long-term debt remained stable at $31.5 million, giving the company a net cash position of approximately $58.9 million. This strong balance sheet provides VPG with financial flexibility to pursue strategic initiatives, including potential acquisitions.
The company’s cash flow and balance sheet metrics are detailed in the following table:
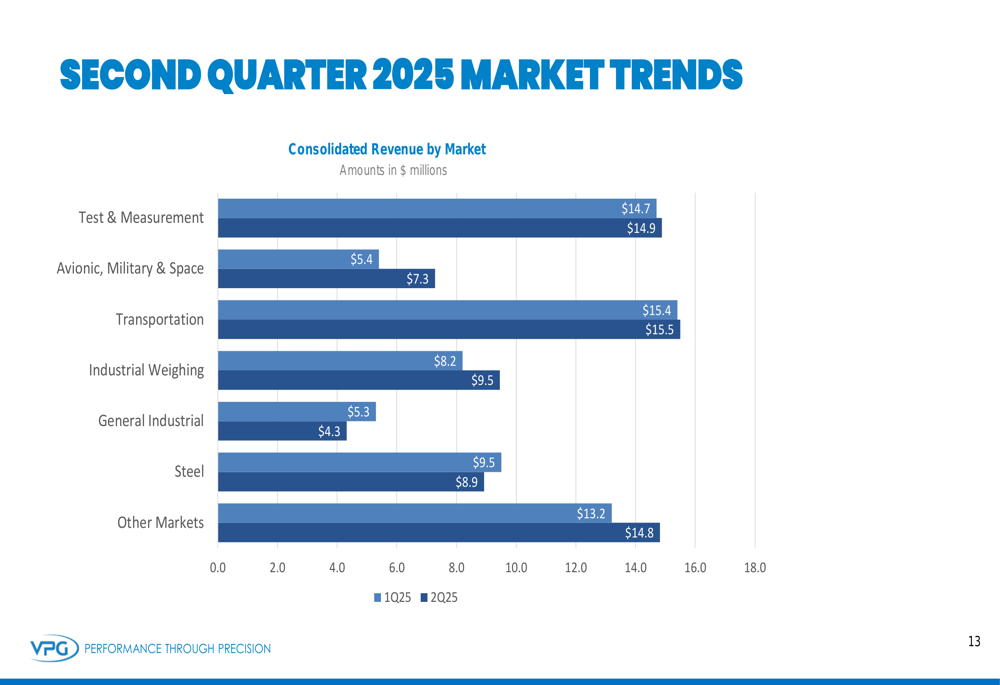
Looking at market trends, VPG saw sequential revenue growth in several key markets, including Test & Measurement, Avionic, Military & Space, Transportation, Industrial Weighing, and Other Markets, while experiencing declines in General Industrial and Steel markets.
The following chart illustrates the company’s revenue distribution across various markets:
Strategic Initiatives
VPG outlined progress on its 2025 strategic priorities, focusing on three key areas: business development, cost controls and operational excellence, and mergers and acquisitions.
In business development, the company reported approximately $17 million in orders year-to-date related to business development initiatives. Projects aimed at improving sales processes and systems are on track, potentially enhancing future sales effectiveness.
For cost controls and operational excellence, VPG completed the sale of a building for $10.8 million in July 2025, as part of its ongoing efficiency initiatives. The company also reported that it is on track to achieve targeted annual fixed cost reductions of $5 million, which should positively impact future profitability.
On the M&A front, VPG continues to search for attractive, high-quality businesses to add to its platform, leveraging its strong balance sheet and cash position to pursue strategic acquisitions that could accelerate growth.
The company also highlighted its ongoing sustainability efforts, including a climate risk assessment and greenhouse gas goals/target setting projects currently underway, demonstrating a commitment to environmental responsibility alongside financial performance.
In conclusion, VPG’s second quarter 2025 results show a significant improvement from the previous quarter, with sequential revenue growth, expanded margins, and strong order momentum suggesting a potential recovery path. The company’s focus on operational efficiency and strategic growth initiatives, combined with its solid financial position, provides a foundation for continued improvement in the coming quarters.
Full presentation:
This article was generated with the support of AI and reviewed by an editor. For more information see our T&C.