Moody’s downgrades Senegal to Caa1 amid rising debt concerns

Walmart Inc (NYSE:WMT) released its second quarter fiscal year 2026 financial presentation on August 21, 2025, revealing solid performance across key metrics and prompting the retail giant to raise its full-year guidance. Despite the positive results, the company’s stock was down 3.23% in premarket trading at $99.26.
Quarterly Performance Highlights
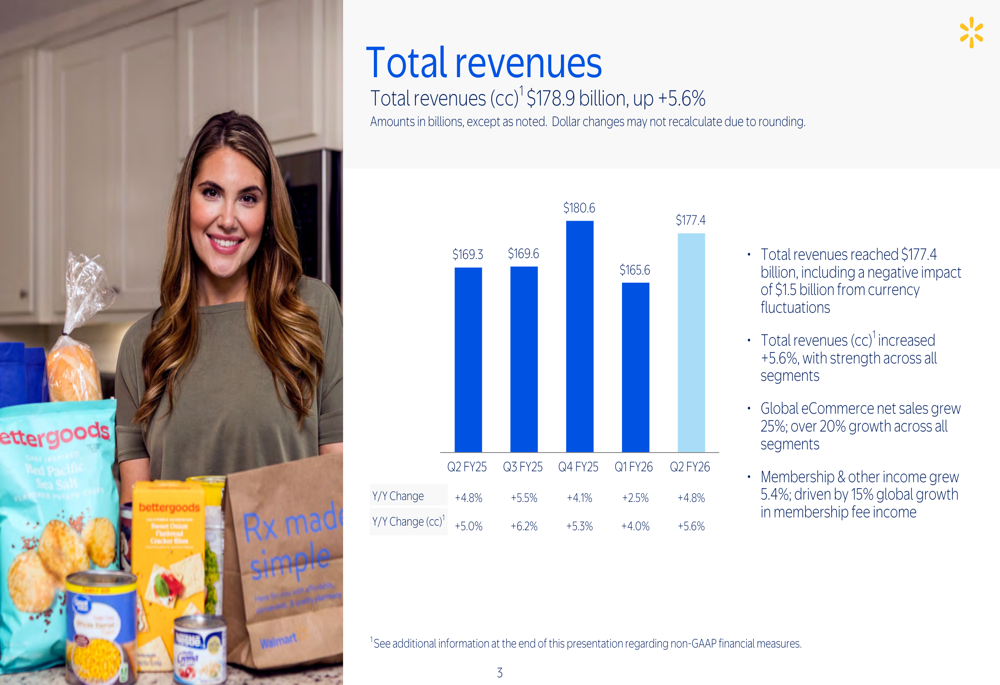
Walmart reported total revenues of $177.4 billion for Q2 FY26, representing a 4.8% increase year-over-year. On a constant currency basis, revenues reached $178.9 billion, up 5.6%, showing acceleration from the previous quarter’s 4.0% growth. The company’s global eCommerce sales continued to show impressive momentum, growing 25% during the quarter.
As shown in the following chart of quarterly revenue growth:
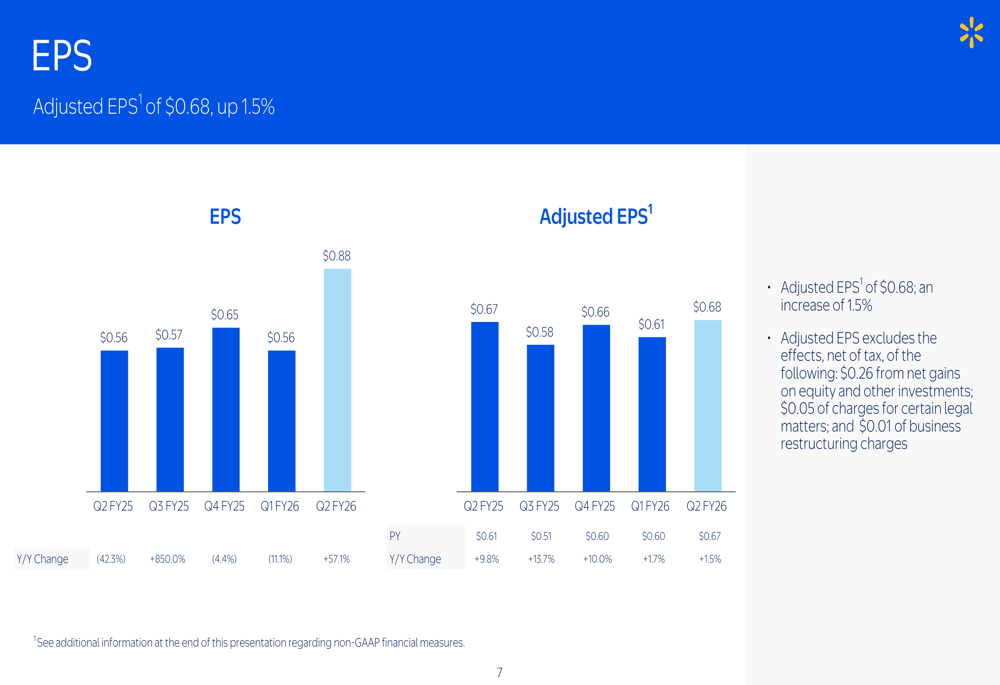
The company’s adjusted earnings per share came in at $0.68, a 1.5% increase year-over-year. This performance builds on Walmart’s Q1 FY26 results, which saw the company beat analyst expectations with EPS of $0.61 against a forecast of $0.58.
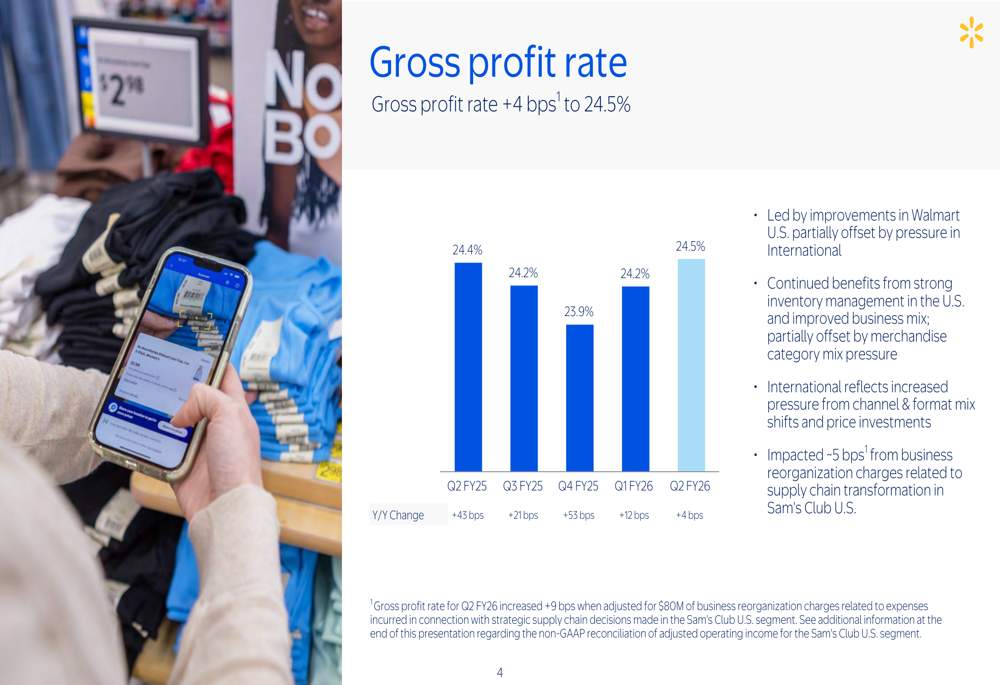
Gross profit rate increased by 4 basis points to 24.5%, reflecting improvements in Walmart U.S. and benefits from inventory management. However, the company faced increased pressure from channel and format mix shifts in its International segment.
As illustrated in the gross profit rate chart:
Segment Performance
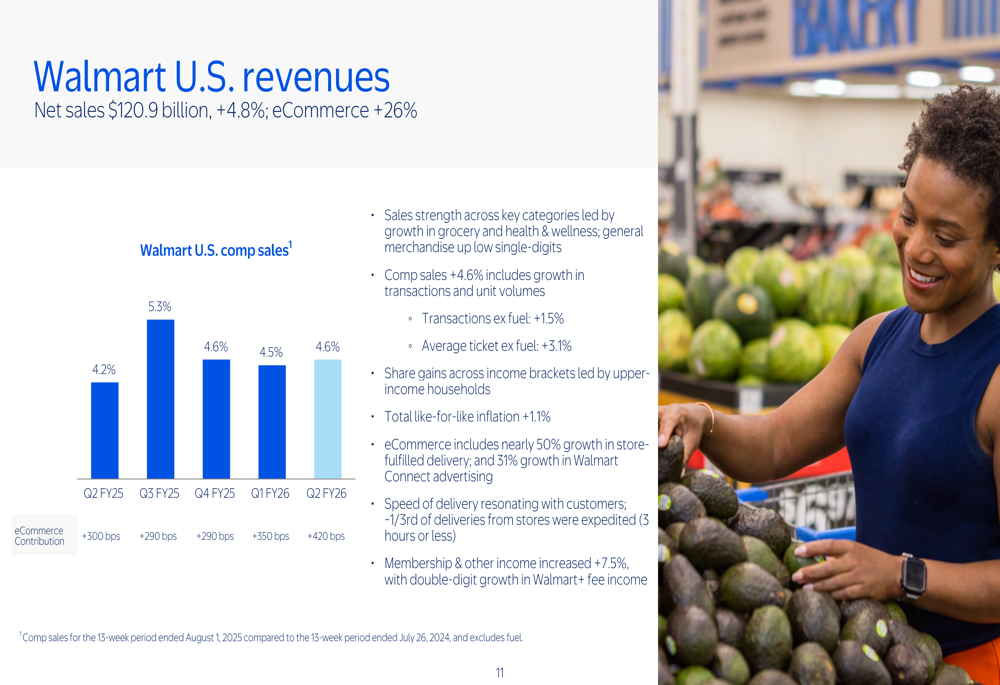
Walmart U.S., the company’s largest segment, delivered net sales of $120.9 billion, up 4.8% year-over-year. Comparable sales grew 4.6%, with eCommerce contributing 420 basis points to that growth as online sales surged 26%. The segment’s operating income increased 2.0% to $6.7 billion.
The following chart shows Walmart U.S. comparable sales performance:
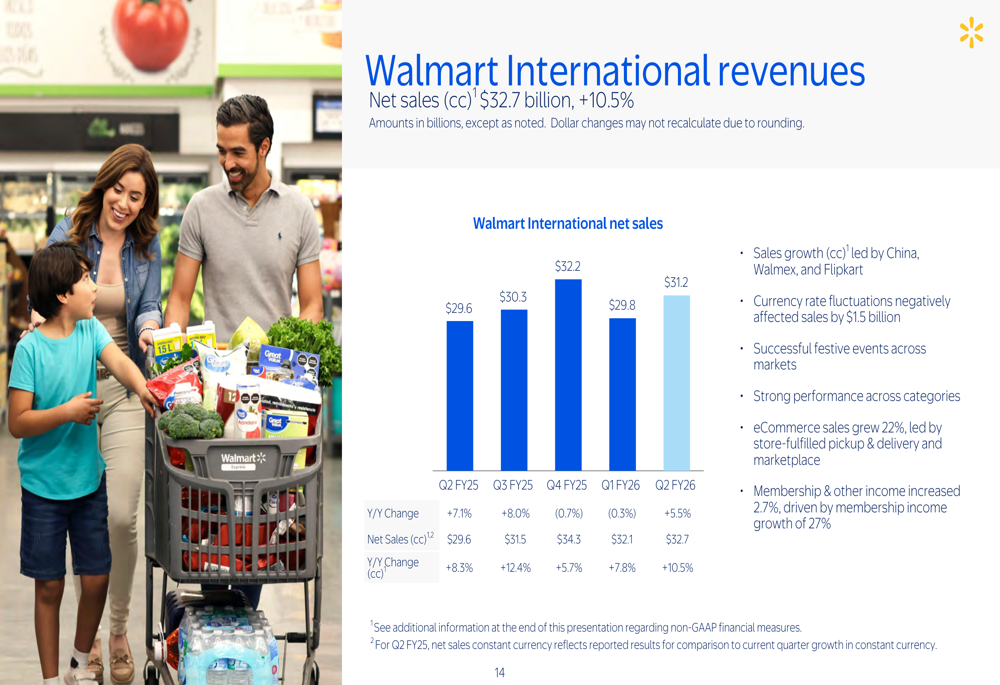
Walmart International demonstrated robust growth with net sales on a constant currency basis reaching $32.7 billion, up 10.5%. This growth was led by China, Walmex, and Flipkart, though currency fluctuations negatively affected reported sales by $1.5 billion. Despite strong sales growth, operating income for the segment declined 9.8% to $1.2 billion.
As shown in the International segment performance:
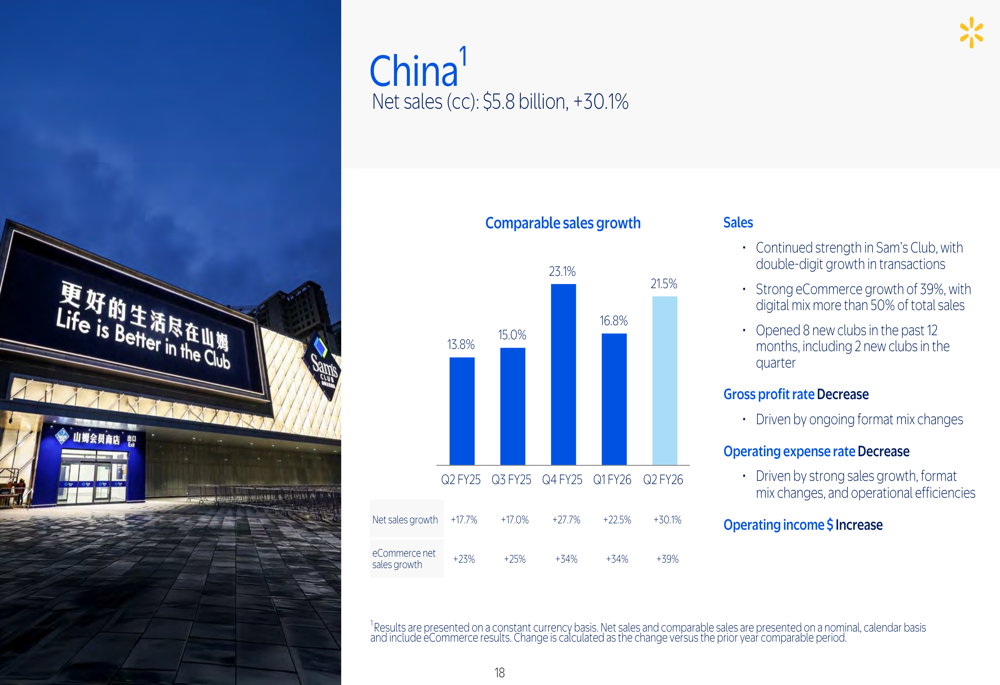
China emerged as a standout performer within the International segment, with net sales on a constant currency basis soaring 30.1% to $5.8 billion. Comparable sales in China grew 21.5%, and eCommerce sales increased 39%, highlighting the success of Walmart’s expansion strategy in the region.
The following chart illustrates China’s impressive growth trajectory:
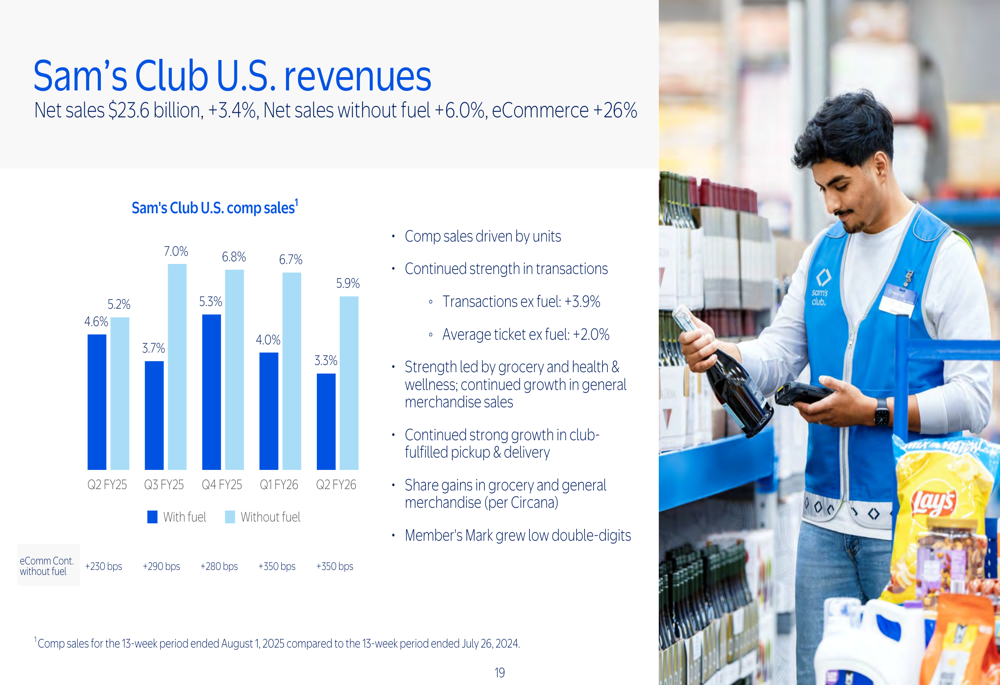
Sam’s Club U.S. reported net sales of $23.6 billion, up 3.4% year-over-year, or 6.0% excluding fuel. The segment saw eCommerce growth of 26%, now comprising 18% of net sales. Membership income increased 7.6%, indicating strong customer loyalty. However, operating income declined 15.8% to $489 million, partly due to business reorganization charges.
Financial Position and Shareholder Returns
Walmart’s operating cash flow increased by $2.0 billion compared to the same period last year, primarily due to timing of certain payments. Free cash flow also increased by $1.1 billion, partially offset by an increase in capital expenditures.
The company continued to return value to shareholders, with dividends of $1.9 billion and share repurchases totaling $1.6 billion during the quarter. The remaining share repurchase authorization stands at $5.9 billion.
Walmart’s Return on Investment (ROI) remained relatively flat at 15.1%, affected by an increase in average invested capital due to higher purchases of property and equipment.
Updated Guidance
Based on the strong performance in the first half of the fiscal year, Walmart has raised its full-year guidance. The company now expects:
- Net sales (constant currency) to increase 3.75% to 4.75%, up from the previous guidance of 3.0% to 4.0%
- Adjusted EPS of $2.52 to $2.62, increased from the previous range of $2.50 to $2.60
- Operating income (constant currency) to increase 3.0% to 6.0%, unchanged from previous guidance
For Q3 FY26 specifically, Walmart projects:
- Net sales (constant currency) to increase 3.75% to 4.75%
- Operating income (constant currency) to increase 3.0% to 6.0%
- Adjusted EPS of $0.58 to $0.60
Market Reaction and Outlook
Despite the positive results and raised guidance, Walmart’s stock was down 3.23% in premarket trading. This reaction suggests investors may have had even higher expectations or concerns about specific aspects of the results, such as the modest operating income growth of 0.4% on a constant currency basis compared to the 5.6% revenue growth.
The company’s continued investment in eCommerce appears to be paying off with strong growth across all segments. However, the increased operating expenses as a percentage of net sales, which rose 35 basis points to 21.0%, indicate ongoing cost pressures that may be weighing on investor sentiment.
Walmart’s impressive performance in China and other international markets demonstrates the effectiveness of its global expansion strategy, even as currency fluctuations present challenges. As the company continues to execute on its financial framework, investors will be watching closely to see if the raised guidance translates into accelerated earnings growth in the coming quarters.
Full presentation:
This article was generated with the support of AI and reviewed by an editor. For more information see our T&C.