Trump to impose 100% tariff on China starting November 1

Webster Financial Corporation (NYSE:WBS) reported solid first-quarter 2025 results, with continued deposit and loan growth alongside stable margins, though rising loan provisions signal some caution. The company presented its earnings results during a conference call held on April 24, 2025.
Quarterly Performance Highlights
Webster Financial delivered earnings per share of $1.30 for the first quarter, with net income applicable to common shareholders reaching $220.4 million. The company achieved a return on average tangible common equity (ROATCE) of 15.93% and return on average assets (ROAA) of 1.15%, demonstrating solid profitability metrics.
Pre-provision net revenue (PPNR) totaled $361.2 million, while the efficiency ratio improved to 45.8%, reflecting disciplined expense management despite some seasonal cost increases.
As shown in the following performance summary:
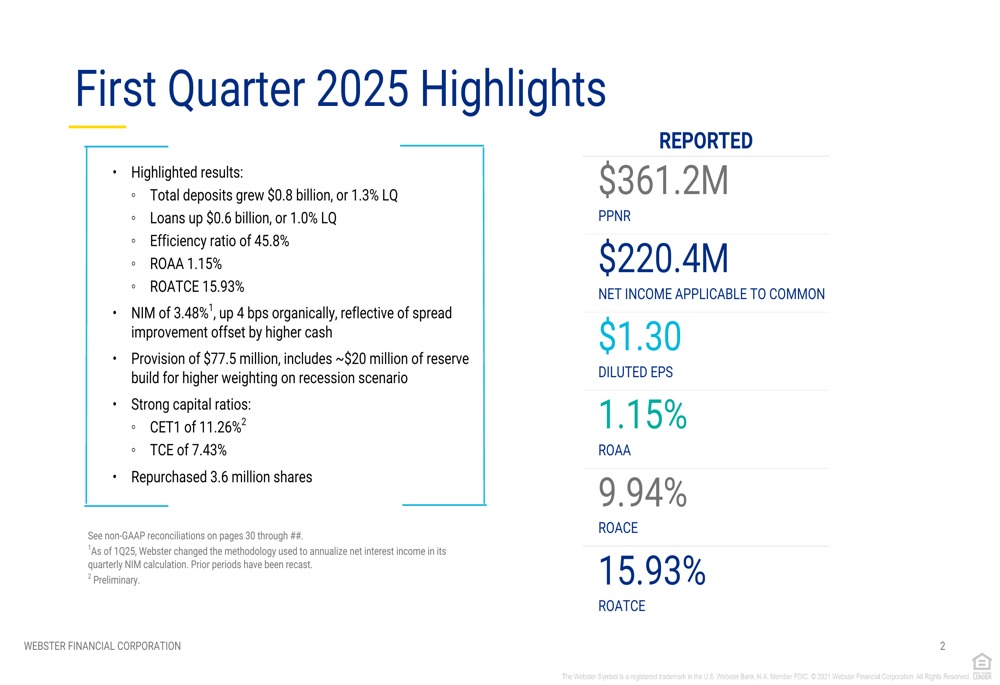
The company’s net interest margin (NIM) expanded to 3.48%, up 4 basis points from the previous quarter, driven by organic growth. This improvement came despite a challenging interest rate environment, highlighting Webster’s effective balance sheet management.
Deposit and Loan Growth
Webster Financial continued to demonstrate strength in gathering deposits, with total deposits growing by $0.8 billion or 1.3% compared to the previous quarter, and $4.8 billion or 7.9% year-over-year. The company maintains a diversified deposit base across multiple business segments, providing stability and reducing concentration risk.
The following chart illustrates Webster’s diversified deposit profile across various business segments:
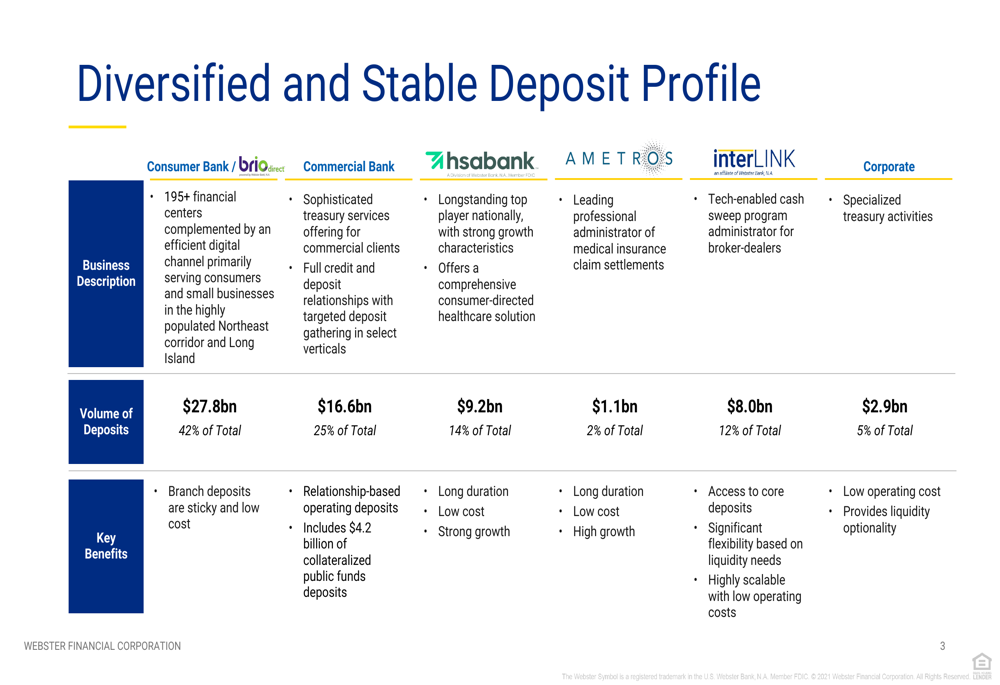
Consumer banking represents the largest deposit segment at $27.8 billion (42% of total), followed by the commercial bank at $16.6 billion (25%), HSA Bank at $9.2 billion (14%), and interLINK at $8.0 billion (12%). The recent acquisition of Ametros, completed in late January 2024, contributed $1.1 billion (2%) to the deposit base.
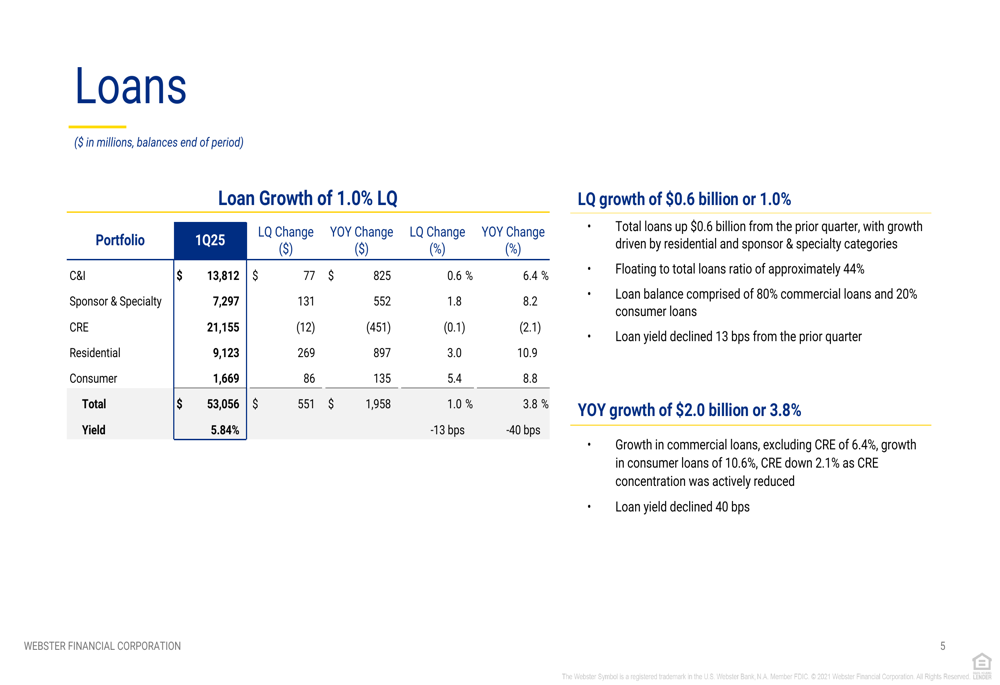
On the lending side, total loans increased by $0.6 billion or 1.0% quarter-over-quarter, reaching $53.1 billion. Year-over-year loan growth was 3.8%. The loan portfolio remains diversified across commercial real estate, commercial and industrial, sponsor and specialty finance, and consumer segments.
The loan portfolio composition and growth trends are detailed below:
Credit Quality Trends
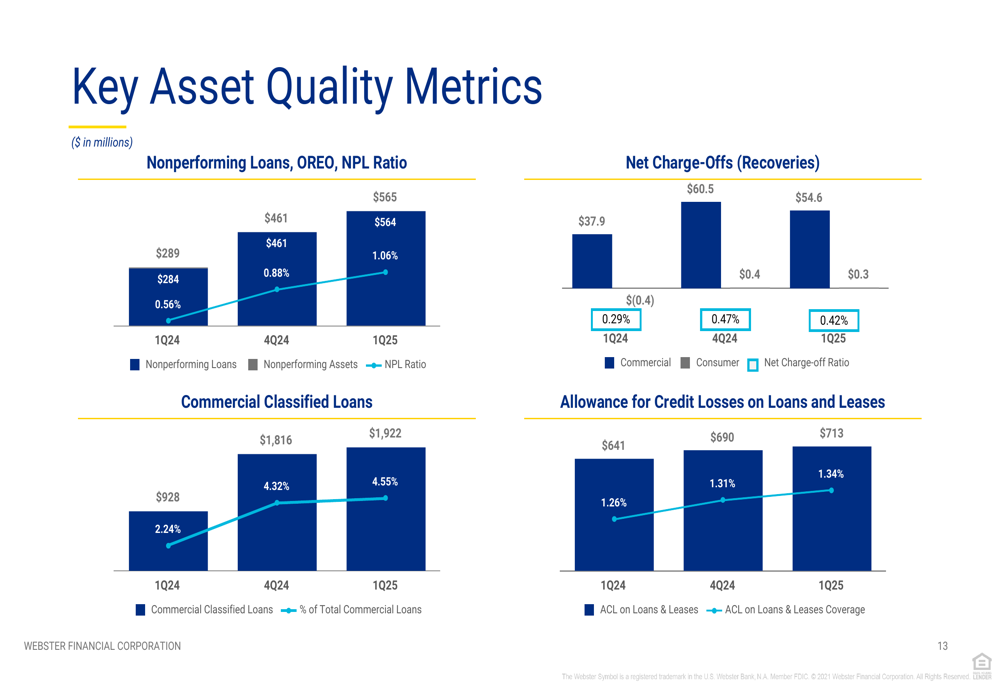
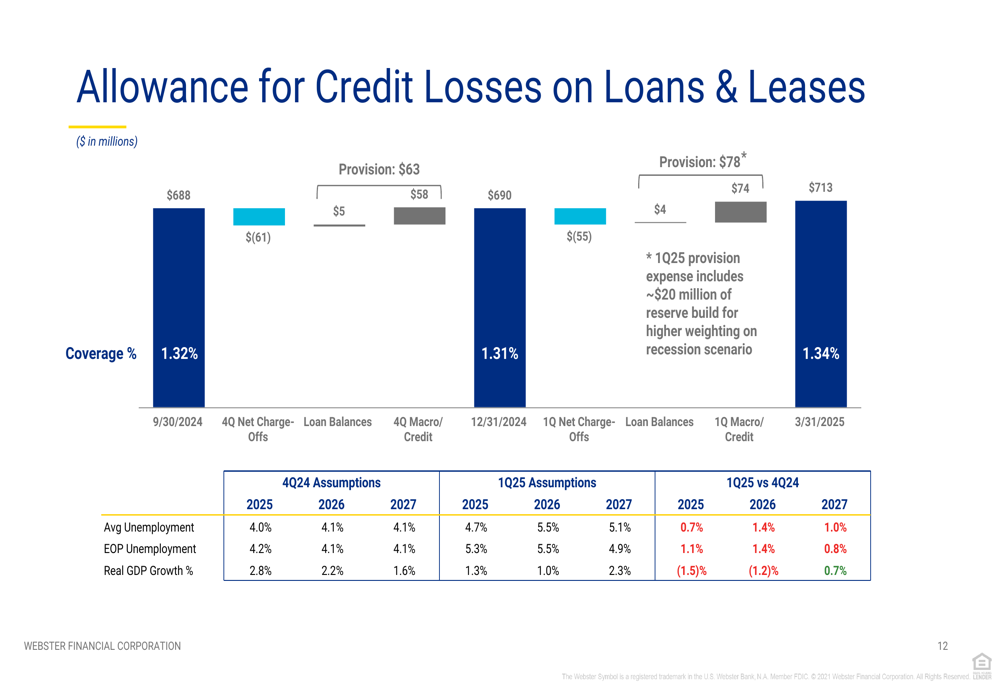
Webster’s first quarter results showed some deterioration in credit quality metrics, with the provision for credit losses increasing to $77.5 million, up from $63 million in the previous quarter. The allowance for credit losses on loans and leases increased to 1.34% of total loans, up from 1.31% at the end of 2024.
Non-performing loans (NPLs) continued to rise, with the NPL ratio increasing to 1.06% in Q1 2025, compared to 0.88% in Q4 2024 and 0.56% in Q1 2024. This trend reflects broader economic concerns, particularly in the commercial real estate sector.
The following chart illustrates the key asset quality metrics:
Of particular note is the traditional office segment within the commercial real estate portfolio, which shows elevated classified loans at 25.6% compared to other property types. The company’s economic forecast assumes rising unemployment between 2025 and 2027, from the current 4.0-4.2% to 5.1-5.5%, with a corresponding decline in real GDP growth.
The allowance for credit losses reflects these economic assumptions:
Capital Position and Outlook
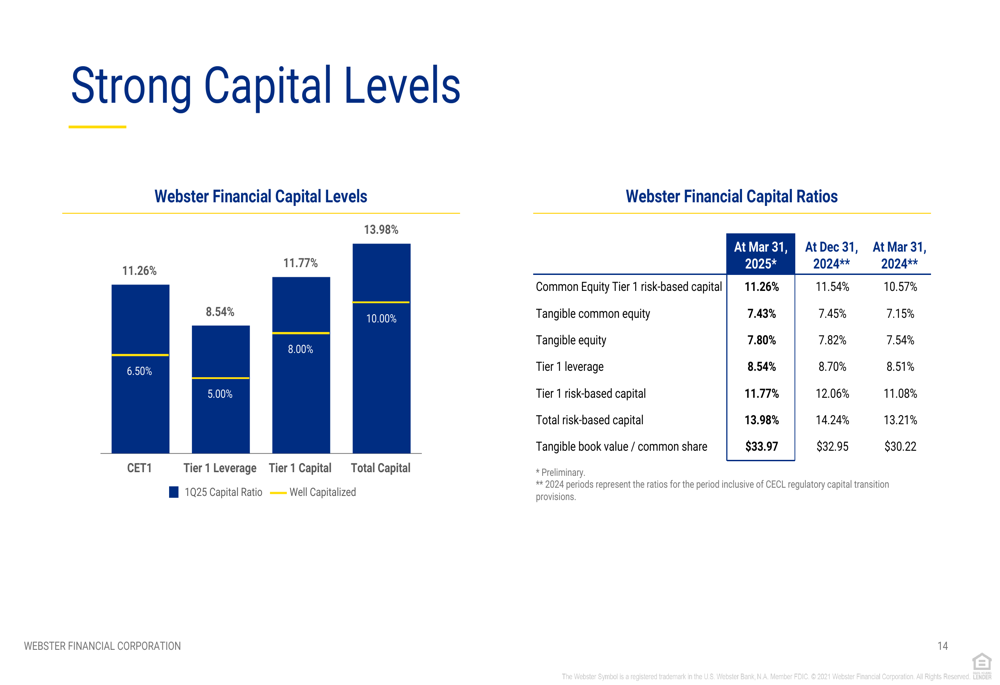
Webster Financial maintains strong capital levels, with a Common Equity Tier 1 (CET1) ratio of 11.26% and a tangible common equity ratio of 7.43%. The company repurchased 3.6 million shares during the quarter, demonstrating confidence in its financial position while returning capital to shareholders.
The capital position is illustrated in the following chart:
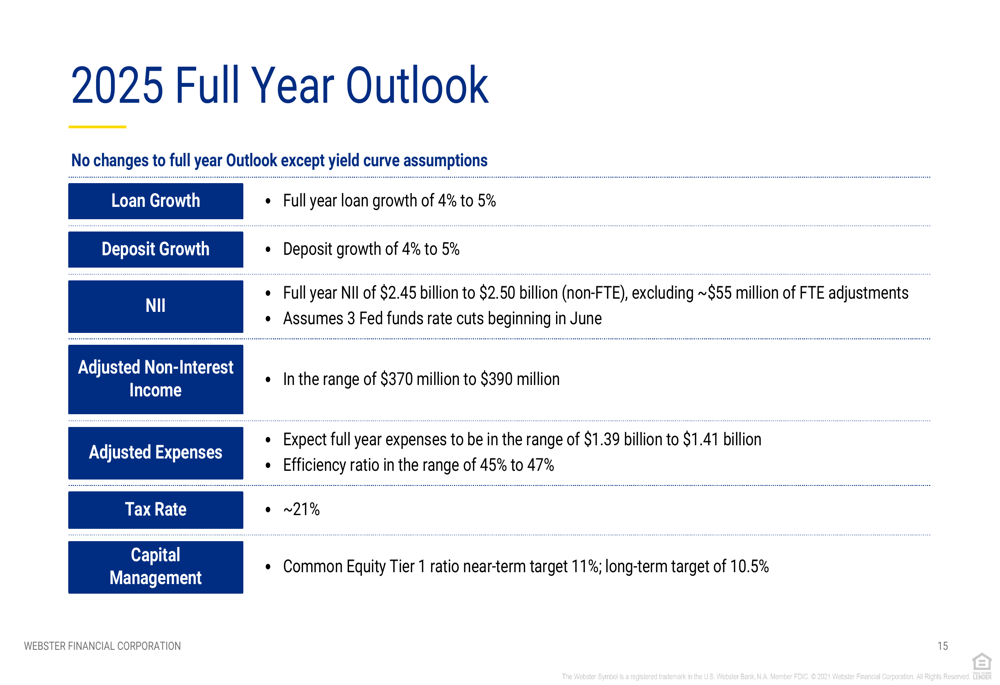
For the full year 2025, Webster Financial maintained its previous guidance, projecting loan and deposit growth of 4-5%, net interest income of $2.45-2.50 billion, and an efficiency ratio in the range of 45-47%. The company targets a near-term CET1 ratio of 11%, with a long-term target of 10.5%.
The full year outlook is summarized below:
Market Context
Webster Financial’s stock closed at $47.16 on April 23, 2025, with a slight decline in pre-market trading. The stock has traded in a 52-week range of $39.34 to $63.99, reflecting broader market volatility in the financial sector.
The Q1 2025 results continue a trend seen in previous quarters, with the company’s Q3 2024 earnings having exceeded EPS expectations while falling short on revenue targets. The current presentation’s projection of 4-5% loan growth appears slightly more optimistic than comments made during the Q3 2024 earnings call, where management suggested 2025 might see "modest" loan growth similar to 2024.
Webster Financial’s diversified business model, strong deposit franchise, and solid capital position provide resilience in a challenging economic environment, though investors will likely continue to monitor credit quality metrics closely in the coming quarters.
Full presentation:
This article was generated with the support of AI and reviewed by an editor. For more information see our T&C.