Walmart halts H-1B visa offers amid Trump’s $100,000 fee increase - Bloomberg

Introduction & Market Context
Yara International ASA (OSL:YAR) presented its second-quarter 2025 results on July 18, revealing a substantial 27% year-over-year increase in EBITDA, driven by improved margins, record-high production, and supportive market fundamentals. The Norwegian fertilizer giant continues to benefit from its strategic focus on operational efficiency and cost reduction initiatives.
Despite trading at 40.50 NOK per share, Yara has demonstrated resilience in a challenging market environment, with strong nitrogen fundamentals supporting its business model and global expansion strategy.
Quarterly Performance Highlights
Yara reported EBITDA excluding special items of 652 million USD for Q2 2025, representing a 27% increase from 513 million USD in the same period last year. This improvement was primarily driven by margin expansion, contributing 105 million USD to the EBITDA growth, alongside fixed cost reductions of 46 million USD.
As shown in the following chart detailing the EBITDA increase factors:
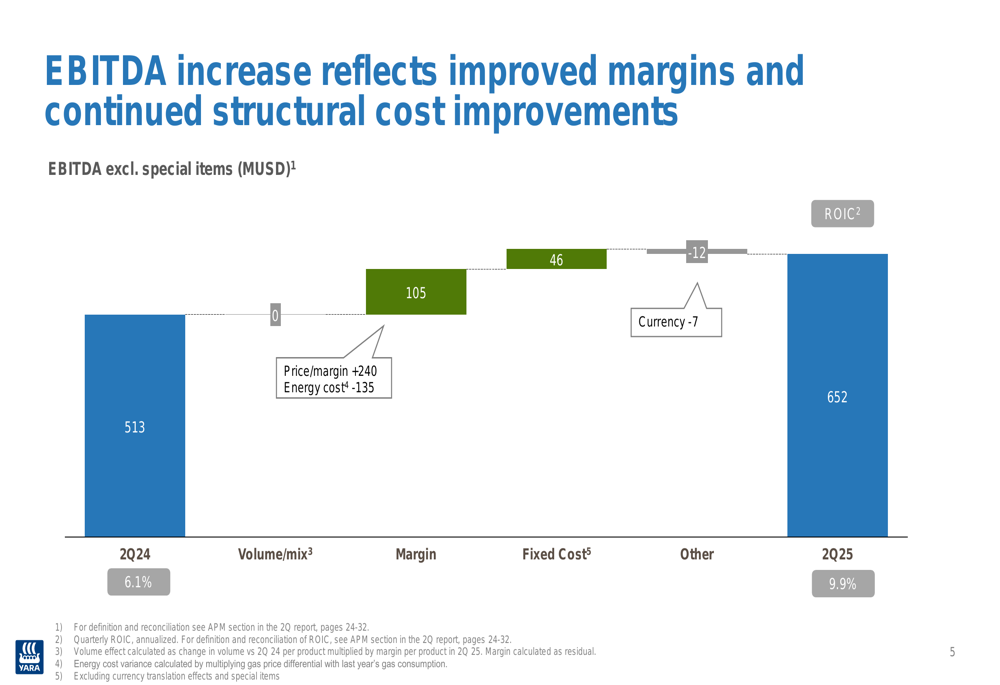
The company’s adjusted earnings per share for the first half of 2025 reached 1.92 USD, a significant improvement from 0.64 USD in the previous year. Return on invested capital (ROIC) also saw substantial growth, increasing from 6.1% to 9.9%.
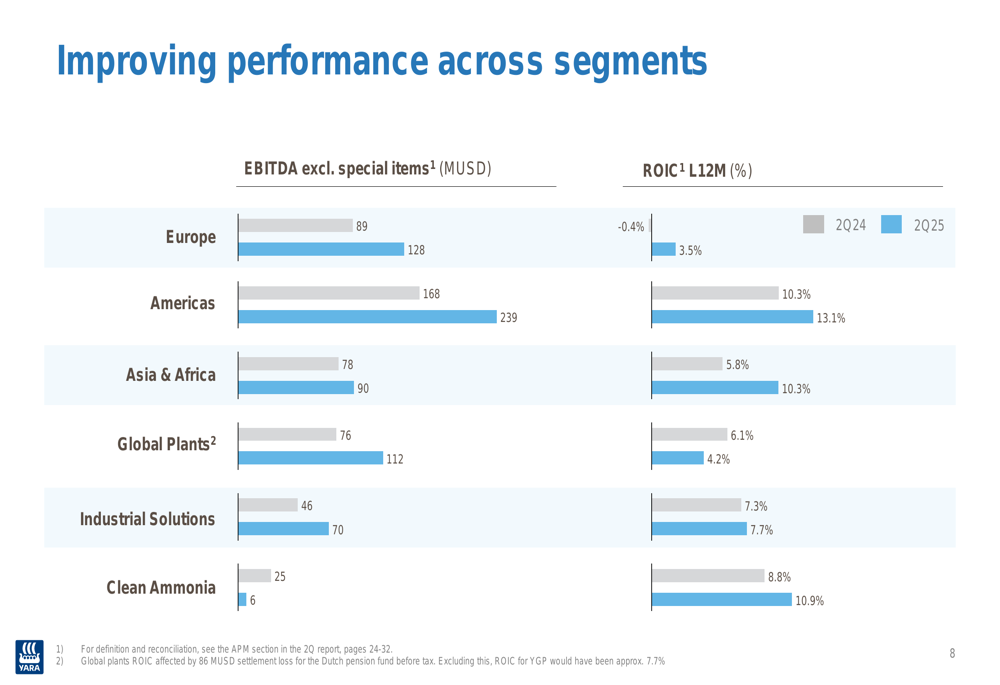
Yara’s financial performance improved across most segments, with particularly strong results in the Americas, where EBITDA increased from 168 million USD to 239 million USD, and in Europe, where EBITDA rose from 89 million USD to 128 million USD.
Operational Improvements
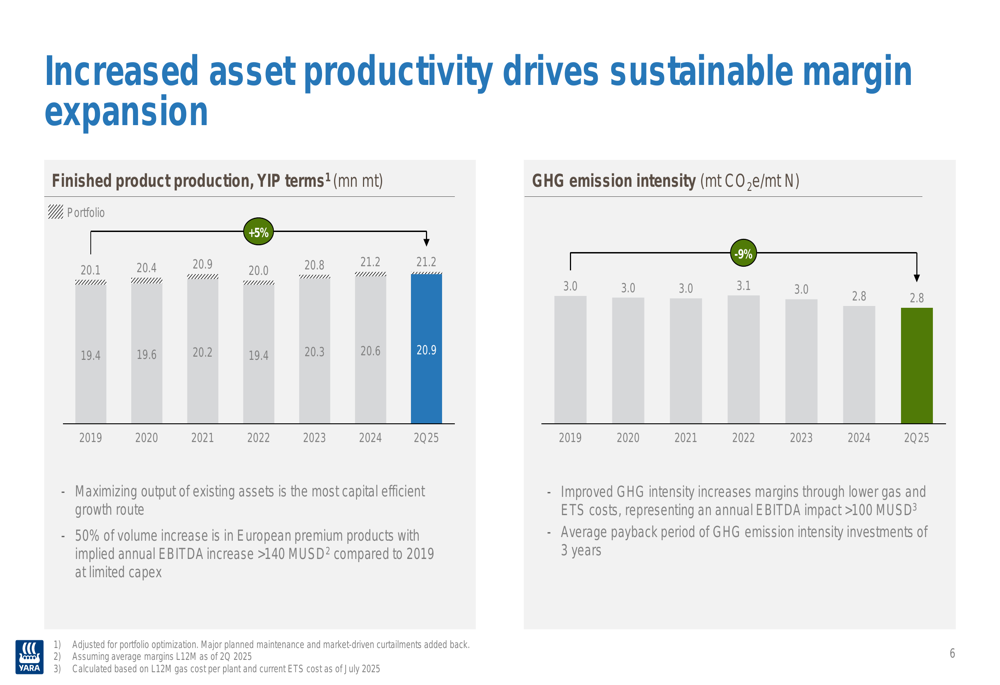
A key driver of Yara’s improved performance has been its focus on asset productivity and operational efficiency. The company achieved record-high production levels while simultaneously reducing its greenhouse gas emission intensity, demonstrating its commitment to sustainable operations.
Finished product production increased from 20.1 million metric tons in 2019 to 20.9 million metric tons in Q2 2025, while GHG emission intensity decreased from 3.0 mt CO2e/mt N to 2.8 mt CO2e/mt N over the same period.
As illustrated in the following chart showing the relationship between production increases and emissions reduction:
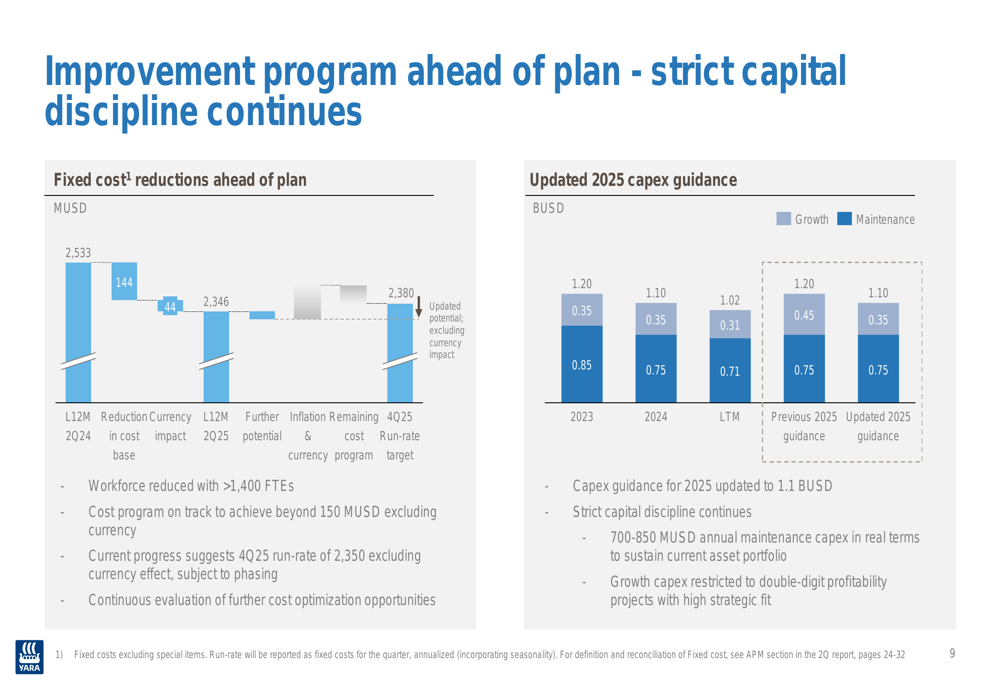
Yara’s improvement program is ahead of schedule, with fixed cost reductions and capex optimization contributing significantly to the company’s financial performance. The capex guidance for 2025 has been updated to 1.1 billion USD, reflecting strict capital discipline and a focus on high-return projects.
Market Position & Outlook
Yara reported strong crop nutrition deliveries in Q2 2025, with total deliveries increasing by 3% year-over-year to 6,273 kilotonnes. The Americas region led this growth with a 9% increase, while Africa & Asia saw a 2% rise. European volumes decreased by 4%, primarily due to an early spring season.
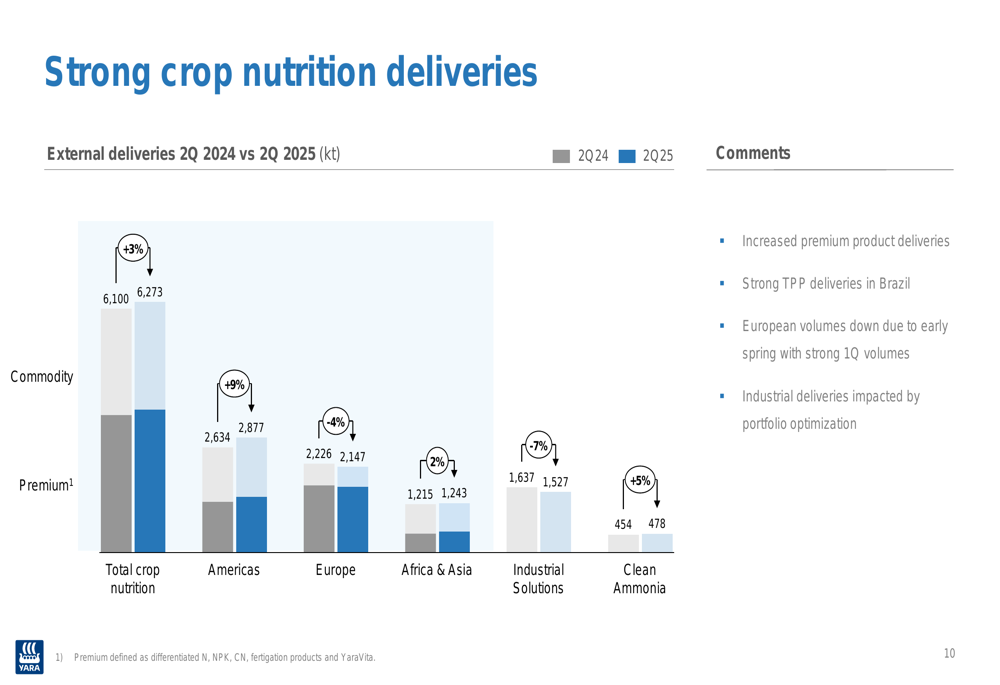
Despite the quarterly decrease in European volumes, Yara’s full-season European deliveries increased by 5%, outperforming the broader fertilizer industry’s 1% growth. The company maintained a healthy European order book of approximately two months going into Q3 2025.
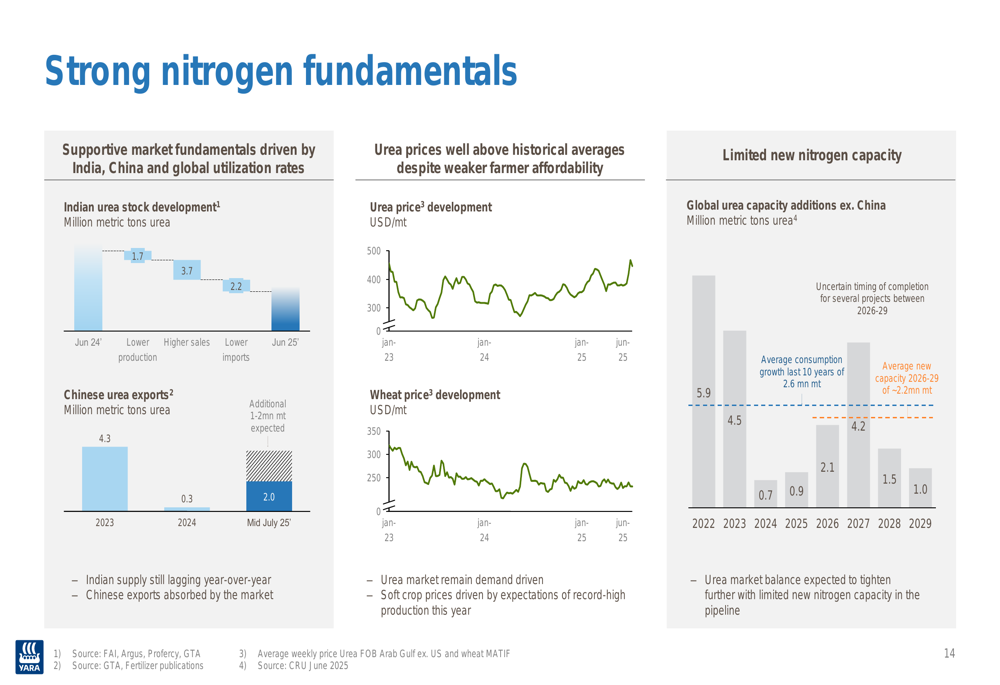
Strong nitrogen fundamentals continue to support Yara’s business model, with urea prices remaining above historical averages despite some pressure on farmer affordability. Limited new nitrogen capacity is expected to come online in the 2026-2029 period, which should help maintain favorable market conditions.
Strategic Initiatives
Yara’s global scale in ammonia production and sourcing provides it with unique flexibility in the market. The company is the only player able to off-take a new ammonia project at sufficient scale, positioning it well for potential strategic investments, particularly in the US market.
As demonstrated in the following illustration of Yara’s global ammonia capabilities:
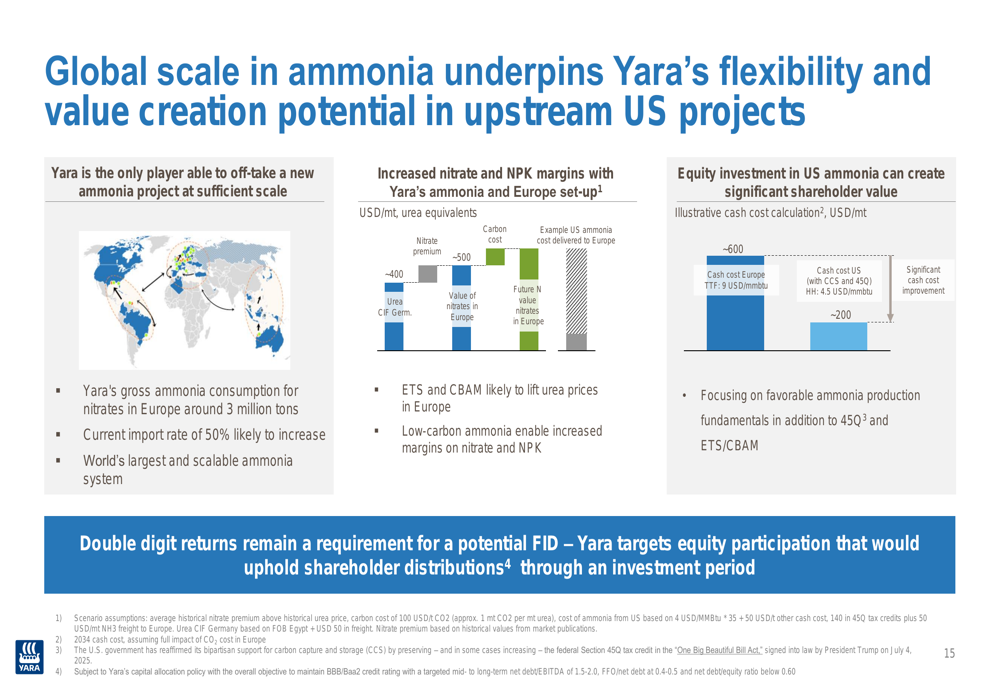
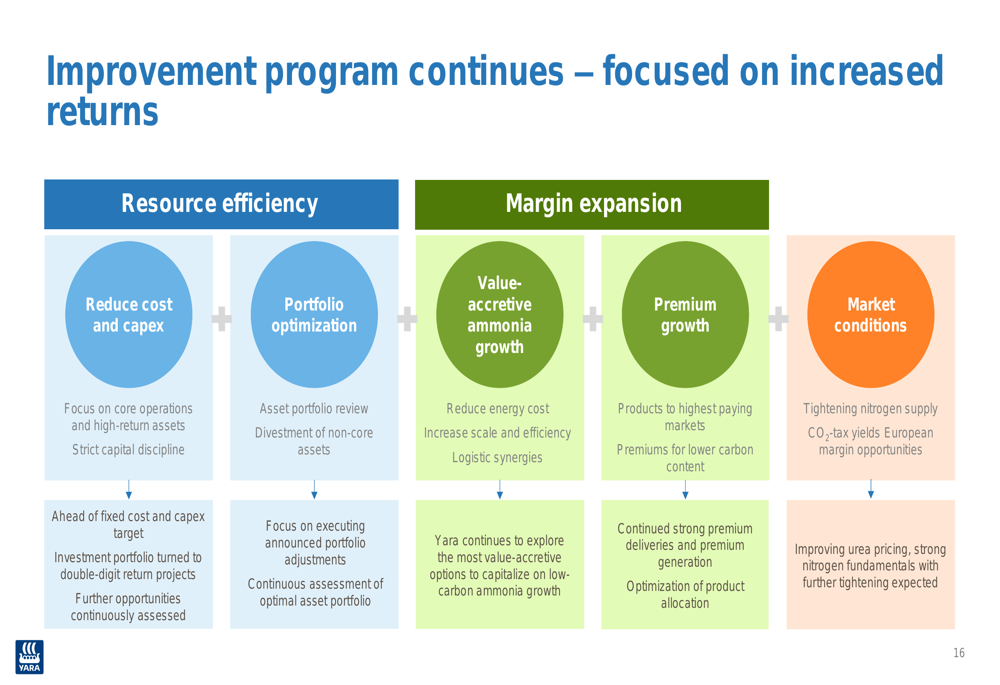
The company continues to focus on its improvement program, targeting increased returns through resource efficiency, margin expansion, portfolio optimization, and favorable market conditions. Yara aims to reduce fixed costs to a run-rate target of 2,380 million USD by Q4 2025.
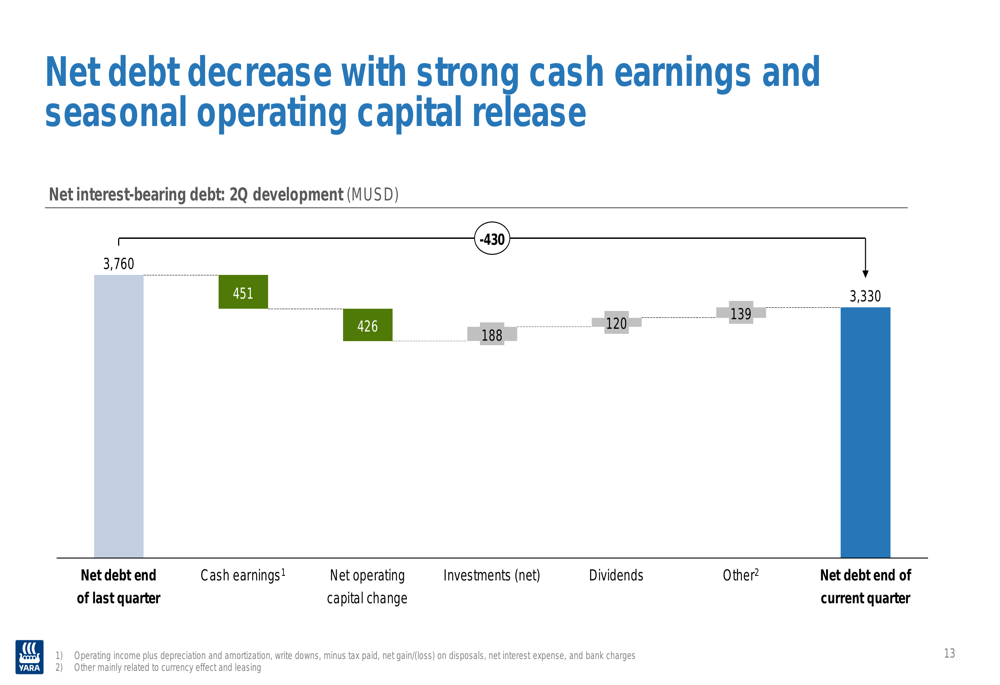
Yara’s strong cash flow generation has contributed to a reduction in net interest-bearing debt from 3,760 million USD to 3,330 million USD. This improvement was driven by cash earnings of 451 million USD and a positive net operating capital change of 426 million USD, partially offset by investments and dividend payments.
In conclusion, Yara International’s Q2 2025 results demonstrate the company’s successful execution of its strategic priorities, with improved operational efficiency, cost reductions, and strong market fundamentals contributing to significant financial performance improvements. The company appears well-positioned to continue this positive trajectory, supported by its global scale and ongoing improvement initiatives.
Full presentation:
This article was generated with the support of AI and reviewed by an editor. For more information see our T&C.