


Sign up to create alerts for Instruments,
Economic Events and content by followed authors
Free Sign Up Already have an account? Sign In
Please try another search
Remember that moment when the RSI screams “overbought,” while the MACD whispers “bullish momentum,” and somewhere in between, you’re frozen—analysis paralysis at its finest.
We’ve all been there.
Technical analysis is a challenging game to play for most retail investors[1][2], with only about 1% of day traders achieving consistent profitability[3][4] over the long run.
That’s where having access to professional-grade analysis, thereby removing emotion from decision-making, can prove to be the ultimate game-changer.
Investing.com is excited to introduce AI-powered chart analysis—the latest feature in WarrenAI, your Gen-AI financial researcher.
This groundbreaking feature literally “sees” your charts the way professional traders do, transforming visual chaos into clear, actionable insights in under 60 seconds. It’s like having a cheat sheet of the market at your fingertips. And it works across any financial instrument with a chart—stocks, ETFs, crypto, forex, commodities, indices, and more.
Unlike traditional tools that simply calculate indicators, WarrenAI's Vision AI technology actually analyzes chart images—spotting complex patterns like head-and-shoulders formations, breakouts, divergences, and much more. These are setups that would take even experienced traders significant time to identify.
Think of it as having a professional trader's trained eye analyzing your charts 24/7, but with the processing power to evaluate multiple technical indicators simultaneously. Unlike human analysis, it's backed by rigorous engineering that ensures consistent, reliable results every single time.
When you click the "Analyze Chart" button, you're triggering a sophisticated multi-stage process that we've optimized through thousands of hours of development:
Hit the "Analyze Chart" button on any asset - stocks, crypto, forex, or any of the 180,000+ financial assets WarrenAI supports.
Our AI selects the most relevant timeframe for your analysis—typically daily charts for stocks or 15-minute charts for forex—identifying patterns and analyzing indicators just like a professional trader would.
The AI selects only the most relevant indicators for your specific situation, including RSI, MACD, Bollinger Bands, and many others.
Your request triggers carefully engineered prompts that we've validated across multiple AI models to ensure you get the most accurate, relevant analysis possible.
In about 60 seconds, you receive:
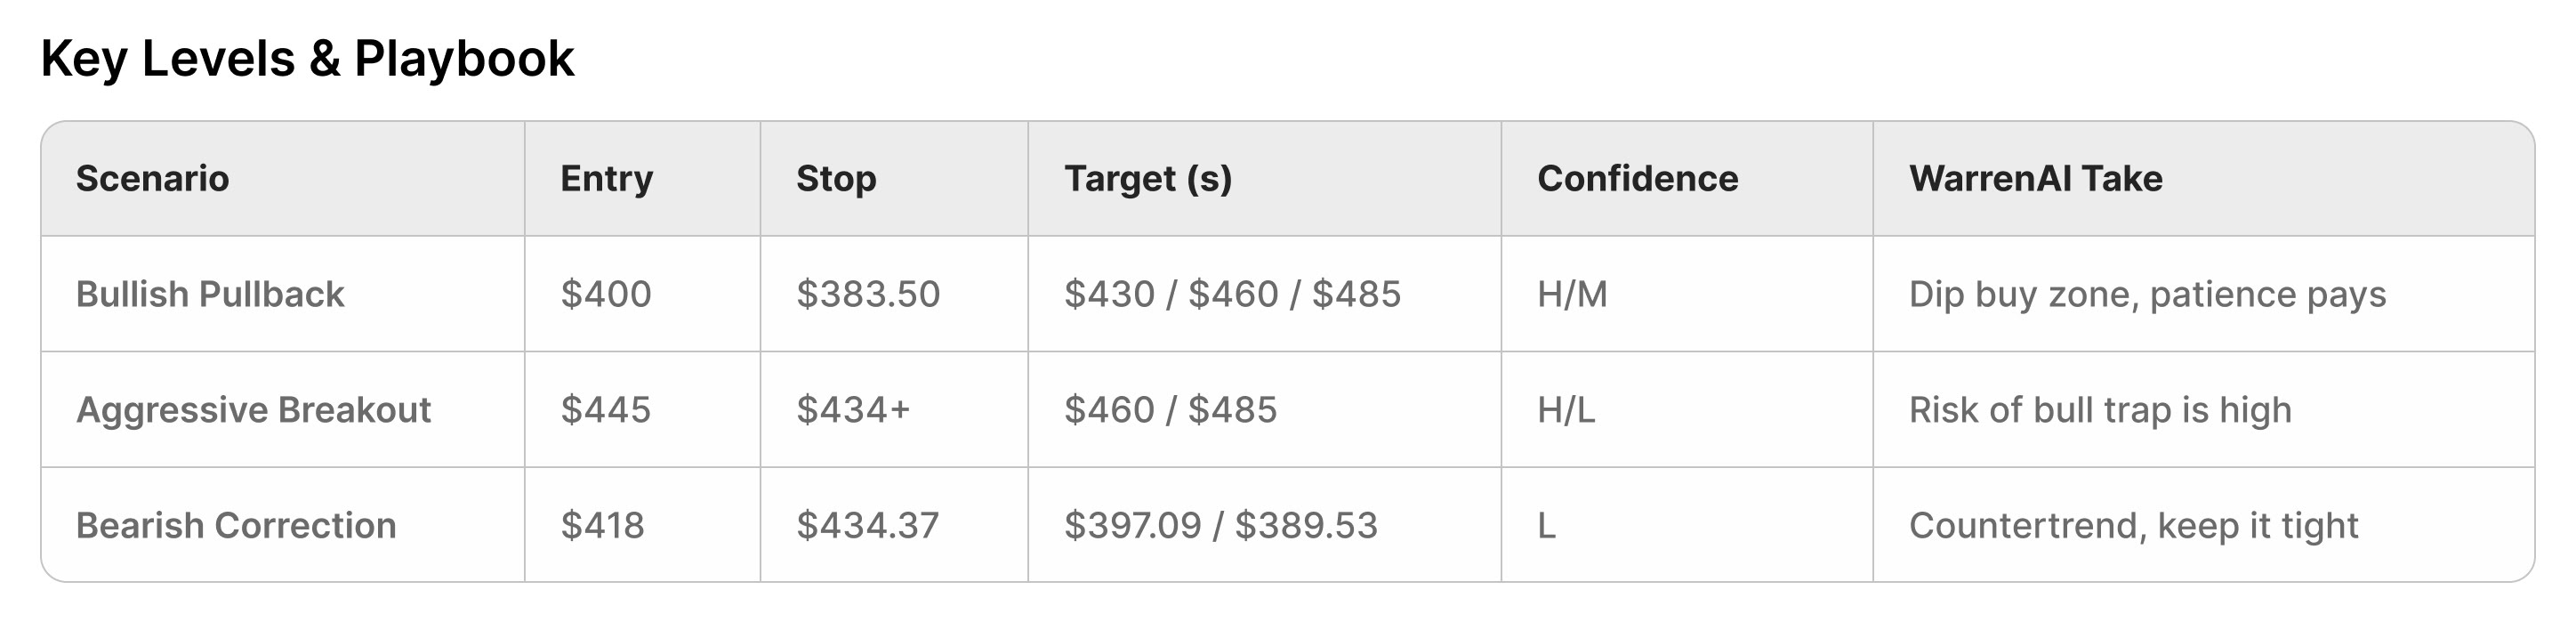
The Trading Playbook - The centerpiece of every analysis:
Plus the "Why" Behind Every Level:
Visual Chart Analysis:
We've combined years of market experience with advanced AI to deliver objective, professional-grade analysis without emotion or bias. It's like having an expert trader explain exactly what they see in the charts - but available 24/7 at the click of a button.
“Regular LLMs can’t truly understand numbers, which is why most trading AIs just repeat what indicators say - basically reading you the manual. We’ve given our AI eyes to see what top traders see: the small patterns, the forming setups, the visual story that numbers alone can’t tell. Think of it as having a top bank’s best technical analyst working just for you. That level of visual pattern recognition used to require decades of experience or a big fund’s budget. Not anymore.”
- Yonatan Adest, CTO
What separates WarrenAI from other technical analysis tools isn't just what it does—it's how we built it. Our engineering team spent months perfecting every aspect of the system:
Behind every accurate analysis is hundreds of hours of prompt engineering and testing.
We didn't just ask the AI to "analyze this chart."
Our team:
Adest continues: "The difference between a 70% and 90% accurate analysis often comes down to how you ask the question. We've engineered our prompts to think like seasoned traders, not generic chatbots."
WarrenAI uses two specialized AI models working together:
This dual approach delivers professional-grade visual analysis with crystal-clear explanations that you can actually understand and act on.
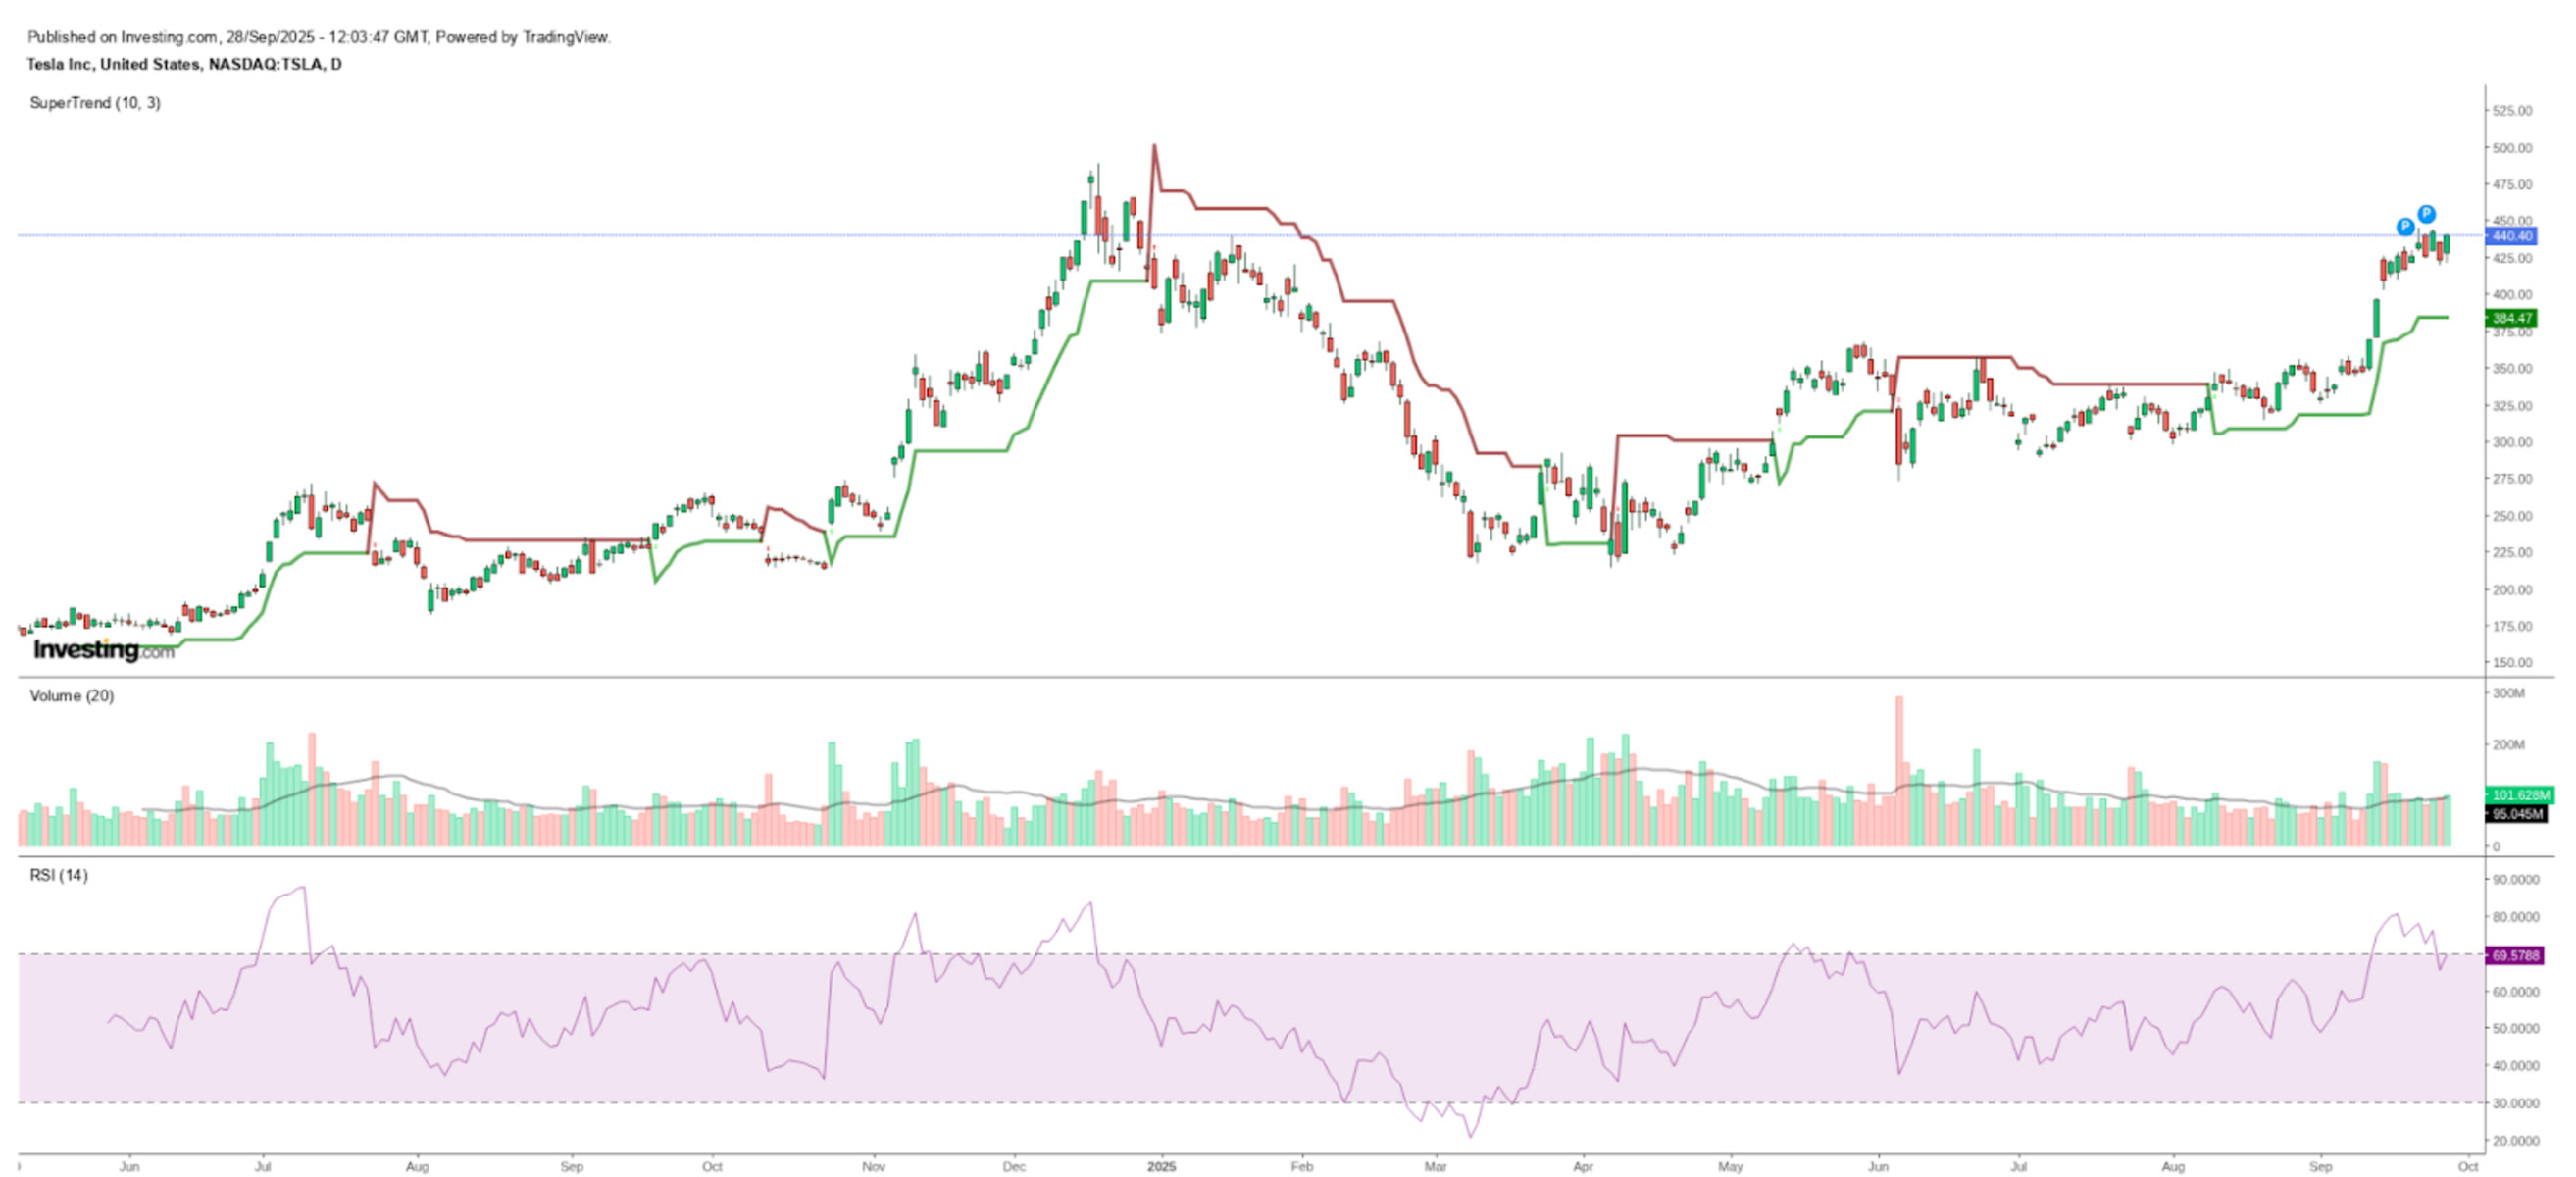
What Most Investors See: Tesla surging to $440.40 with strong momentum, breaking above multiple resistance levels—classic "FOMO" setup where the fear of missing out drives buying at elevated prices.
What WarrenAI Delivers:
The Big Picture: Tesla is in a parabolic uptrend that's showing dangerous signs of exhaustion. At $440.40, the stock is stretched 13.5% above its 20-day average and 25% above its 50-day average—like a rubber band pulled to its limit. Three consecutive days closing at the exact same price ($440.40) is a rare "stall pattern" signaling buyers have run out of ammunition. This is where experienced traders take profits while beginners typically buy the top.
The Setup Explained Simply:
Your Trading Options:
Option 1 - Wait for Pullback (Smarter Play):
Option 2 - Short the Exhaustion (High Risk):
Critical Levels to Watch:
What the Indicators Are Screaming:
The Key Lesson: When everyone's excited and prices are soaring, that's usually the worst time to buy. The "stall pattern" (three identical closes) is like a car engine sputtering at high speed—it often precedes a sharp pullback. Smart money is either taking profits or waiting for the inevitable dip to $390-405 to reload.
Bottom Line for Beginners: DO NOT chase this rally. Tesla at $440 is like joining a party at 3 AM—you've missed the fun and risk getting stuck with the cleanup. If you own it, consider taking some profits. If you want to buy, patience is your superpower—wait for the pullback to $400 with confirmation. The market rewards patience and punishes FOMO.
Risk Reality Check: With daily swings of $16 (4%), a $10,000 position can gain or lose $400 in a single day. At these overbought levels, the risk of a 10-15% correction ($44-66 drop) far outweighs the potential for another 10% gain. The math favors waiting, not chasing.
*Live response from September 28, 2025 - market conditions may have changed
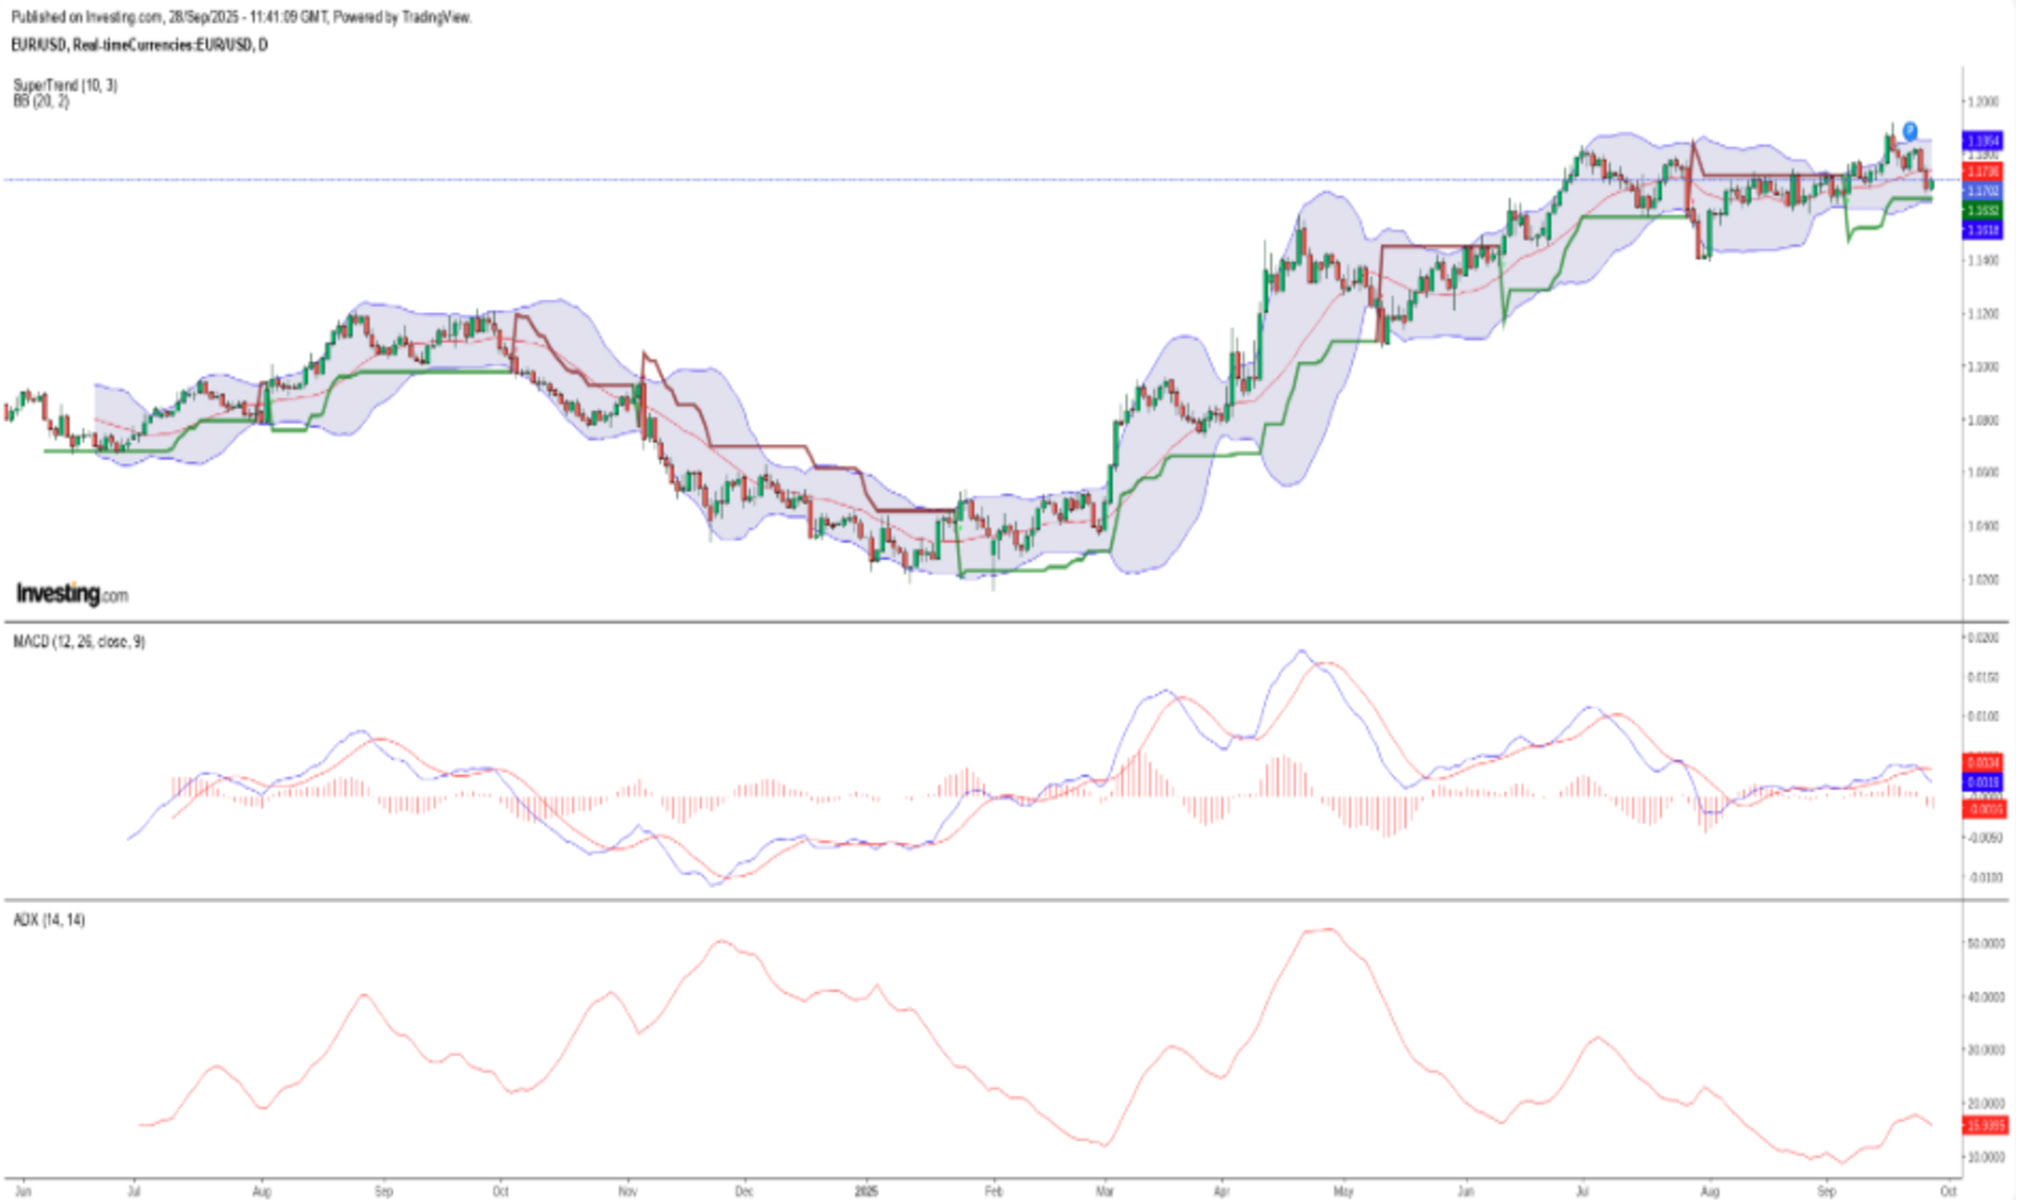
What Most Investors See: Price is breaking higher with green candles and upward momentum from 1.1650 to 1.1702, with news events marked along the way suggesting positive developments.The trend looks bullish and appears to be breaking above previous resistance, signaling a buying opportunity.
What WarrenAI Delivers:
The Big Picture: EUR/USD has rallied into a critical resistance zone at $1.1702-1.1715 where three technical barriers converge. The concerning part? This rally is happening on decreasing volume—like a car trying to climb a steep hill while running out of gas. This sets up a high-probability reversal scenario unless buyers show real conviction with a volume surge.
The Setup Explained:
Your Trading Options:
Option 1 - Bet on Reversal (Higher Probability):
Option 2 - Bet on Breakout (Lower Probability):
Critical Levels to Watch:
The Key Lesson: When price rises but fewer people are trading (low volume), it's like applause getting quieter during a performance—the show is probably ending. At major resistance levels, this usually means reversal, not breakout. Wait for the market to prove its direction rather than guessing.
Bottom Line for Beginners: This is a "wait and see" moment. The smart money isn't chasing this rally—they're either waiting for it to fail at resistance (to sell) or demanding proof of a real breakout with volume (to buy). Don't be the person buying at the top just because you see green candles.
*Live response from September 28, 2025 - market conditions may have changed
With less than 1% of day traders beating the market consistently[3][4], the difference often comes down to one thing: the ability to quickly understand what the market is telling you.
With WarrenAI, you get:
Ready to see what the pros see? WarrenAI Technical Analysis is now available for InvestingPro subscribers.
Subscribe now and discover how our AI can transform your trading with clear and objective analysis that makes all the difference in fast-moving markets
WarrenAI is part of Investing.com's suite of AI-powered tools, providing real-time analysis across 72,000+ financial instruments with over 1,400 premium metrics. Start your InvestingPro subscription today to access WarrenAI's full capabilities.
[1] Hoffmann, A. O., & Shefrin, H. (2014). Technical analysis and individual investors. Journal of Economic Behavior & Organization, 107, 487-511.
https://www.arvidhoffmann.nl/Hoffmann_Shefrin_2014.pdf
[2] https://www.sciencedirect.com/science/article/abs/pii/S0167268114001073
[3] Barber, B. M., Lee, Y. T., Liu, Y. J., & Odean, T. (2014). Do day traders rationally learn about their ability?
http://faculty.haas.berkeley.edu/odean/papers/day%20traders/Day%20Trading%20Skill%20110523.pdf
[4] https://www.quantifiedstrategies.com/day-trading-statistics/
Are you sure you want to block %USER_NAME%?
By doing so, you and %USER_NAME% will not be able to see any of each other's Investing.com's posts.
%USER_NAME% was successfully added to your Block List
Since you’ve just unblocked this person, you must wait 48 hours before renewing the block.
I feel that this comment is:
Thank You!
Your report has been sent to our moderators for review
Add a Comment
We encourage you to use comments to engage with users, share your perspective and ask questions of authors and each other. However, in order to maintain the high level of discourse we’ve all come to value and expect, please keep the following criteria in mind:
Perpetrators of spam or abuse will be deleted from the site and prohibited from future registration at Investing.com’s discretion.