Park Ha Biological Technology stock rises on upcoming ticker symbol change

CDW Corporation (NASDAQ:CDW) reported a significant turnaround in its first quarter 2025 results, with net sales increasing 6.7% year-over-year to $5.2 billion, according to the company’s May 7 webcast presentation. This marks a substantial improvement from the 3.5% sales decline reported in the third quarter of 2024, suggesting the technology solutions provider may be emerging from recent market challenges.
Quarterly Performance Highlights
CDW’s Q1 2025 financial results showed broad-based improvement across key metrics. The company reported non-GAAP earnings per diluted share of $2.15, representing an 11.9% increase from the prior year. Operating income grew 10.2% to $361 million, while non-GAAP operating income increased 10.0% to $444 million.
"Our first quarter results demonstrate the strength of our business model and our ability to execute in a challenging environment," said Chris Leahy, CEO of CDW Corporation, during the presentation.
As shown in the comprehensive financial results below, CDW achieved growth across most key metrics despite a slight compression in gross profit margin:
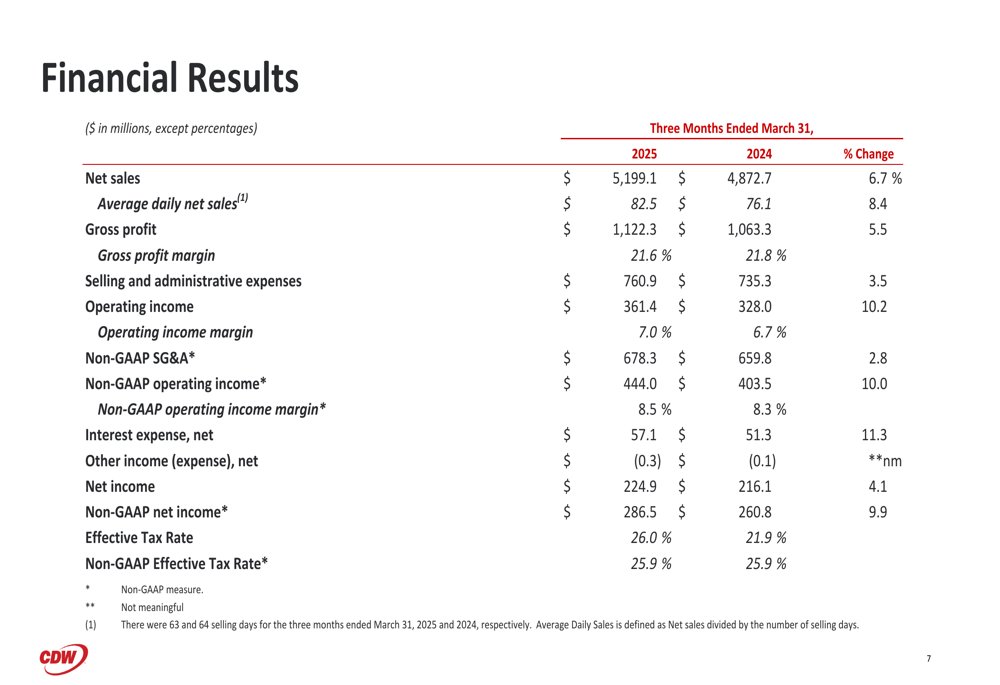
While gross profit increased 5.5% to $1.1 billion, the gross profit margin decreased slightly to 21.6%, down 20 basis points from 21.8% in the prior year. This modest margin compression appears consistent with competitive pressures noted in previous earnings calls, where CEO Chris Leahy described "irrational pricing" affecting margins across the industry.
Segment Performance Analysis
The company’s segment performance revealed significant variations across customer channels. Healthcare emerged as the standout performer with a remarkable 17.7% year-over-year growth (19.5% on an average daily sales basis). Education also showed strong momentum with 9.3% growth, while the government segment continued to struggle, declining 1.0% compared to the prior year.
The detailed breakdown of net sales by channel demonstrates the company’s diverse customer base and varying growth patterns:
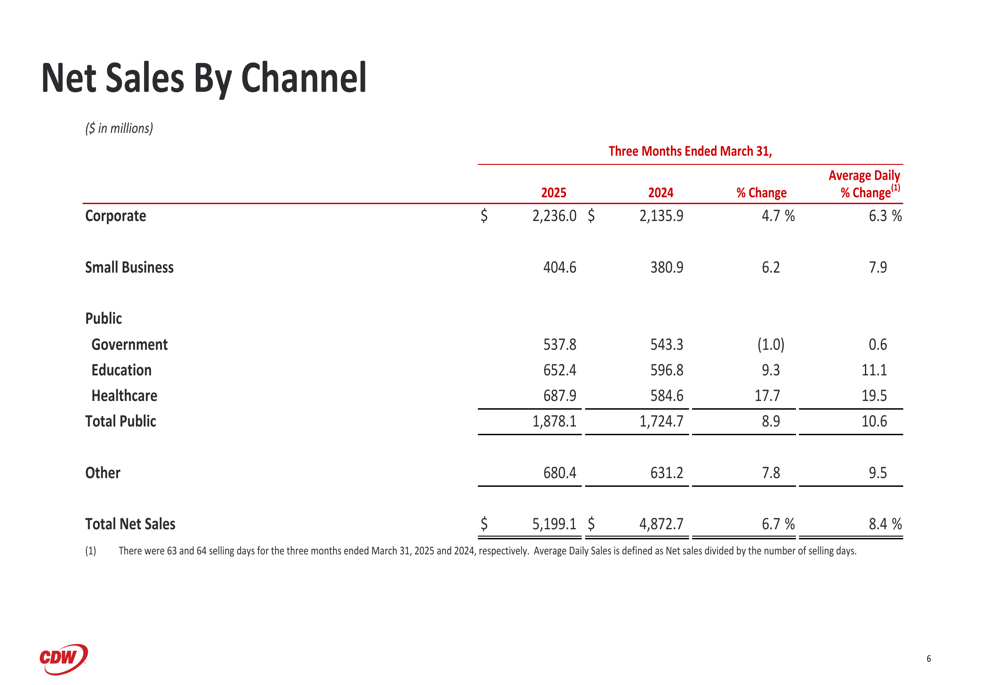
The corporate segment, which represents CDW’s largest customer channel at $2.2 billion, grew 4.7% year-over-year (6.3% on an average daily sales basis). Small business showed healthy growth of 6.2%, while the "Other" category, which includes international operations, increased 7.8%.
The strong performance in healthcare represents a significant shift from previous quarters, potentially indicating increased technology investments in this sector. Meanwhile, the continued weakness in government sales aligns with the 12% decline reported in the third quarter of 2024.
Financial Position and Capital Allocation
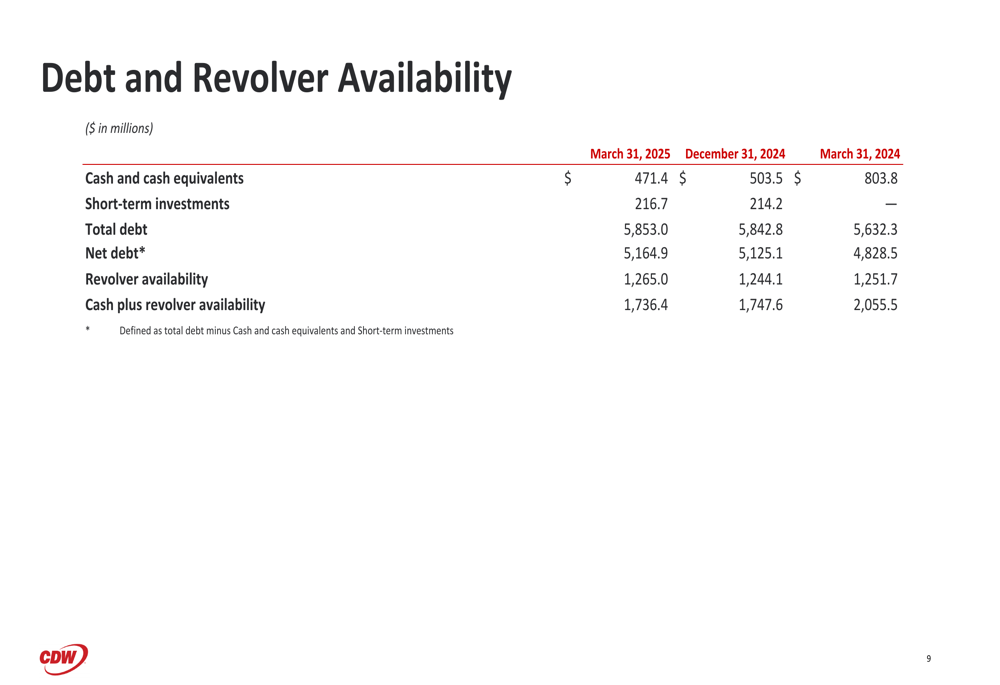
CDW maintained a solid financial position with $471.4 million in cash and cash equivalents as of March 31, 2025. The company reported total debt of $5.85 billion and a net leverage ratio of 2.5x, within its target range of 2.0-3.0x.
The company’s debt profile and liquidity position are illustrated in the following slide:
Free cash flow for the quarter was $260.3 million, down from $410.5 million in the prior year, primarily due to lower net cash provided by operating activities. Adjusted free cash flow, which accounts for changes in accounts payable related to inventory financing, was $248.8 million compared to $364.4 million in Q1 2024.
CDW’s capital allocation strategy remains focused on balancing shareholder returns with strategic investments. The company outlined its priorities as follows:
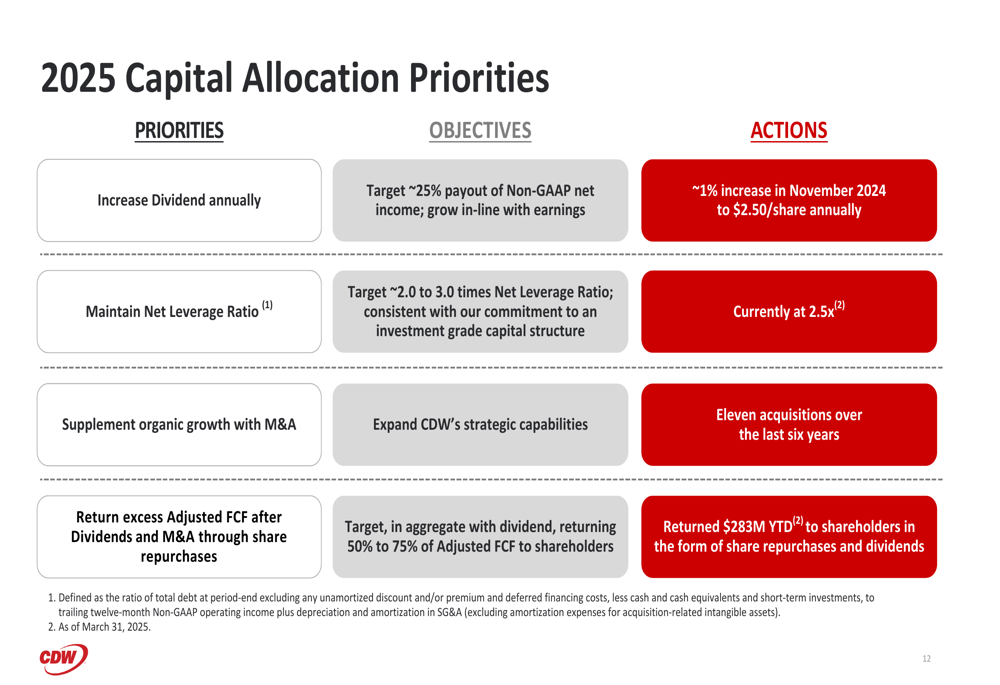
The company reported returning $283 million to shareholders year-to-date through share repurchases and dividends, consistent with its target of returning 50% to 75% of adjusted free cash flow to shareholders. CDW increased its dividend by approximately 1% in November 2024 to $2.50 per share annually, targeting a payout ratio of about 25% of non-GAAP net income.
Forward-Looking Statements
Despite the strong Q1 performance, CDW maintained a relatively cautious outlook for the full year 2025. The company expects customer spending to exceed U.S. IT growth by approximately 200 to 300 basis points, with low-single digit growth projected for both gross profit and non-GAAP earnings per diluted share.
The company’s 2025 outlook is summarized in the following slide:
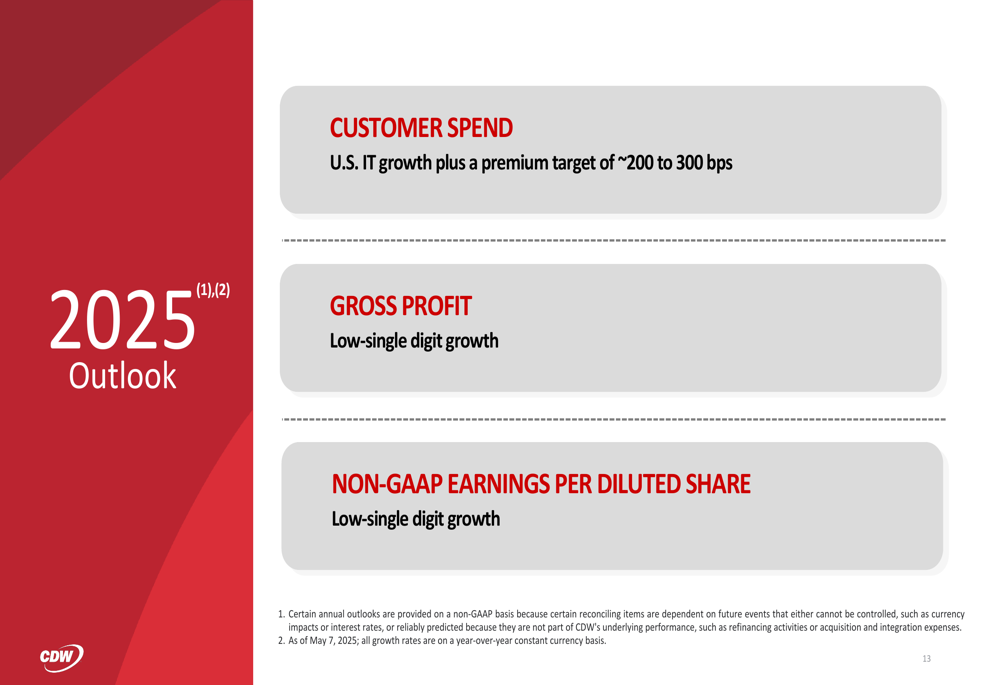
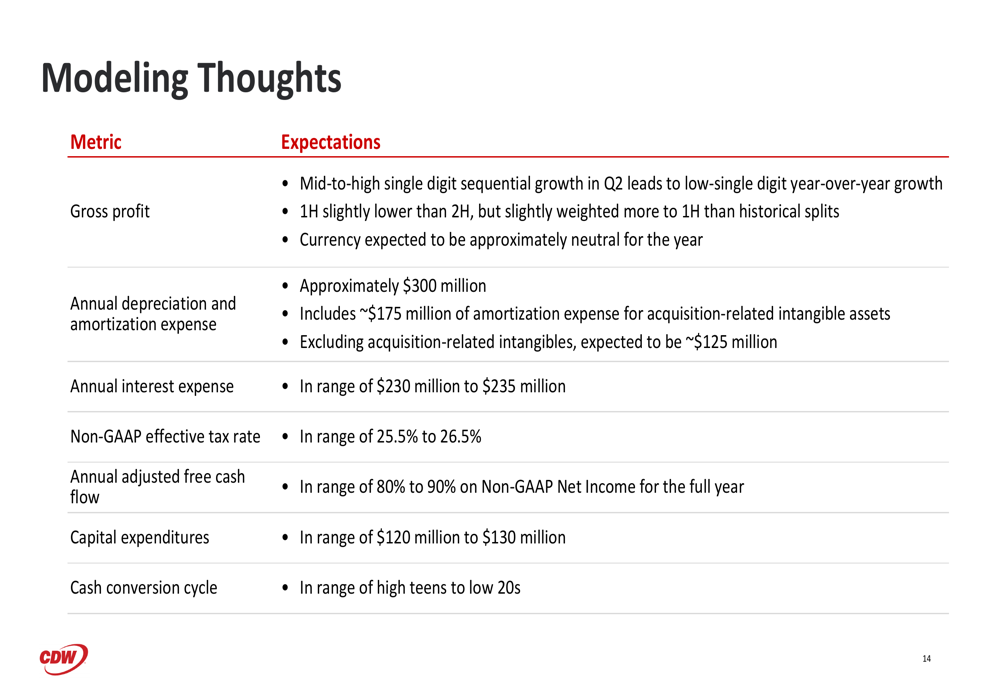
For the second quarter, CDW anticipates mid-to-high single digit sequential growth in gross profit, leading to low-single digit year-over-year growth. The company expects the first half of the year to be slightly lower than the second half, but slightly more weighted to the first half than historical patterns.
Additional modeling guidance included:
- Annual depreciation and amortization expense of approximately $300 million
- Annual interest expense in the range of $230-235 million
- Non-GAAP effective tax rate between 25.5% and 26.5%
- Capital expenditures between $120-130 million
The cautious full-year outlook suggests management remains mindful of potential market challenges despite the strong first quarter performance. This approach aligns with the company’s commentary from previous quarters about navigating a challenging IT spending environment.
CDW’s stock closed at $163.93 on May 6, 2025, down 1.1% for the day. However, the stock was up 1.83% in premarket trading following the earnings presentation, indicating a positive initial market reaction to the Q1 results.
Full presentation:
This article was generated with the support of AI and reviewed by an editor. For more information see our T&C.