Microsoft sued by Australia competition regulator over Copilot, 365 pricing

NetScout Systems Inc (NASDAQ:NTCT) presented its first quarter fiscal year 2026 financial results on August 7, 2025, showcasing solid year-over-year growth across key metrics despite a challenging macroeconomic environment. The network and security solutions provider reported a 7% increase in total revenue and a 21% jump in non-GAAP earnings per share, with particularly strong performance in its cybersecurity business and enterprise customer segment.
Quarterly Performance Highlights
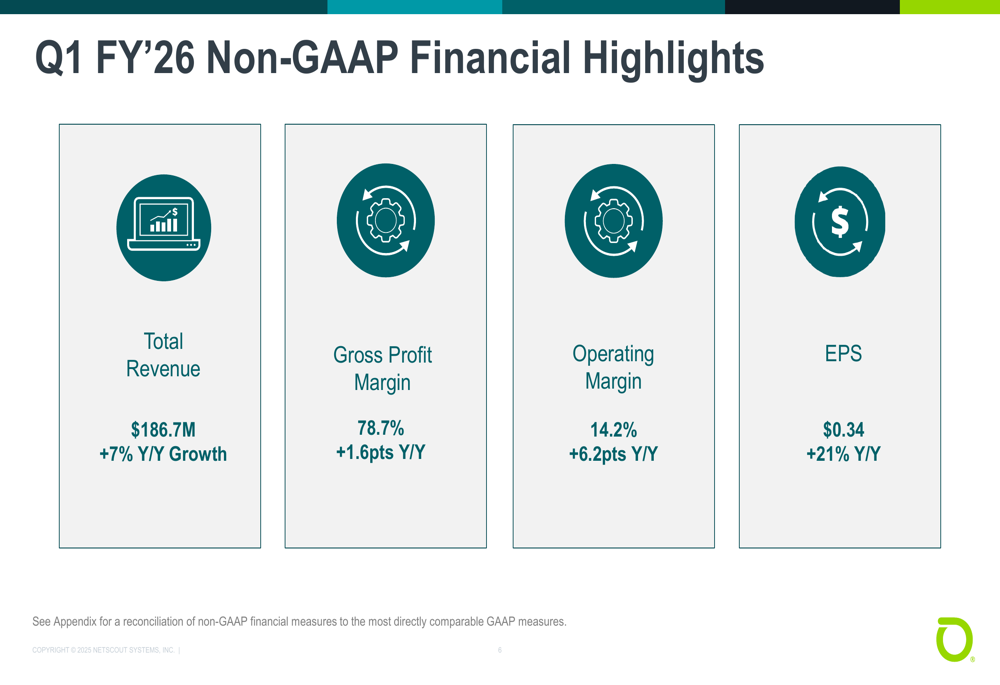
NetScout delivered total revenue of $186.7 million for the quarter ended June 30, 2025, representing a 7% increase compared to the same period last year. Non-GAAP gross profit margin improved to 78.7%, up 1.6 percentage points year-over-year, while non-GAAP operating margin saw a substantial improvement of 6.2 percentage points to reach 14.2%. These enhancements helped drive non-GAAP earnings per share to $0.34, a 21% increase from Q1 FY’25.
As shown in the following financial highlights chart, the company demonstrated growth across all key non-GAAP metrics:
Despite these positive results, NetScout’s stock was down 3.71% in trading on the day of the announcement, suggesting investors may have had higher expectations or were focused on other aspects of the company’s performance and outlook.
Detailed Financial Analysis
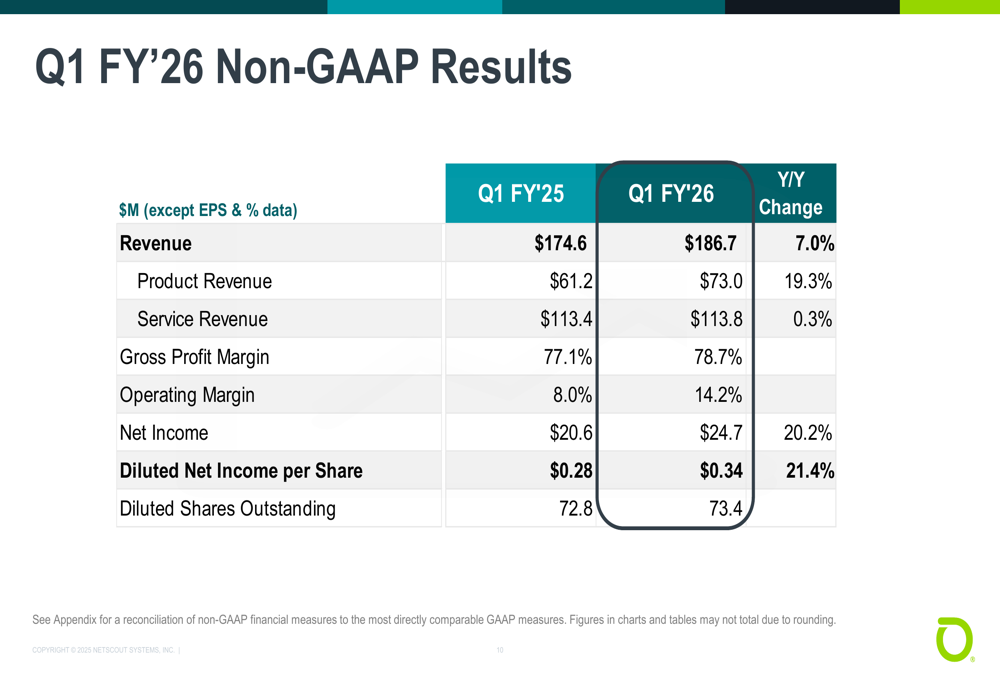
A closer examination of NetScout’s Q1 FY’26 results reveals significant variations in performance across product lines and customer segments. Product revenue showed robust growth of 19.3% year-over-year, reaching $73.0 million, while service revenue remained essentially flat at $113.8 million, up just 0.3%.
The following table provides a comprehensive breakdown of NetScout’s non-GAAP financial results:
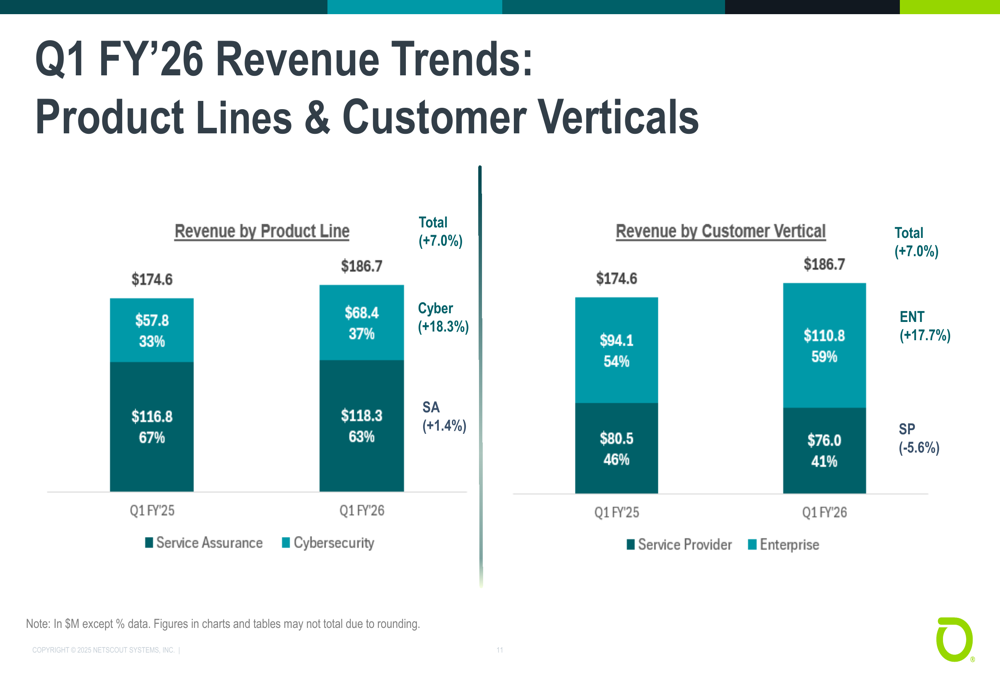
By product line, the company’s cybersecurity offerings demonstrated strong momentum, growing 18.3% year-over-year to $68.4 million and accounting for 37% of total revenue. The larger Service Assurance segment, which represents 63% of revenue, showed more modest growth of 1.4% to reach $118.3 million.
The company’s performance also varied significantly by customer vertical, with the Enterprise segment growing 17.7% to $110.8 million (59% of total revenue), while the Service Provider segment declined 5.6% to $76.0 million (41% of total revenue).
The following chart illustrates these revenue trends by product line and customer vertical:
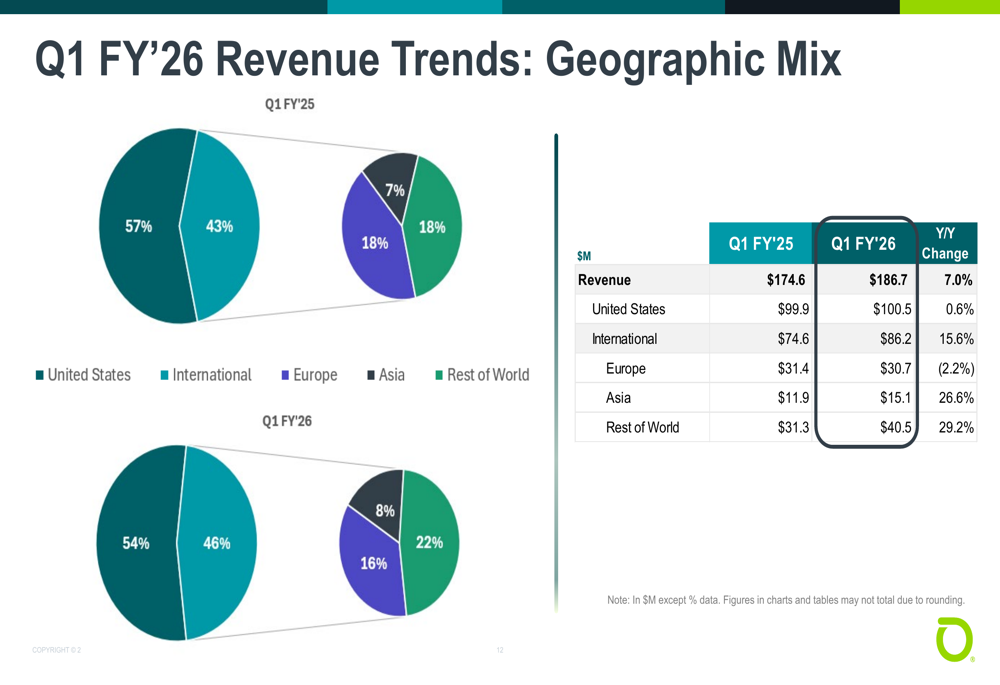
From a geographic perspective, NetScout saw varied performance across regions. The following chart shows the company’s revenue distribution by geography:
Financial Position and Cash Flow
NetScout maintained a strong financial position in Q1 FY’26, with $543.5 million in cash and securities and no long-term debt. The company generated robust operating cash flow of $73.6 million and free cash flow of $71.7 million during the quarter, demonstrating effective cash management and operational efficiency.
The following chart details key balance sheet metrics and cash flow figures:
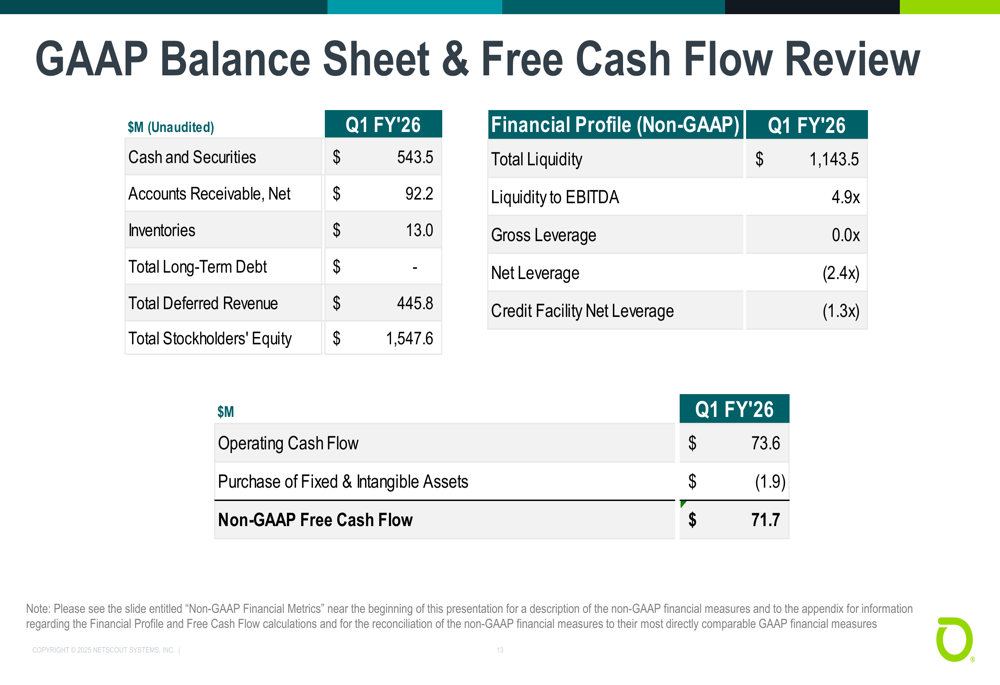
This strong cash position provides NetScout with significant financial flexibility to invest in growth initiatives, pursue strategic acquisitions, or return capital to shareholders through share repurchases.
Strategic Initiatives
During the presentation, NetScout emphasized its focus on the intersection of service assurance and cybersecurity as key drivers of its business strategy. The company highlighted its commitment to driving product innovation, returning to annual revenue growth, and enhancing margins through disciplined cost management.
The significant outperformance of the cybersecurity segment (+18.3% growth) compared to service assurance (+1.4% growth) suggests that NetScout’s strategic emphasis on security solutions is yielding positive results, particularly in the enterprise market where the company saw 17.7% growth.
Forward-Looking Statements
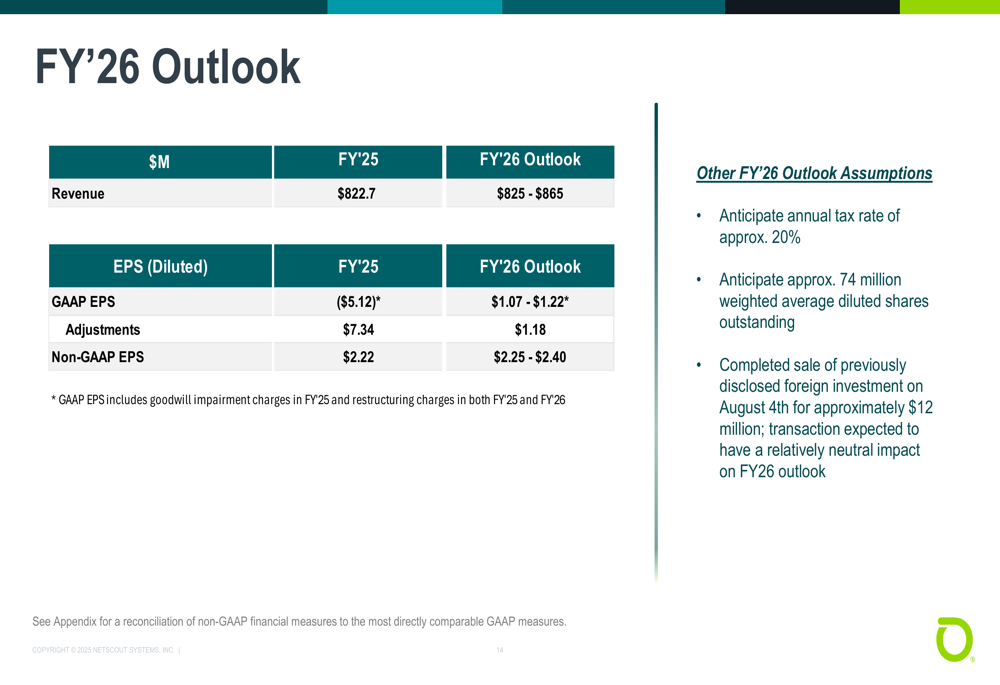
Looking ahead, NetScout reaffirmed its fiscal year 2026 outlook, projecting revenue between $825 million and $865 million, compared to $822.7 million in FY’25. The company expects non-GAAP earnings per share between $2.25 and $2.40, representing modest growth from the $2.22 reported in FY’25.
The following chart outlines NetScout’s financial outlook for FY’26:
Management expressed cautious optimism about the company’s prospects while acknowledging ongoing macroeconomic uncertainty. The company remains committed to delivering mission-critical solutions that address performance issues, ensure availability, and safeguard security for its customers.
This outlook represents a recovery from FY’25, when the company experienced a slight revenue decline of 0.8%. The projected growth is modest but indicates management’s confidence in the company’s ability to capitalize on opportunities in both the service assurance and cybersecurity markets, particularly within the enterprise segment which showed strong growth in Q1.
NetScout’s next investor event will be the B. Riley Securities Consumer & TMT Conference on September 10, 2025, in New York City, where management will likely provide additional insights into the company’s strategy and market outlook.
Full presentation:
This article was generated with the support of AI and reviewed by an editor. For more information see our T&C.