TSX gains after CPI shows US inflation rose 3%

Introduction & Market Context
Northrop Grumman Corporation (NYSE:NOC) presented its third quarter 2025 financial results on October 21, showing strong earnings growth despite mixed revenue performance. The defense contractor reported earnings per share of $7.67, significantly exceeding analyst expectations of $6.46, representing an 18.73% positive surprise. However, revenue of $10.42 billion fell short of the forecasted $10.71 billion, contributing to a 1.83% decline in pre-market trading.
The company’s presentation highlighted its performance amid what CEO Kathy Warden described as "an unprecedented demand environment," with a book-to-bill ratio of 1.17x for the quarter, indicating strong future revenue potential. Despite the revenue miss, Northrop Grumman raised its full-year EPS guidance while slightly lowering its sales outlook.
Quarterly Performance Highlights
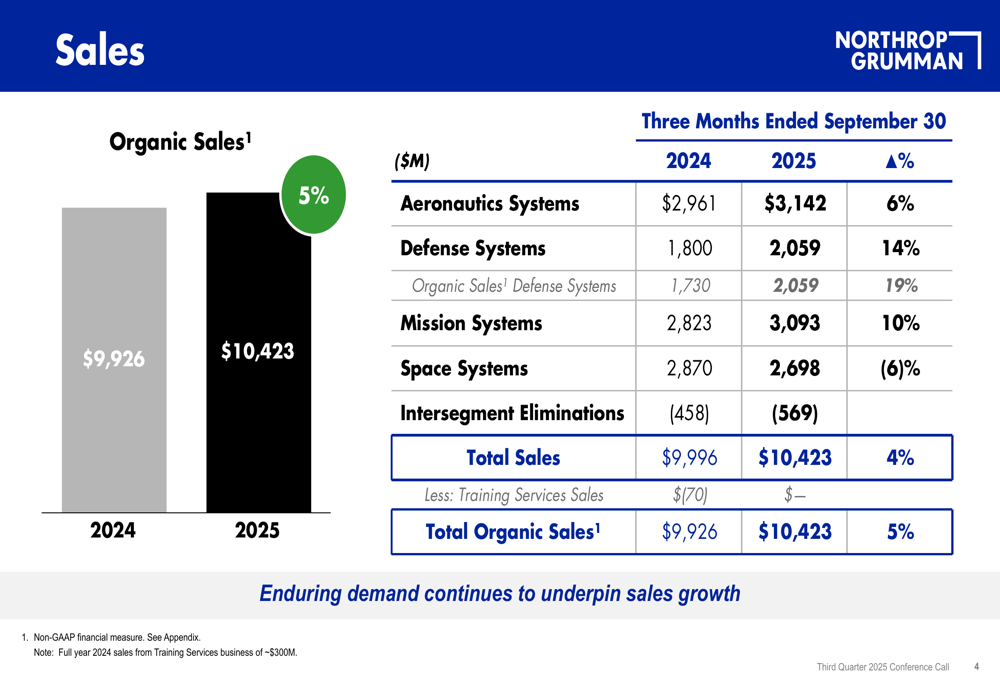
Northrop Grumman delivered organic sales growth of 5% year-over-year for Q3 2025, reaching $10.42 billion. More impressively, the company expanded its segment operating margin rate to 12.3%, up from 11.5% in the same period last year, demonstrating improved operational efficiency.
As shown in the following sales performance chart, the company saw varied results across its business segments:
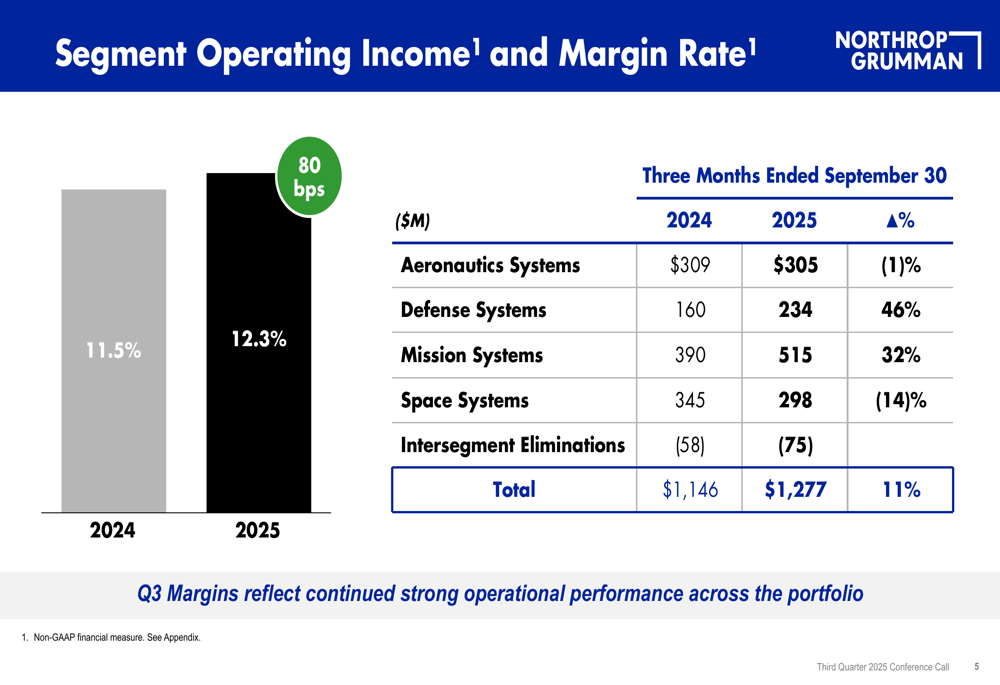
Total segment operating income increased by 11% year-over-year to $1.28 billion, with the margin improvement reflecting what the company called "continued strong operational performance across the portfolio." The detailed segment margin performance is illustrated in this chart:
Diluted earnings per share grew from $7.00 in Q3 2024 to $7.67 in Q3 2025, a 10% increase. The company’s presentation broke down the key contributors to this EPS growth:
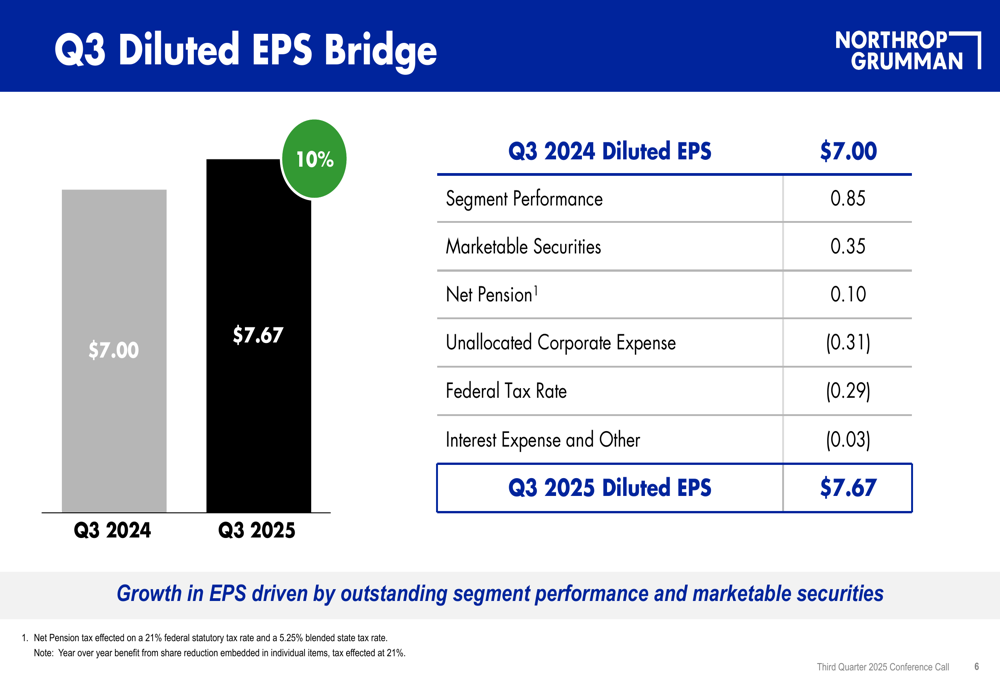
As the EPS bridge illustrates, segment performance contributed $0.85 to the year-over-year EPS growth, while marketable securities added $0.35. These positive factors were partially offset by increased unallocated corporate expenses (-$0.31) and a higher federal tax rate (-$0.29).
Segment Analysis
Northrop Grumman’s performance varied significantly across its four business segments. Defense Systems and Mission Systems delivered exceptional results, while Space Systems faced challenges and Aeronautics Systems showed mixed performance.
Defense Systems posted the strongest growth, with sales increasing 14% year-over-year to $2.06 billion. Even more impressive was the segment’s 46% jump in operating income to $234 million. On an organic basis, Defense Systems sales grew 19% when excluding the divested Training Services business.
Mission Systems also performed well, with sales up 10% to $3.09 billion and operating income surging 32% to $515 million. This segment now delivers the highest absolute operating income among all business units.
Aeronautics Systems saw 6% sales growth to $3.14 billion, though operating income declined slightly by 1% to $305 million. The most challenging area was Space Systems, which experienced a 6% sales decline to $2.70 billion and a 14% drop in operating income to $298 million.
Updated Guidance and Outlook
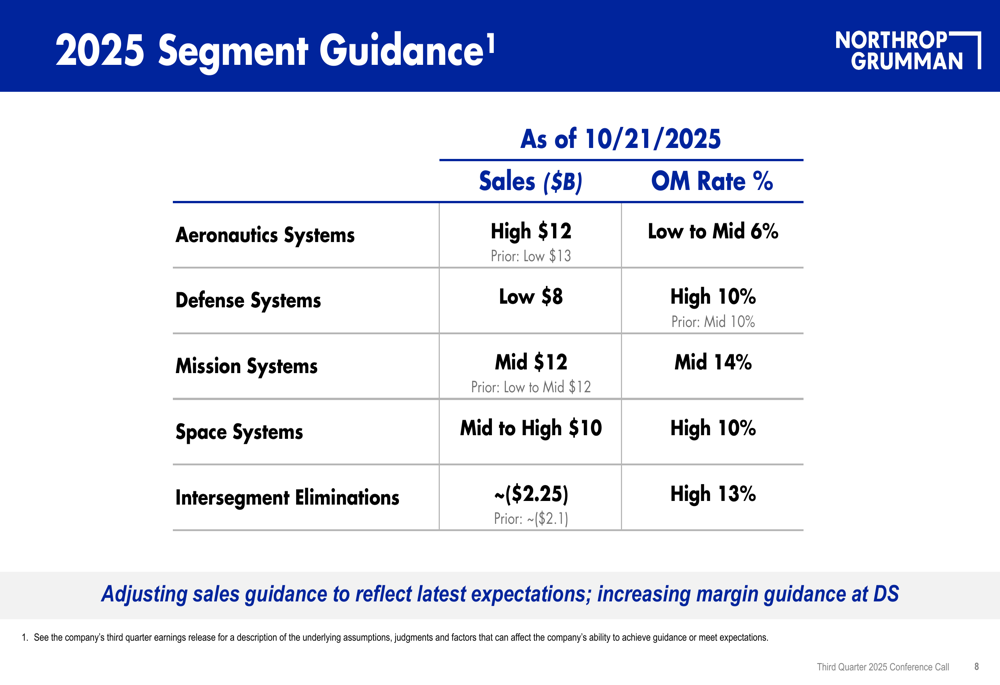
Northrop Grumman adjusted its full-year 2025 guidance, lowering its sales expectations while raising its earnings outlook. The updated company-level guidance is shown here:
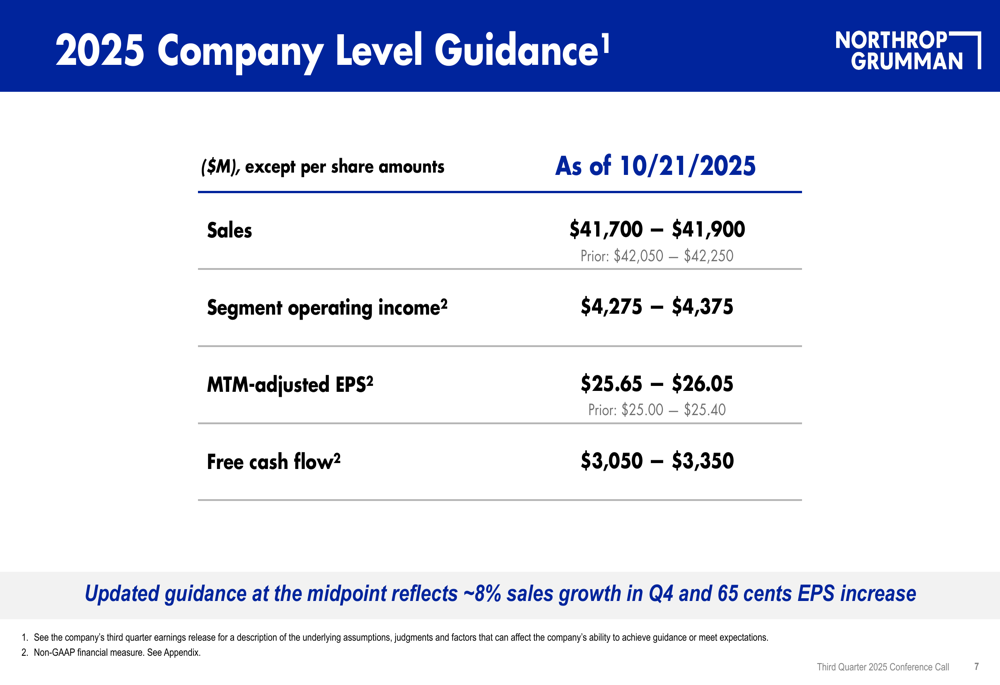
The revised sales guidance of $41.7-$41.9 billion represents a reduction from the previous range of $42.05-$42.25 billion. However, the company increased its MTM-adjusted EPS guidance by $0.65 to a range of $25.65-$26.05, reflecting improved profitability expectations. Free cash flow guidance remained unchanged at $3.05-$3.35 billion.
At the segment level, Northrop Grumman provided the following updated outlook:
Looking ahead to 2026, the company projects continued growth and profitability improvement:
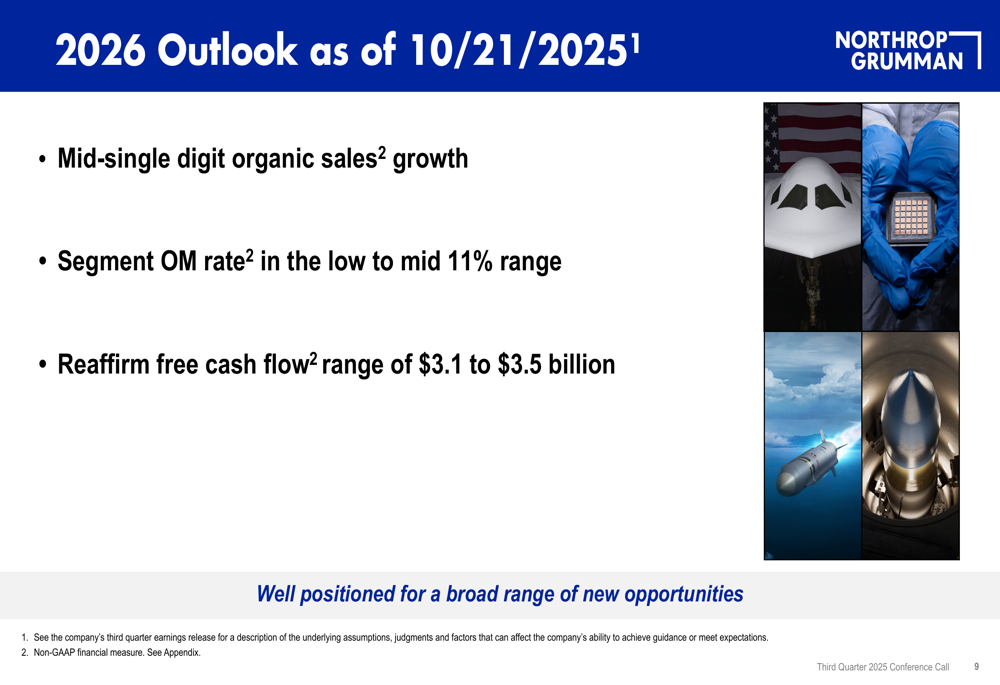
The 2026 outlook includes mid-single-digit organic sales growth and segment operating margin in the low to mid-11% range, with free cash flow expected between $3.1 and $3.5 billion.
Strategic Positioning
Northrop Grumman emphasized its strategic positioning in a dynamic global defense landscape that presents significant growth opportunities. The company highlighted its commitment to accelerating the development and production of new capabilities, supported by a diverse portfolio and strong backlog.
As summarized in the presentation’s conclusion:
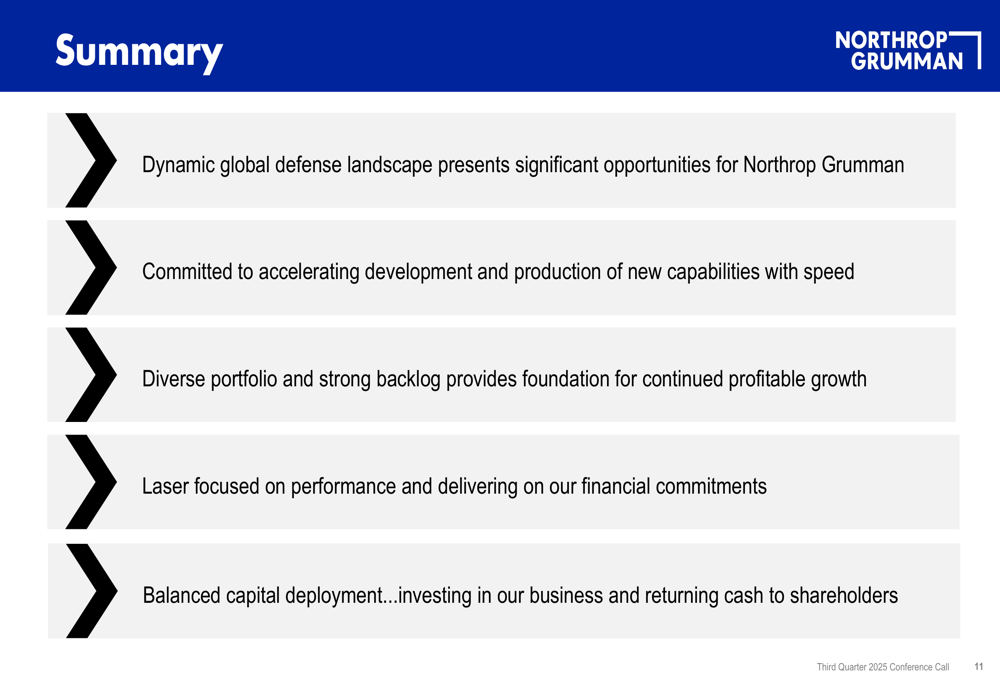
The company’s balanced capital deployment approach focuses on both investing in business growth and returning cash to shareholders. This strategy appears to be yielding results in terms of profitability, even as revenue growth faces some headwinds.
Despite the revenue miss and subsequent stock decline, Northrop Grumman’s financial fundamentals remain strong. The company maintains an impressive 27% return on equity and low price volatility with a beta of 0.1, according to market data. With a market capitalization of $86.27 billion and trading at $591 in pre-market activity, the stock remains well above its 52-week low of $426.24, though below its high of $640.90.
The company’s ability to expand margins and raise earnings guidance despite revenue challenges suggests effective cost management and operational efficiency. However, investors will likely monitor whether Northrop Grumman can address the revenue shortfall and return to growth across all segments, particularly in the underperforming Space Systems division.
Full presentation:
This article was generated with the support of AI and reviewed by an editor. For more information see our T&C.