U.S. stocks rise on Fed cut bets; earnings continue to flow

Introduction & Market Context
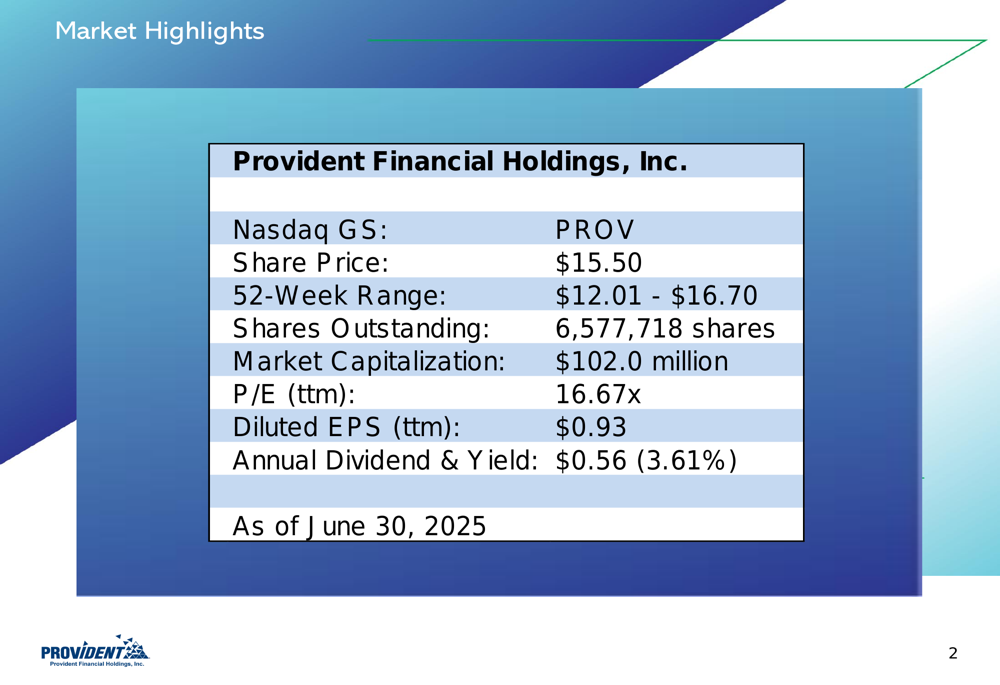
Provident Financial Holdings (NASDAQ:PROV) released its fourth quarter fiscal 2025 results presentation on July 29, 2025, revealing a sequential decline in quarterly performance while maintaining solid asset quality and capital ratios. The Riverside County-based community bank reported results for the quarter ended June 30, 2025, with shares trading at $15.50, within its 52-week range of $12.01 to $16.70.
The bank, which holds the distinction of being the largest independent community bank headquartered in Riverside County, California, operates 14 branches throughout the region and maintains the second largest deposit market share among community banks in its primary market.
As shown in the following market highlights chart, Provident Financial (LON:VANQ) currently maintains a market capitalization of $102.0 million, a price-to-earnings ratio of 16.67x, and offers an annual dividend yield of 3.61%.
Quarterly Performance Highlights
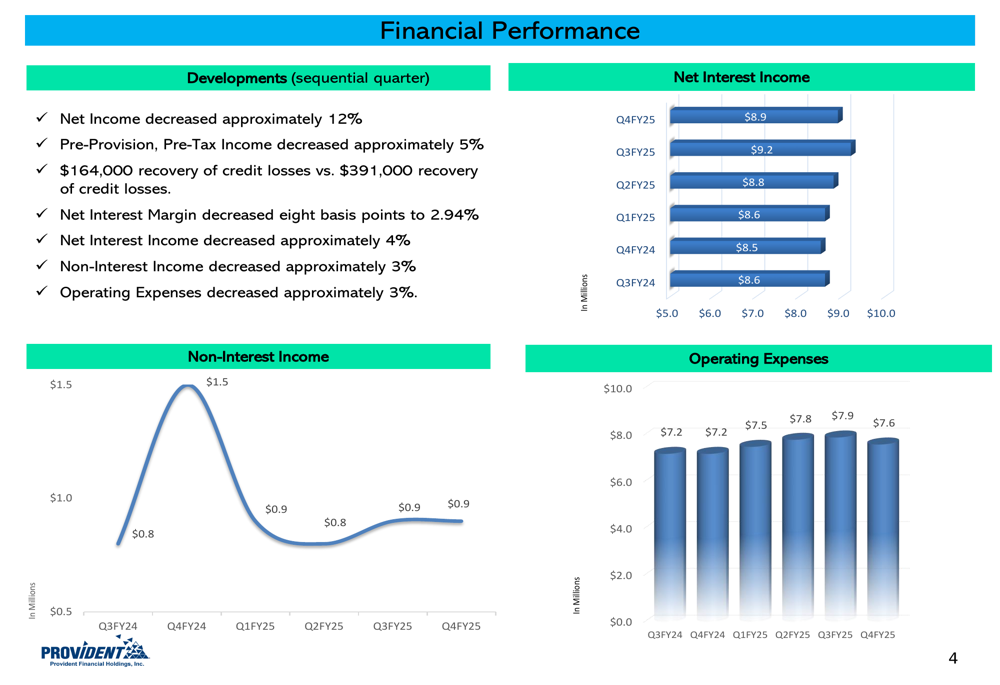
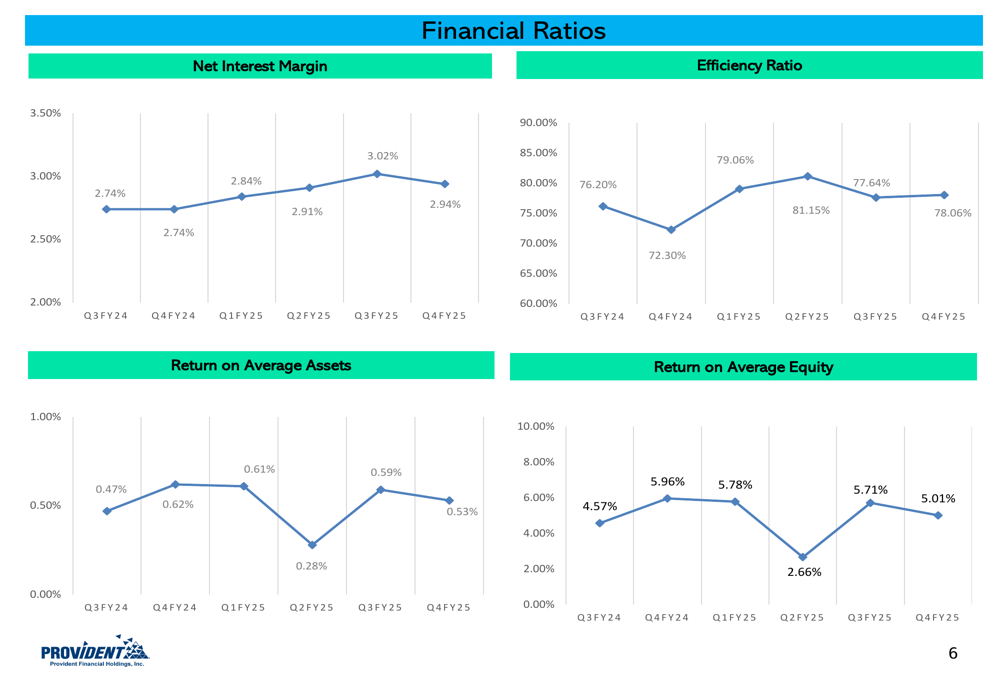
Provident Financial reported a 12% sequential decrease in net income for the fourth quarter of fiscal 2025, with pre-provision, pre-tax income declining approximately 5% compared to the previous quarter. The bank’s net interest margin contracted by eight basis points to 2.94%, contributing to a 4% decrease in net interest income.
The following chart illustrates the quarterly trends in net interest income, non-interest income, and operating expenses over the past six quarters, showing the recent pressure on revenue streams despite a corresponding 3% reduction in operating expenses.
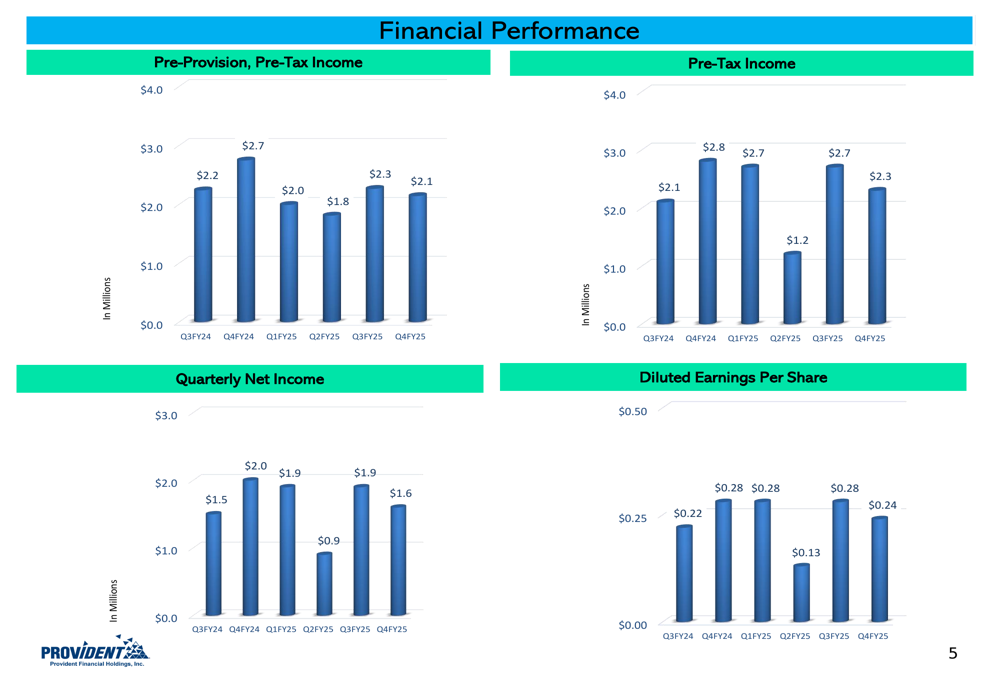
This decline in performance metrics is further reflected in the bank’s earnings trajectory. As shown in the chart below, quarterly net income decreased to $1.6 million in Q4 FY2025 from $1.9 million in the previous quarter, with diluted earnings per share declining to $0.24 from $0.28.
Loan Portfolio and Asset Quality
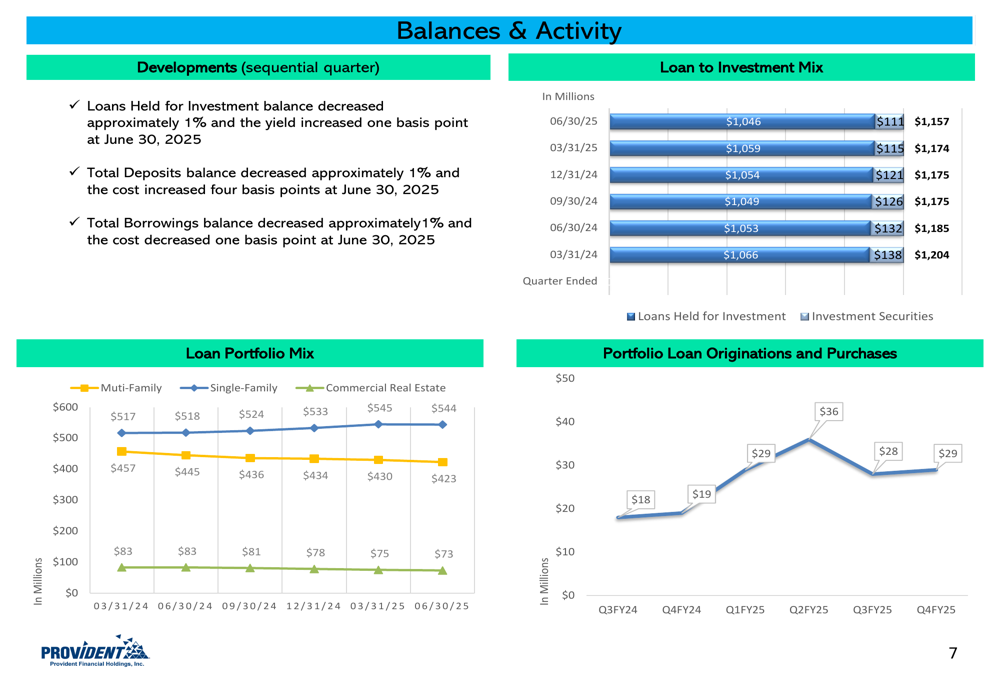
Provident Financial’s total loans held for investment decreased to $1.046 billion as of June 30, 2025, down from $1.059 billion at the end of the previous quarter. The bank’s investment securities portfolio continued its planned reduction, decreasing to $111 million from $115 million in the prior quarter.
The following chart shows the composition of the bank’s earning assets over the past six quarters, illustrating the gradual reduction in investment securities while maintaining a relatively stable loan portfolio.
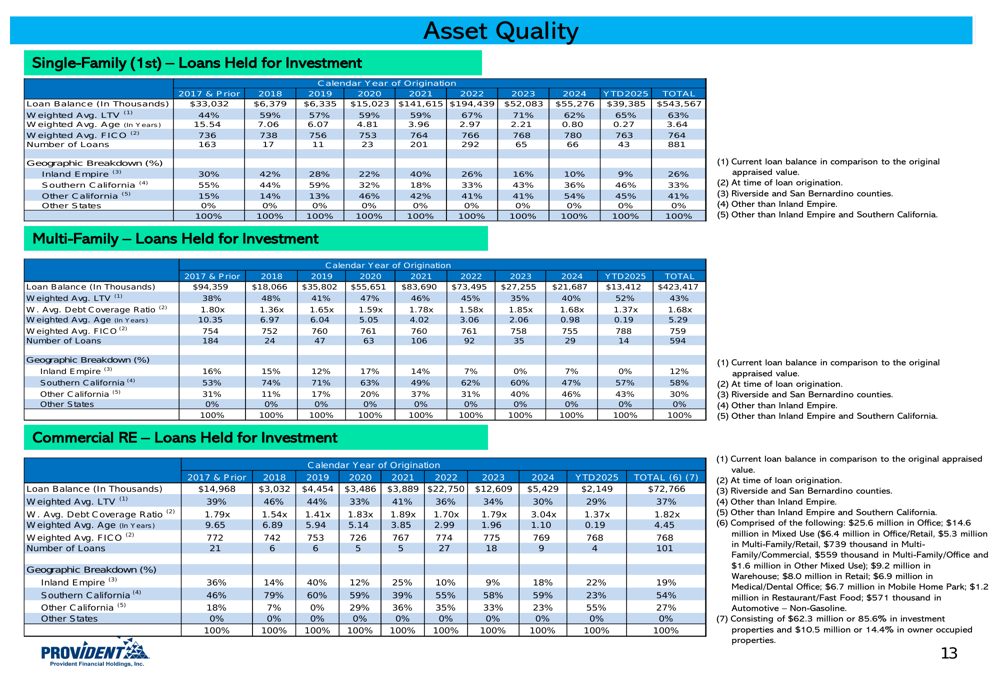
Multi-family loans remain the largest component of Provident’s loan portfolio at 52%, followed by single-family residential loans at 41%, as illustrated in the composition breakdown below. The weighted average interest rate on the total loan portfolio stood at 5.16% as of June 30, 2025, up from 5.02% a year earlier.
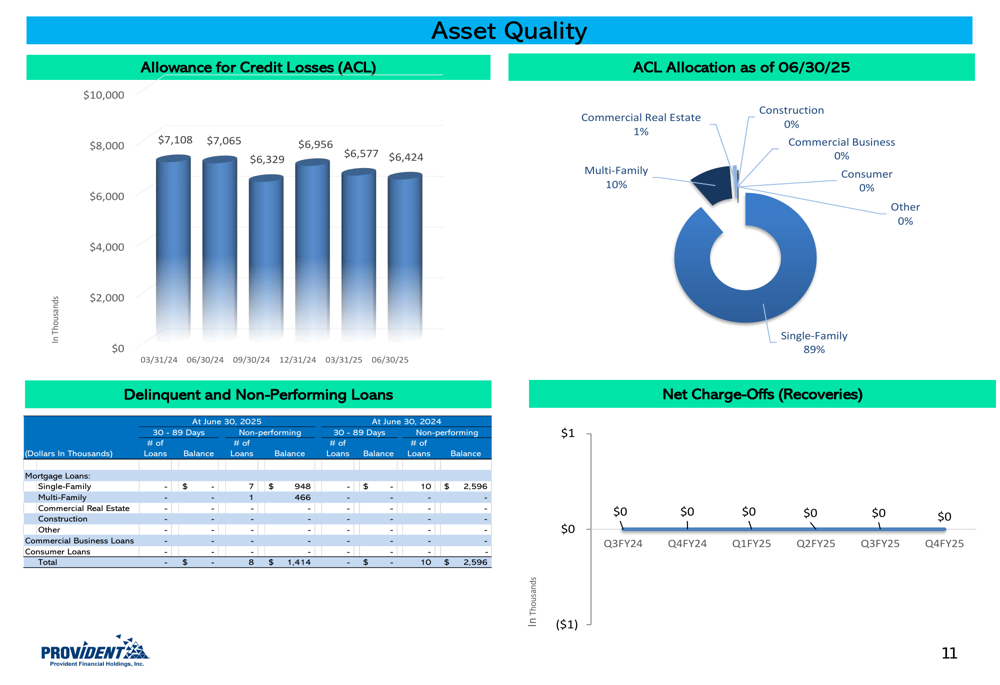
Despite the challenging economic environment, Provident Financial has maintained strong asset quality metrics. The bank’s non-performing assets to total assets ratio remained unchanged at 0.11% compared to the previous quarter, significantly improved from 0.20% a year earlier. The bank recorded a $164,000 recovery of credit losses in the fourth quarter.
The chart below shows the trend in non-performing assets and the allowance for credit losses over the past six quarters, demonstrating the bank’s consistent improvement in asset quality.
Geographically, Provident’s loan portfolio remains concentrated in California, with 44% in Southern California (excluding the Inland Empire), 36% in other California regions, and 20% in the Inland Empire, as shown in the following breakdown.
Capital Position and Outlook
Provident Financial continues to maintain strong capital ratios, with all regulatory capital measures showing improvement both sequentially and year-over-year. As of June 30, 2025, the bank reported a Tier 1 Leverage Ratio of 10.11%, up from 9.85% in the previous quarter and 10.02% a year earlier.
The following chart illustrates the bank’s capital ratios over the past six quarters, highlighting its strong capital position relative to regulatory requirements.
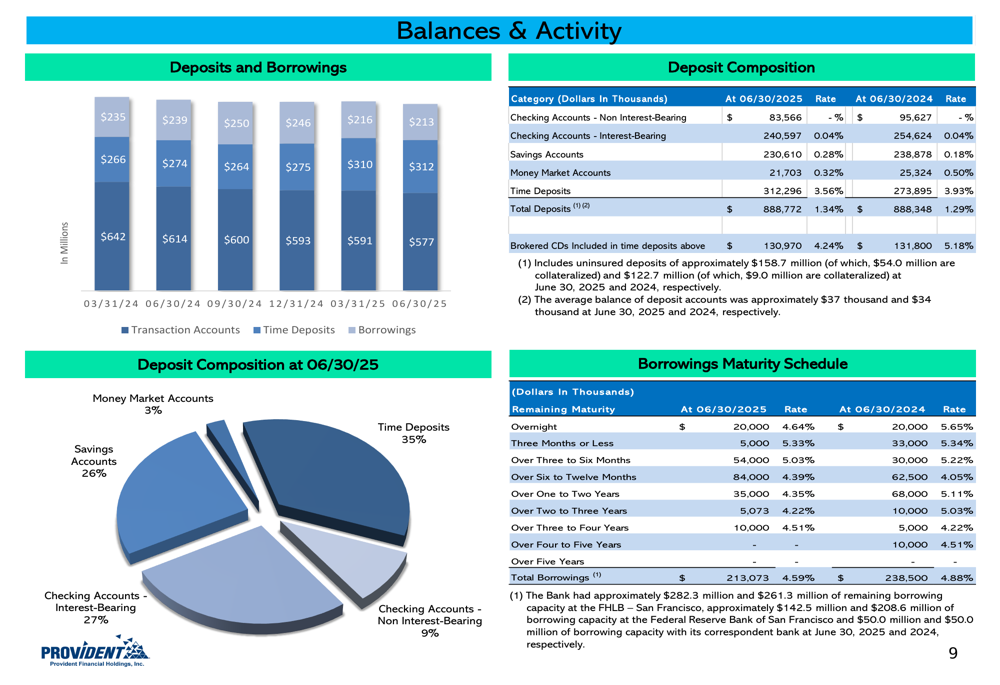
The bank’s deposit base remained stable at $888.8 million as of June 30, 2025, virtually unchanged from $888.3 million a year earlier. The average cost of deposits increased marginally to 1.34% from 1.29% a year ago, reflecting the higher interest rate environment.
Provident’s deposit composition includes 35% in time deposits, 27% in interest-bearing checking accounts, 26% in savings accounts, 9% in non-interest-bearing checking accounts, and 3% in money market accounts, providing a diversified and stable funding base.

While the sequential decline in earnings performance presents challenges, Provident Financial’s strong capital position, improved asset quality, and stable funding base provide a solid foundation for navigating the current economic environment. The bank’s continued focus on its core markets in Southern California and its conservative approach to credit risk management should help position it for sustainable performance as market conditions evolve.
Full presentation:
This article was generated with the support of AI and reviewed by an editor. For more information see our T&C.