Street Calls of the Week
- Bitcoin crashes below key support, dragging altcoins down.
- Ethereum struggles to find support after initial ETF hype fades.
- Solana, BNB face crucial tests as overall market sentiment weakens.
- Unlock AI-powered Stock Picks for Under $8/Month: Summer Sale Starts Now!
The cryptocurrency market continues its relentless slide, with major coins like Bitcoin tumbling sharply since yesterday. Heavy trading volume accompanied these losses as key support levels were broken across the board.
Bitcoin, in particular, suffered a brutal breakdown today. The daily candle closed decisively below the critical $60,000 support zone, a level that had held firm since March. This aggressive plunge by the leading cryptocurrency raises serious questions about where buyers will find their next line in the sand.
The pain extends beyond Bitcoin. Ethereum, Solana, and BNB, all major altcoins with significant market capitalization, have fallen alongside their leader. However, these altcoins are historically known for their higher volatility, which could also translate into faster recoveries. Identifying new support levels for these altcoins becomes even more critical in this environment as they attempt to regain their footing.
1. Ethereum Retreats After Initial ETF Approval Surge
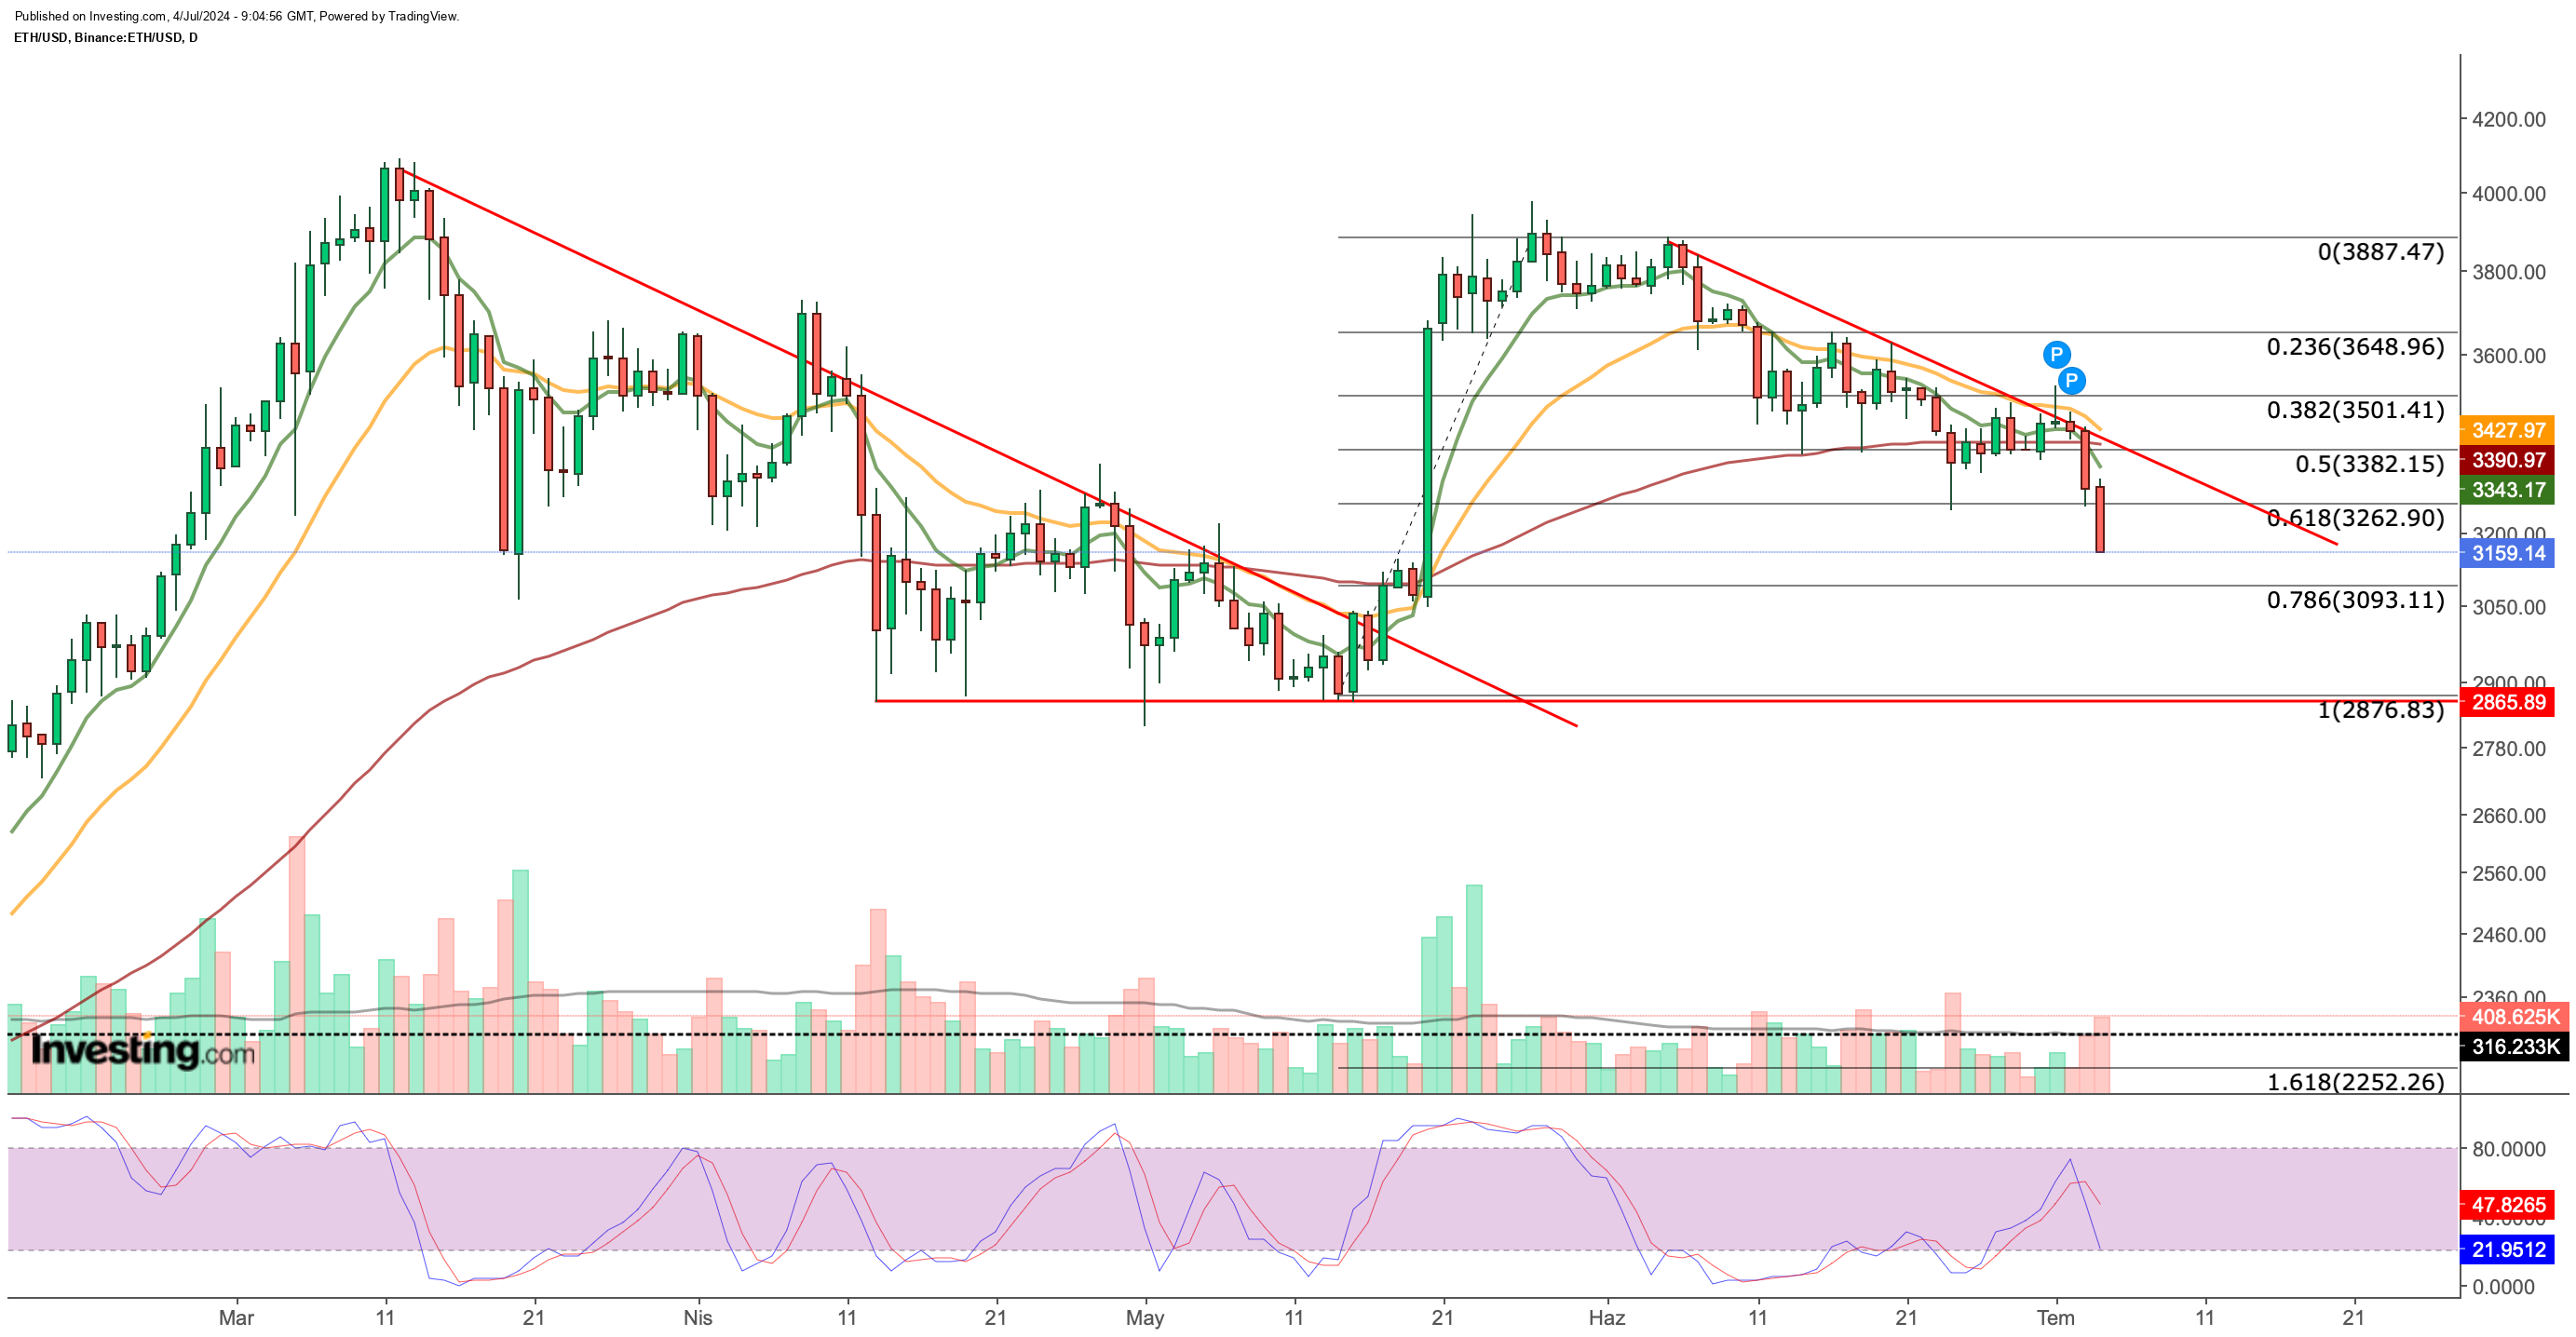
Ethereum gave back its gains following the ETF approval announcement. The cryptocurrency initially surged over 25% after the SEC opened the door for spot ETFs in May. However, prolonged uncertainty surrounding the ETF process, coupled with a general market decline, weakened demand for ETH, causing it to fall below the key support level of $3,380 last week.

Since yesterday, heavy selling pressure has pushed Ethereum below its next support level at $3,260 (Fib 0.618), with increased volume sales. The daily outlook now shows a gap down to an average of $3,090, which is the critical last support zone to prevent further declines. A loss of support just below $3,100 (Fib 0.786) could strengthen the sell signal indicated by EMA values.
Despite the bearish trend, the Stochastic RSI is worth monitoring for a potential trend reversal. Currently, the Stoch RSI is turning down rapidly, suggesting the bearish momentum may continue. However, if Ethereum attracts new buyers around $3,100, it could challenge the resistance at $3,265. Breaking this resistance would signify a recovery in ETH and a break from the short-term downtrend. If not, Ethereum could retreat further to $2,865, a demand zone highlighted during the April-May period, in daily closures below $3,100.
2. Solana Approaches Support Level
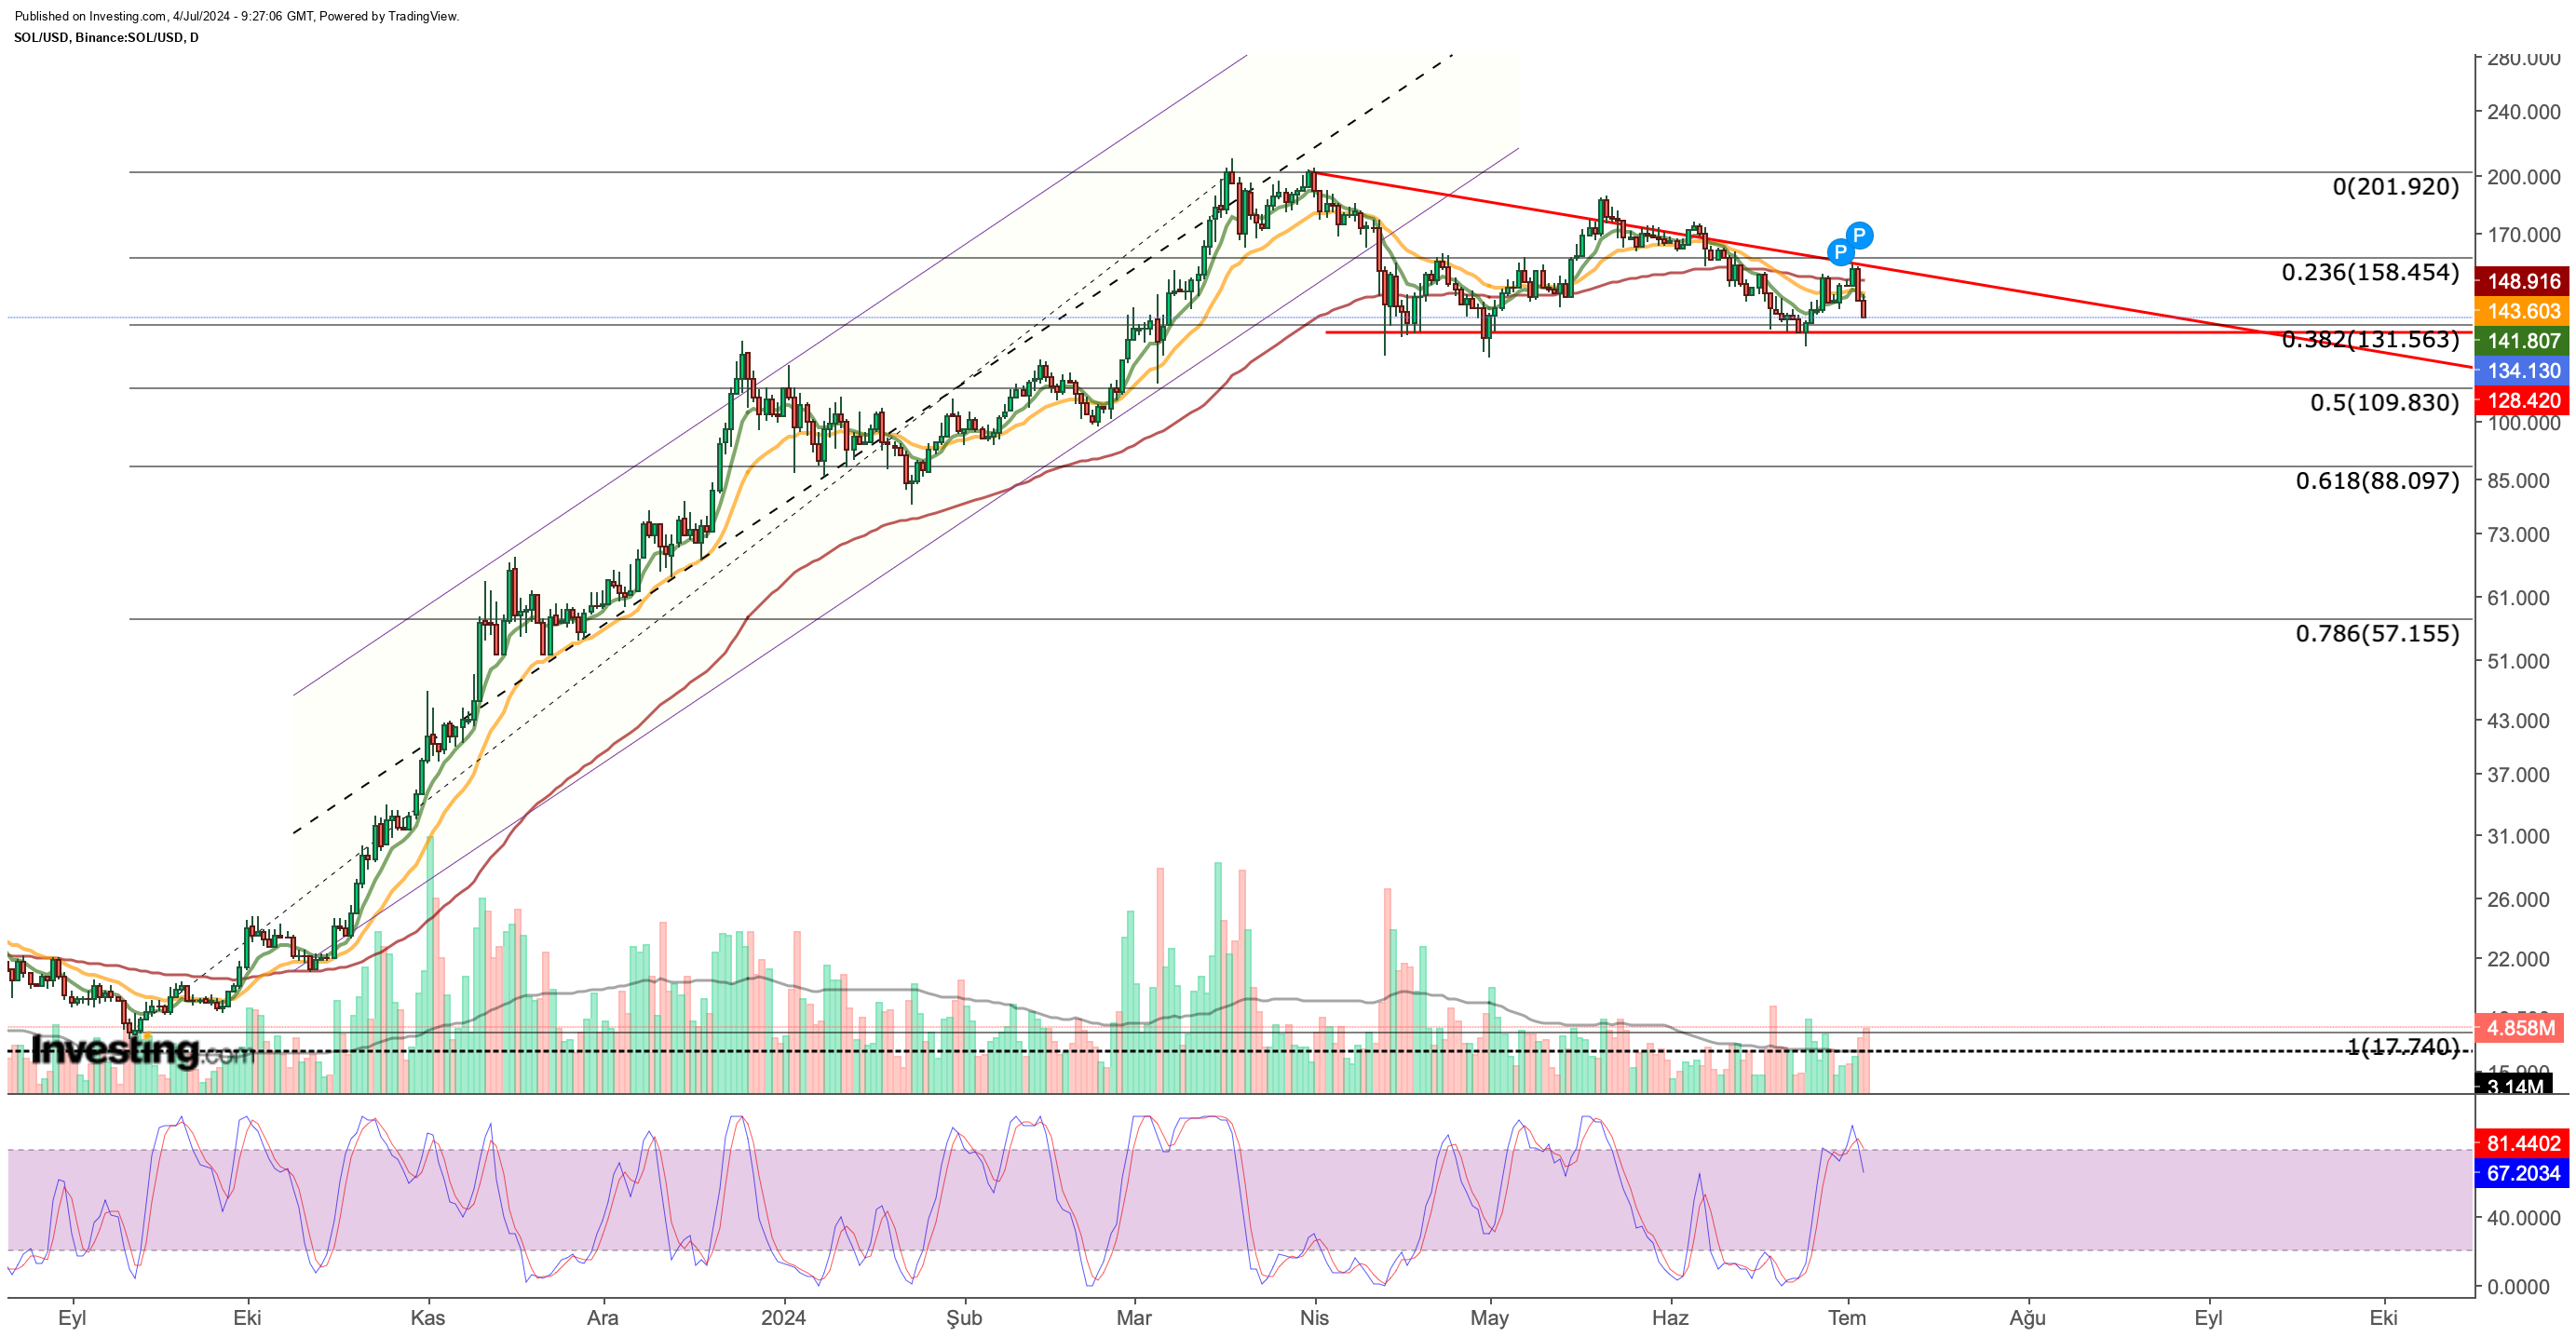
Solana (SOL) recorded a strong bullish performance from October 2023 to March this year, riding the general recovery trend. However, over the last three months, the cryptocurrency has lost momentum and entered a consolidation phase. Despite this, SOL has shown more resilience compared to Bitcoin, which recently broke below its consolidation zone. 
Solana has found support in the $125-$130 range on average, maintaining this horizontal outlook with lower peaks since April. Last week, SOL briefly rebounded to $150, but a sell-off pushed it back towards the main support zone, which corresponds to the 0.382 Fibonacci retracement level of the recent uptrend.
If SOL closes below $130 this week, it could trigger a pullback to the $110 region. Conversely, if the current selling pressure eases, SOL might find support around $130, potentially setting the stage to break the falling trend line and anticipate a new rebound. In a possible recovery, reaching the $160 region could end the lower peak formation and quickly increase upward momentum. However, daily closes below $130 present a significant risk for SOL.
3. BNB: Key Support Levels to Watch Amid Bearish Outlook
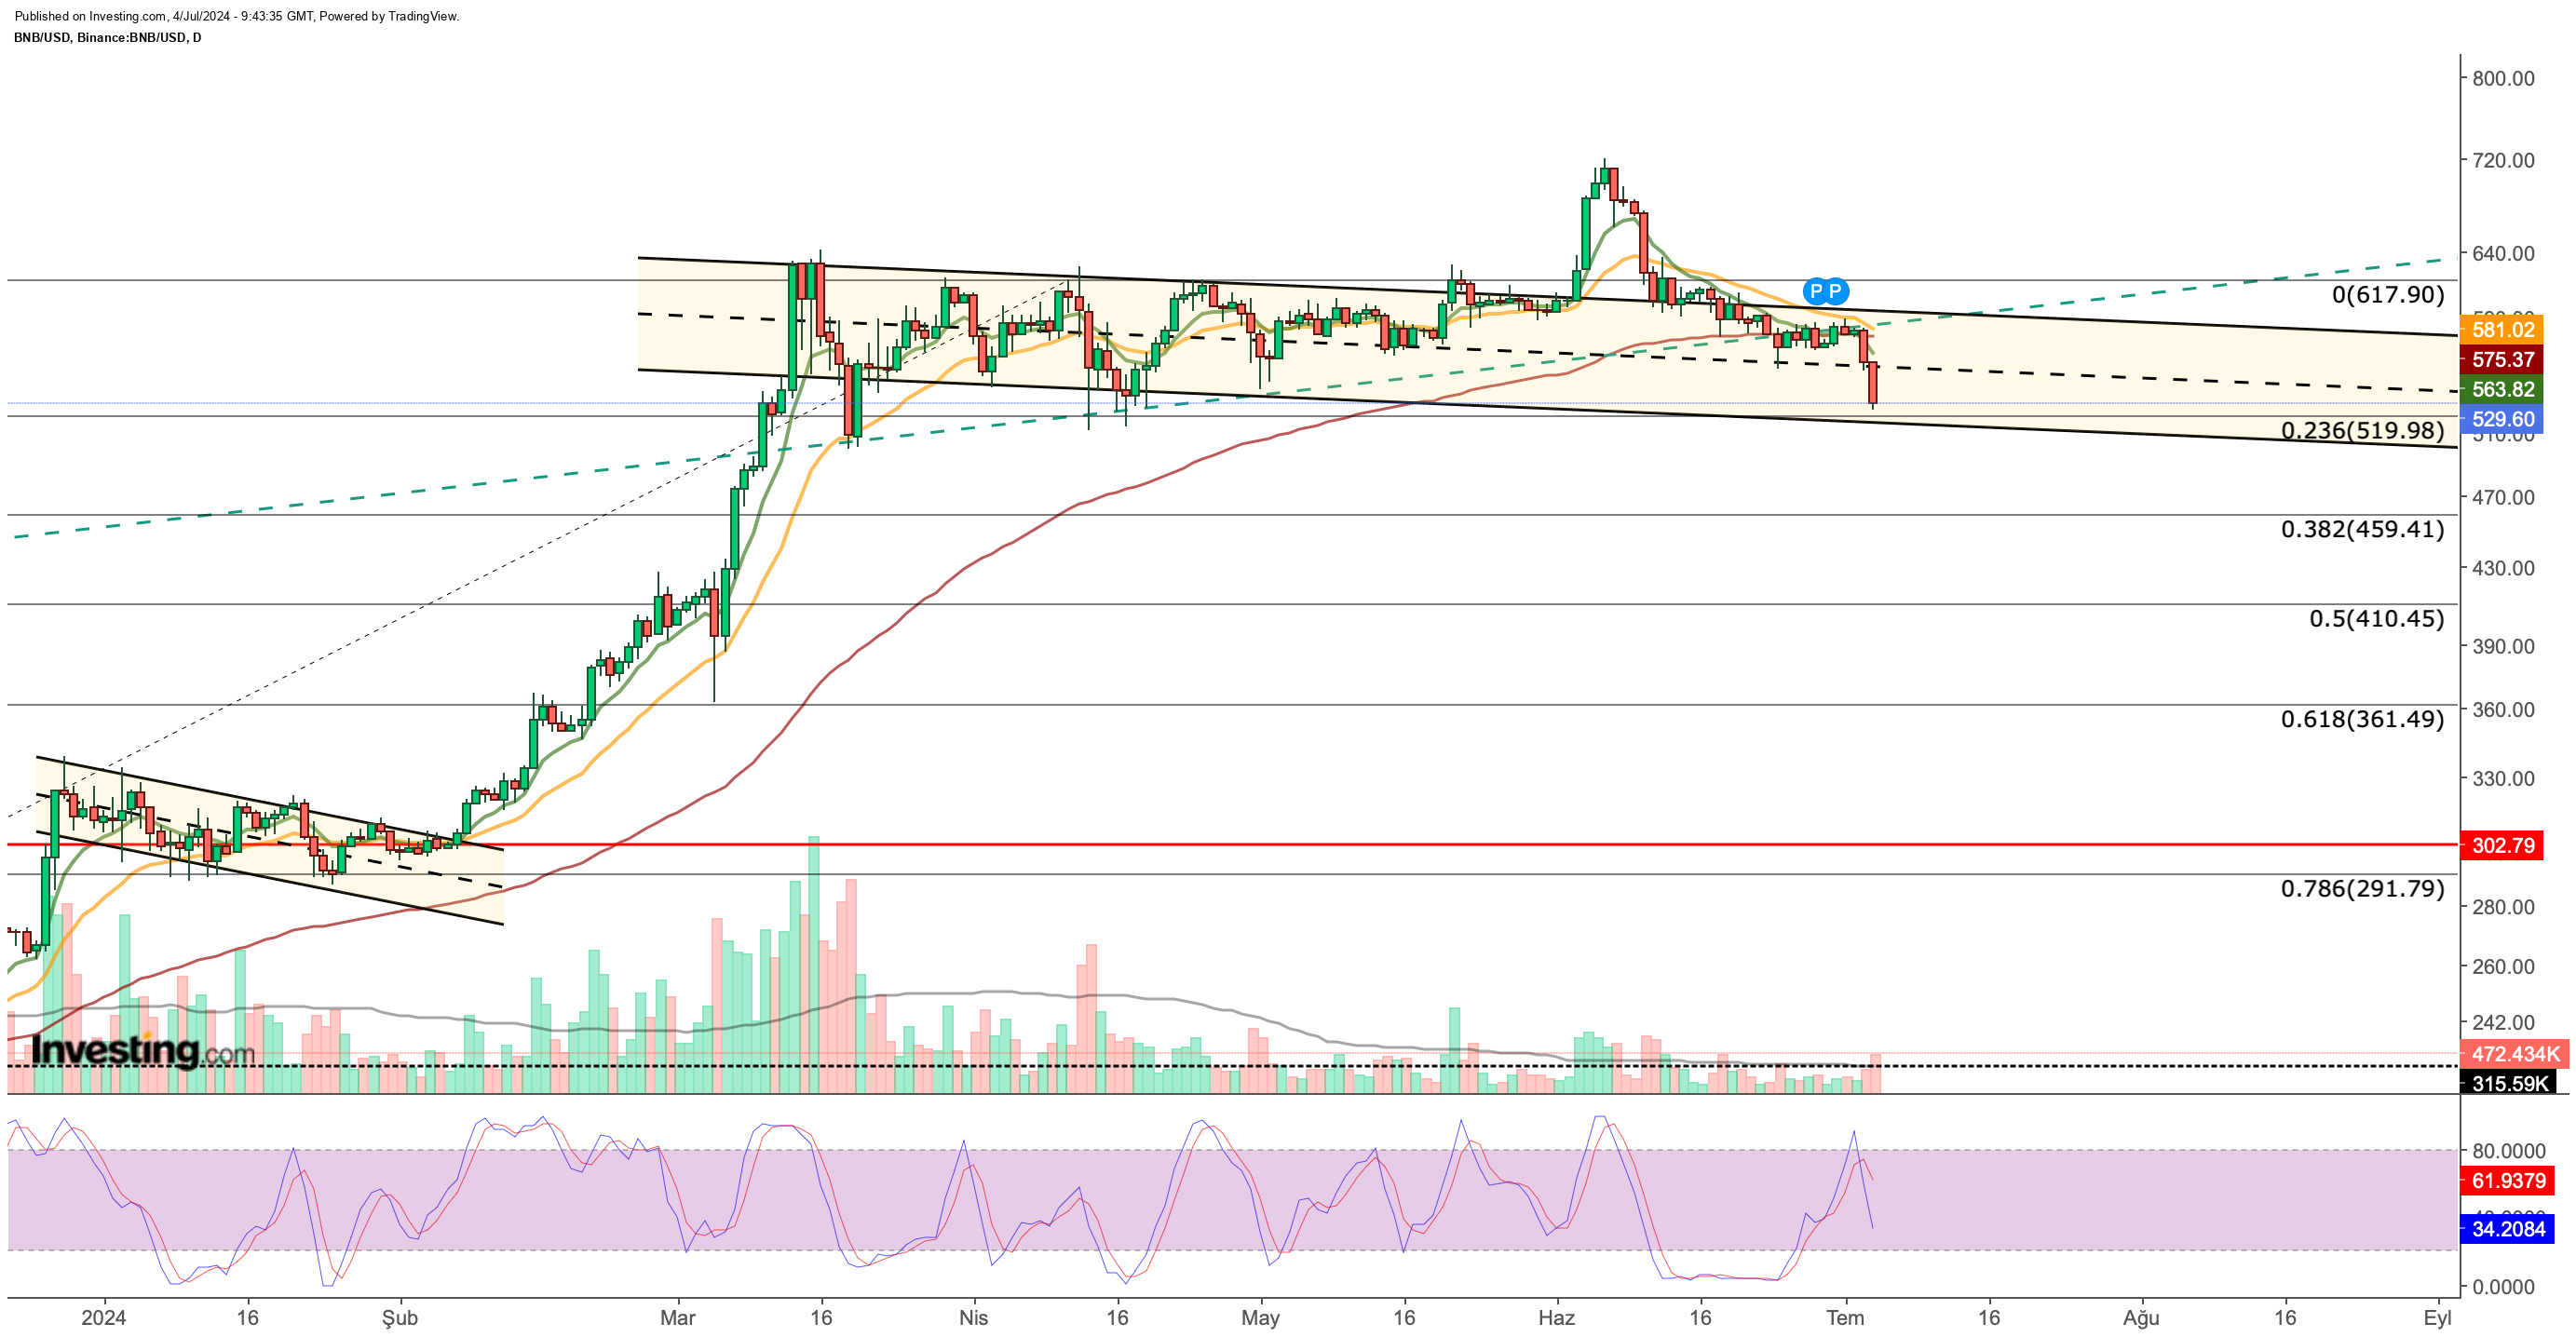
BNB experienced a bounce in June but struggled to maintain its gains amid a bearish sideways trend since March. Early in June, BNB tested the $700 region, influenced by its usage on the Binance exchange. However, persistent selling pressure and the suspension of token supplies on Binance have negatively impacted BNB demand.

Currently, BNB is moving swiftly towards the lower band of its channel, with $520 identified as a critical support level this week. A clear daily close below this level could confirm a downward break of the channel, potentially extending the decline to $450 based on Fibonacci retracement levels. Conversely, if BNB finds support around $520, it could aim for $550 and then $580, aligning with the channel's upper band.
Eyes on US Employment Data
Crypto markets have faced heavy selling pressure this week, partly due to Mt. Gox-related sales. Additionally, tomorrow's labor data release in the US is a significant stress factor. Yesterday's ADP nonfarm payrolls, Unemployment Benefits, and PMI data fell short of expectations, providing some support to risky markets. This has fueled speculation that the Fed might cut interest rates in September, with tomorrow's data now in sharp focus.
Recent inconsistencies between Nonfarm Employment data and other employment indicators have increased uncertainty among market participants. As a result, the upcoming US macroeconomic data has the potential to heighten volatility in the crypto market.
***
This summer, get exclusive discounts on our subscriptions, including annual plans for less than $8 a month!
Tired of watching the big players rake in profits while you're left on the sidelines?
InvestingPro's revolutionary AI tool, ProPicks, puts the power of Wall Street's secret weapon - AI-powered stock selection - at YOUR fingertips!
Don't miss this limited-time offer.
Subscribe to InvestingPro today and take your investing game to the next level!

Disclaimer: This article is written for informational purposes only; it does not constitute a solicitation, offer, advice, counsel or recommendation to invest as such it is not intended to incentivize the purchase of assets in any way. I would like to remind you that any type of asset, is evaluated from multiple perspectives and is highly risky and therefore, any investment decision and the associated risk remains with the investor.
