United Homes Group stock plunges after Nikki Haley, directors resign
History is a good predictor of the future, so goes the saying.
And few things might prove that better than backdated U.S. crude inventories, where an extraordinary narrative of chronologically identical draws could be playing out.
Ever since the peak U.S. summer driving season closed out in late August, market participants have wondered how long it would be before the inventory draws that have continued week after week would run out.
The answer it they might already be over, if historical information from the Energy Information Administration (EIA) is to be believed.
Same Trends Last Year And This Year
Large crude draws are common during the mid-cycle of a summer driving season, and they normally begin thinning out as August comes to an end. Blockbuster draws rarely occur after Labor Day, which typically falls in the first week of September, unofficially marking the end of the summer driving season.

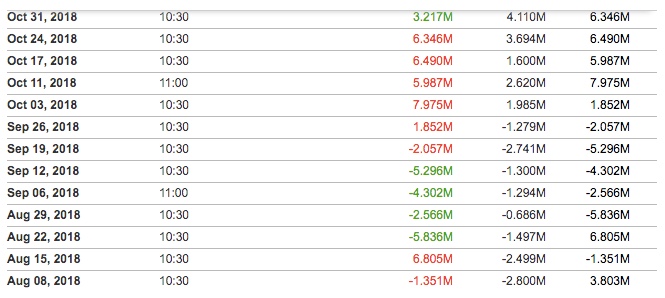
Last year, though, was phenomenally different for U.S. crude draws. In the week ended Aug. 17 (reported by the EIA on Aug. 22), there was a crude draw of 5.8 million barrels. Then in the following three weeks to Sept. 7 (reported on Sept .12 by the EIA), U.S. stockpiles continued to see large declines. The cumulative draw over the four weeks was of 18 million barrels.
This year, the same pattern occurred, though the draws were even larger.

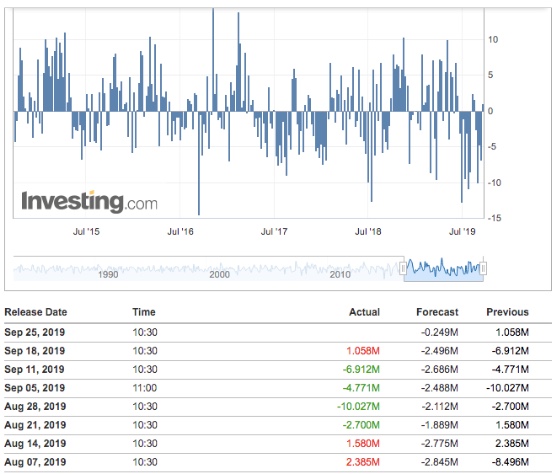
In the week to Aug. 18 (reported on Aug. 21 by the EIA), there was a crude draw of 2.7 million barrels. Then over the three weeks to Sept. 6 (reported by the EIA on Sept. 11), there were consecutive inventory drops. The four-week tally was 24.4 million barrels.
Since then, there has only been one EIA dataset, showing a build 1.06 million barrels for the week ended Sept. 13.
U.S. Crude Stockpiles Could Start Ticking Up From Here
Unless the EIA’s next numbers for the week ended Sept. 20, due at 10:30 AM ET (14:30 GMT) on Wednesday, show a draw, it could mean stockpiles will be creeping up from here.
Some analysts say they won’t be surprised if the EIA reports another rise in crude stocks after the heavy rainfall in Texas last week that hit refinery activity. Exxon Mobil (NYSE:XOM), for instance, closed its 370,000 barrels-per-day refinery in the Texas city of Beaumont on Thursday due to flooding.
A preliminary inventory snapshot from the American Petroleum Institute (API) on Tuesday suggested that the EIA could report a sharp rise in stockpiles for the week ended Sept 20.
The API cited a crude build of 1.4 million barrels for the week, against a broader market consensus for a draw of 250,000 barrels.
In the previous week to Sept. 13, the API suggested a crude build of 592,000 barrels and the EIA ultimately reported a rise of 1.06 million.
When comparing the API and EIA data, the directional trend is often what matters, as absolute numbers reported by the two entities vary dynamically because they are measured differently. The API collects industry data reported voluntarily by its members. The EIA is a government agency that mandates reporting by the entire U.S. energy sector.
While the sure way of knowing the inventory numbers for each week will be to wait out the EIA release, a surprisingly accurate read might be obtained by just parsing its historical data.
