BYD extends lead over Tesla in U.K. electric vehicle market
- Bitcoin has plummeted to yearly lows as Mt. Gox creditor payouts triggered investor panic.
- Selling by the US government and potentially German institutions has added fuel to the fire.
- Institutional response in reopening US markets and economic data could determine Bitcoin's next move.
- Unlock AI-powered Stock Picks for Under $8/Month: Summer Sale Starts Now!
A perfect storm of negative factors has sent Bitcoin prices plummeting in recenty. The primary culprit appears to be the initiation of creditor payouts by Mt. Gox, the defunct cryptocurrency exchange. This large-scale BTC liquidation has spooked investors and triggered a wave of selling, pushing the price near its yearly lows.
Adding to the bearish sentiment are Bitcoin sales by the US Government along with the institutions potentially affiliated with the German government. These additional sales further pressured the price, especially considering US markets were closed during a critical support break.
With Bitcoin now trading near its yearly lows, all eyes will be on US markets reopening today and how institutional investors react. Demand for Bitcoin ETFs has been rising recently, and their behavior could determine the direction of the cryptocurrency.
The ongoing Mt. Gox payouts raise the possibility of continued price drops as investors anticipate further selling. This could be exacerbated by ETF sales triggered by a bearish market perception.
While internal crypto dynamics are driving the current negativity, today's release of the highly anticipated US Non-Farm Payrolls data should not be overlooked. A weaker-than-expected report, signaling a cooling economy, could provide a positive swing for Bitcoin and the broader market by paving the way for potential Fed interest rate reductions.
The Fed's scaling back of its rate cut forecast and the high operational costs faced by Bitcoin miners post-halving have also been contributing factors to the overall downward pressure. Additionally, historical trends suggest that Bitcoin may be experiencing a period of seasonal selling activity.
Despite the current negativity, a recovery wave for Bitcoin remains possible once the selling finds equilibrium. This will likely hinge on positive developments and a confirmation of potential recovery through technical indicators.
Bitcoin Weekly Chart Analysis
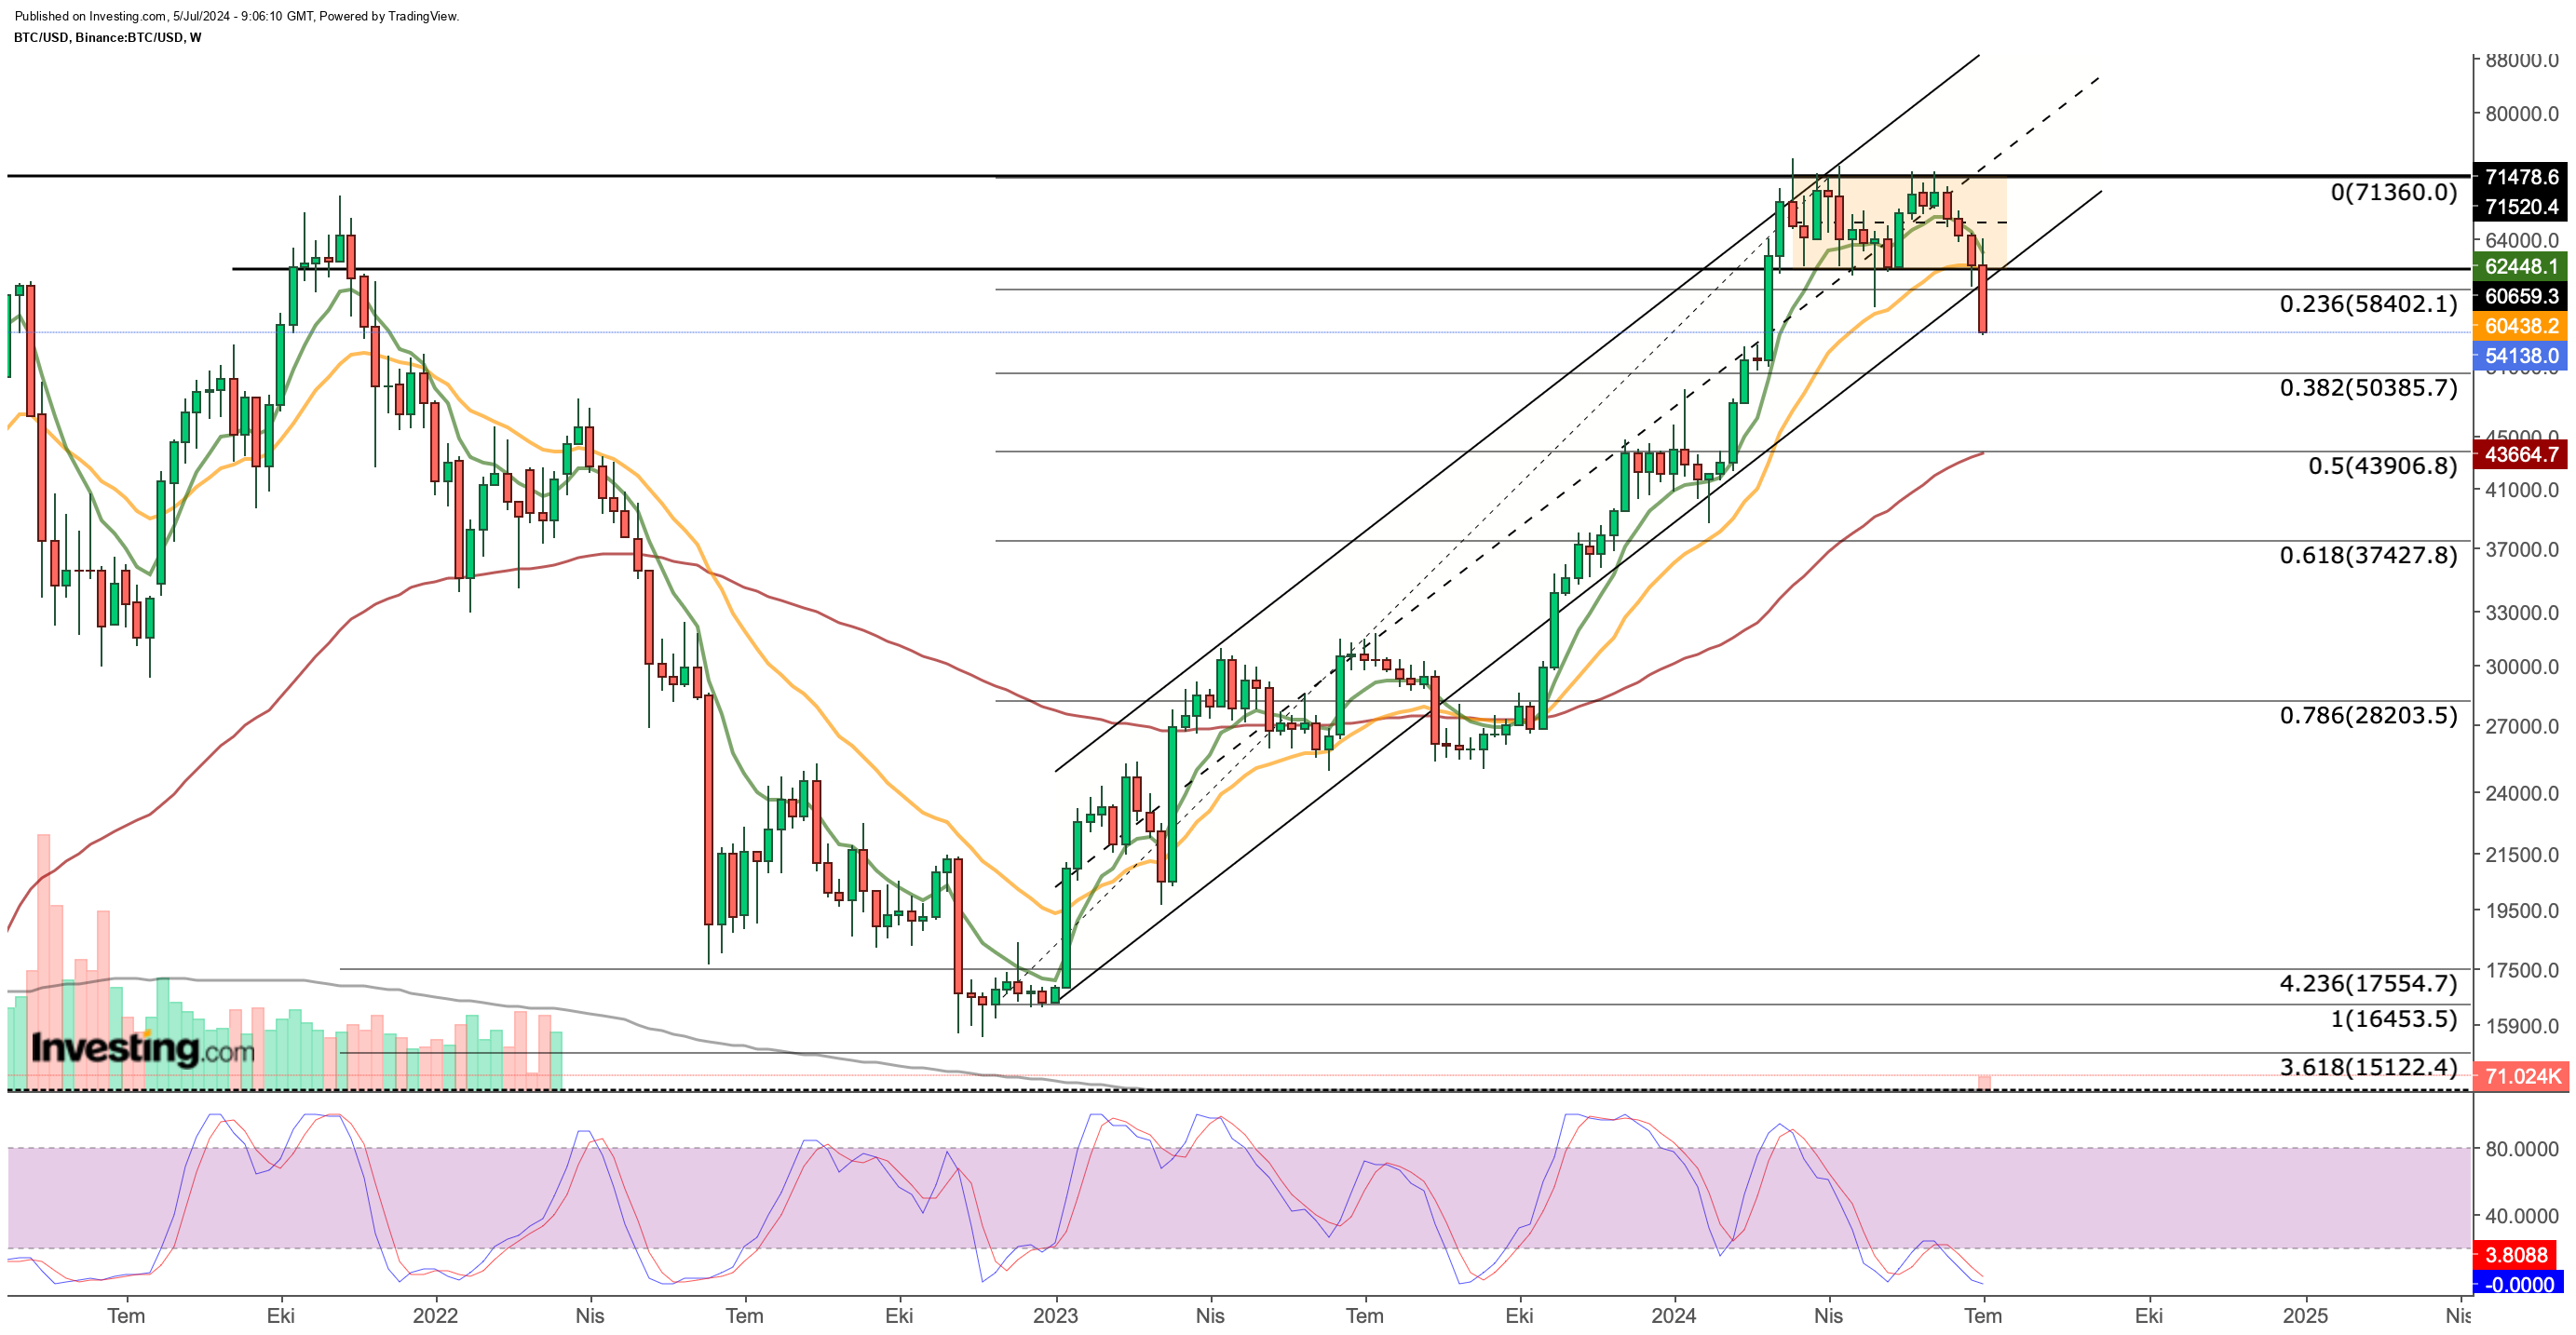
The weekly chart reveals a sharp decline in Bitcoin after losing the $60,400 support level. The next significant support lies around $50,400. Should Bitcoin close below this level on the weekly chart, the price could drop further to $43,900, aligning with the Fib 0.382 level of the long-term uptrend. Additionally, the EMA values on the weekly chart indicate a continued negative trend, suggesting the decline may persist.
With no strong support at current levels, the daily chart offers insight into potential intermediate support points.

Bitcoin Daily Chart Analysis
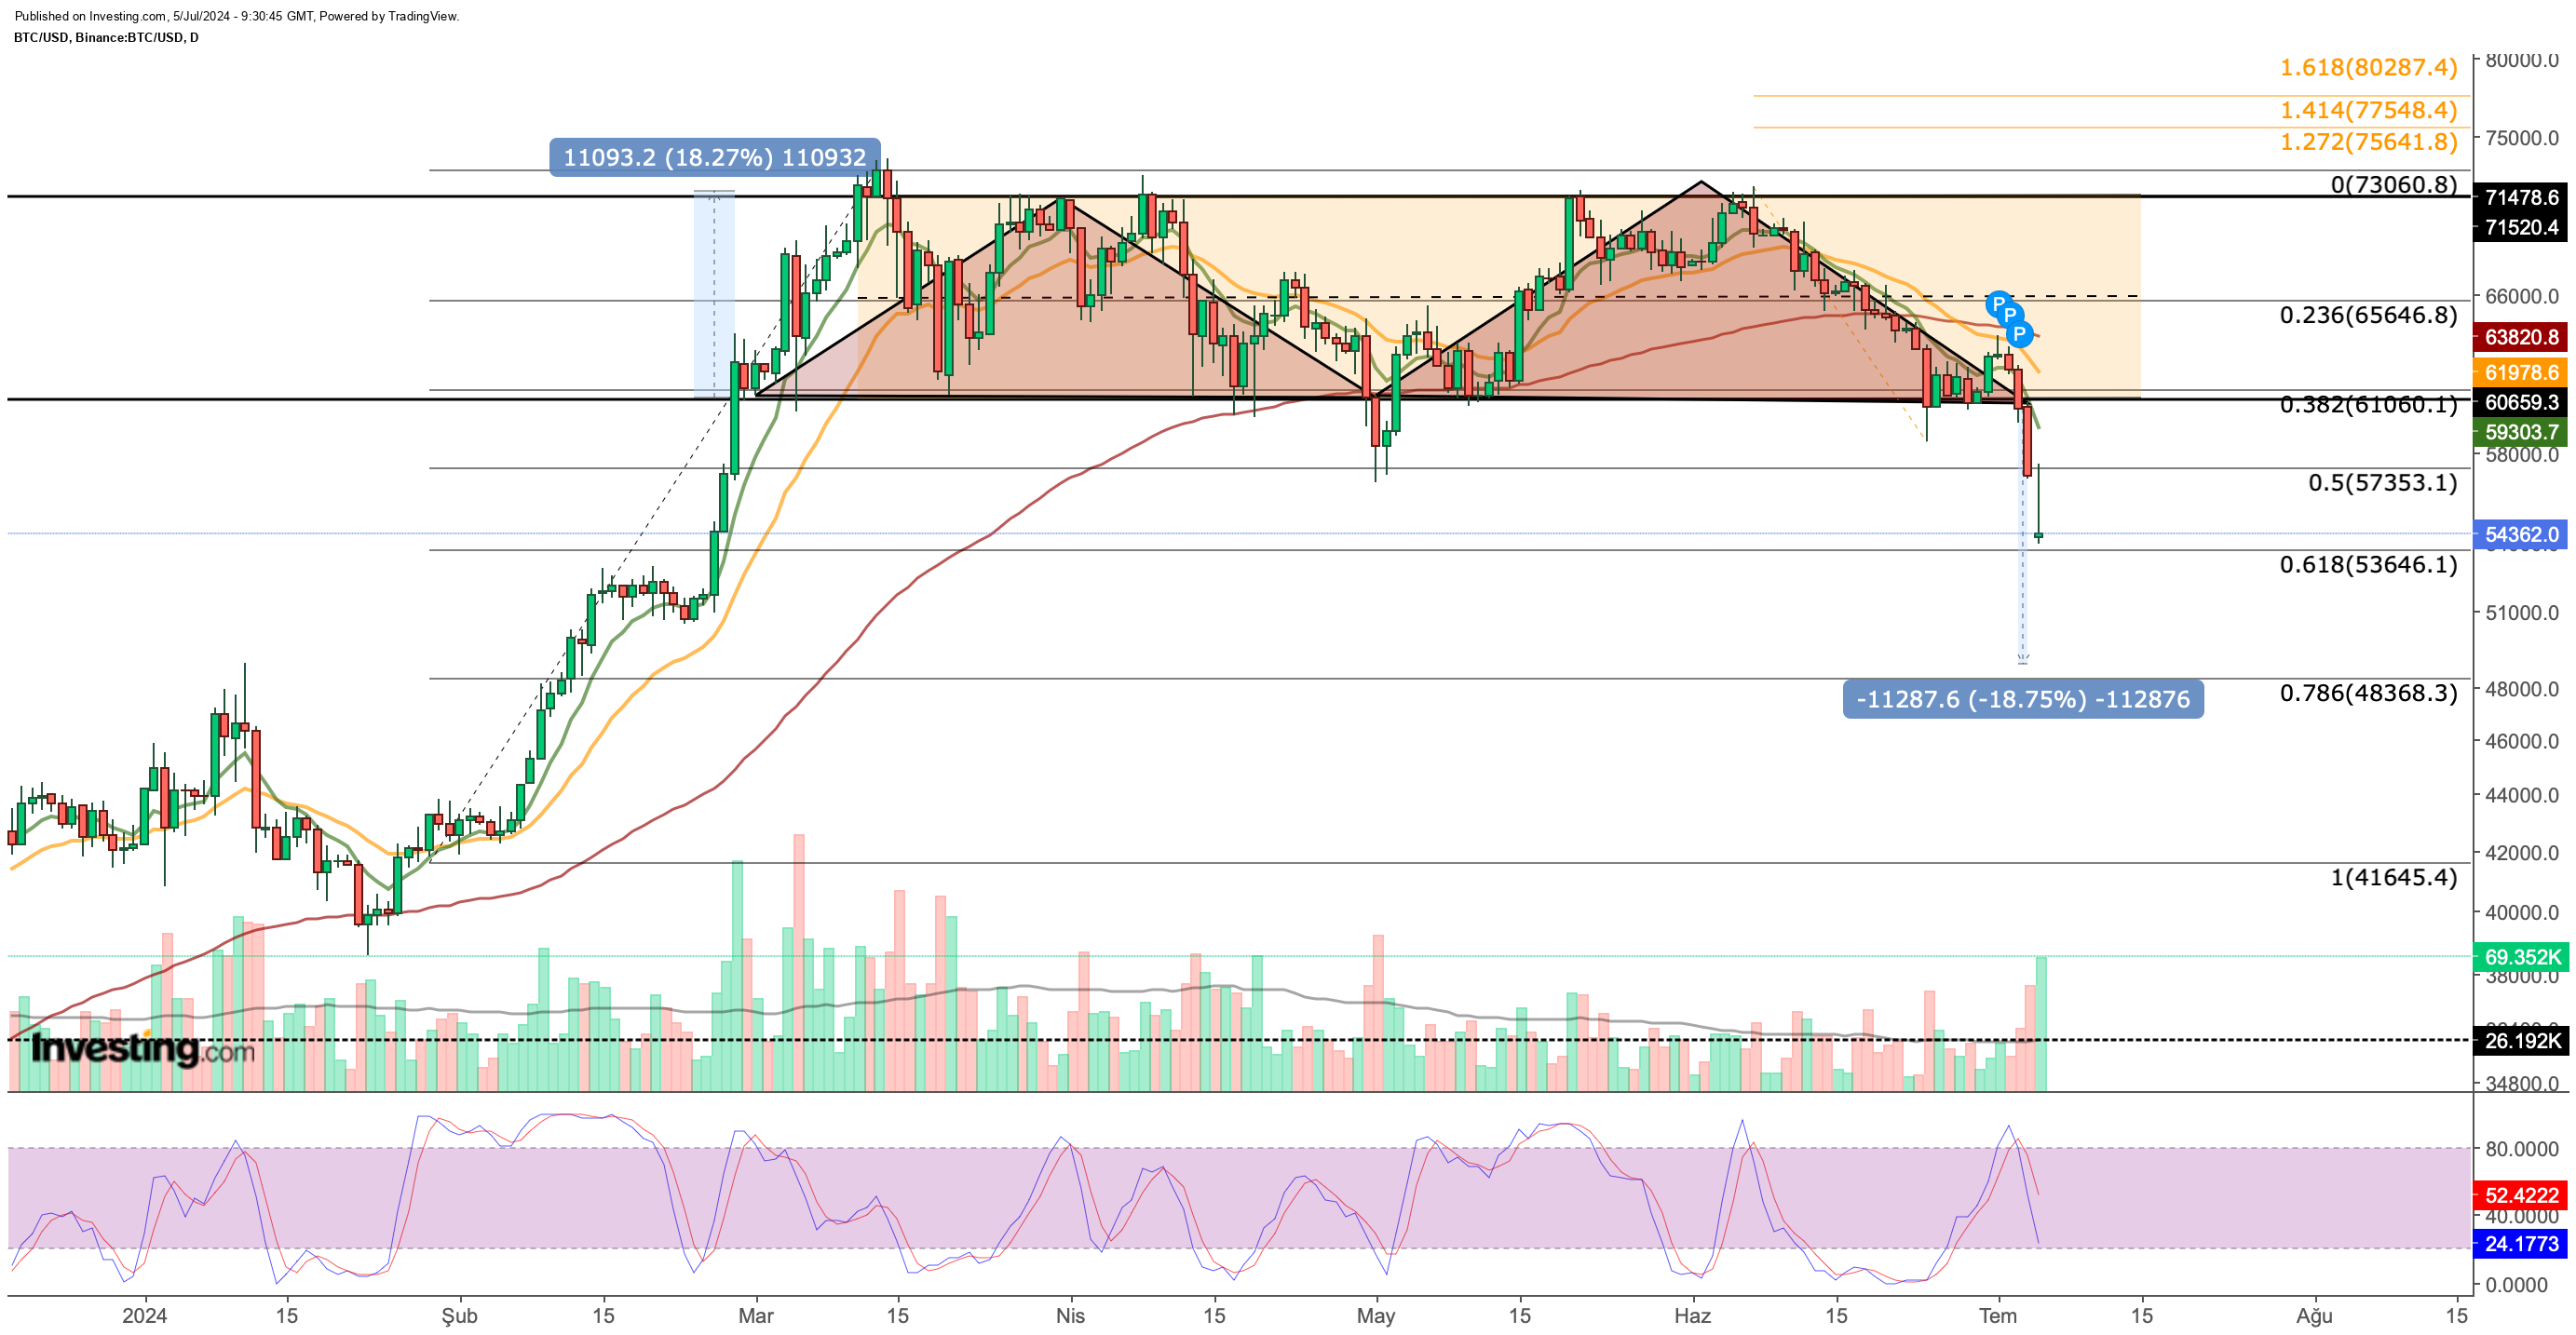
Bitcoin gained significant upward momentum in the first quarter, as shown on the daily chart. The cryptocurrency fluctuated, using $60,000 as support and peaking at $71,000 in the past three months, forming a double top pattern. If Bitcoin breaks the support line this week, it could decline by the distance between the support and peak levels.

Today, Bitcoin dropped to $53,400, testing the critical Fib 0.618 support relative to the 2024 uptrend. If this support zone fails, BTC could retrace to $48,300 (Fib 0.786) in the coming days, aligning with the double top pattern. Consistent daily closes below $53,500 could trigger further declines to Fib 0.786.
However, positive US employment data and slower BTC transfers from Mt. Gox might boost market sentiment. For a recovery, Bitcoin needs to close above $57,300 this week. Additionally, watching the Stochastic RSI, which is currently declining sharply, for signs of slowing and reversing upward can signal a potential recovery.
If Bitcoin fails to hold the $53,500 support, we could see it drop below $50,000.
***
This summer, get exclusive discounts on our subscriptions, including annual plans for less than $8 a month!
Tired of watching the big players rake in profits while you're left on the sidelines?
InvestingPro's revolutionary AI tool, ProPicks, puts the power of Wall Street's secret weapon - AI-powered stock selection - at YOUR fingertips!
Don't miss this limited-time offer.
Subscribe to InvestingPro today and take your investing game to the next level!

Disclaimer: This article is written for informational purposes only; it does not constitute a solicitation, offer, advice, counsel or recommendation to invest as such it is not intended to incentivize the purchase of assets in any way. I would like to remind you that any type of asset, is evaluated from multiple perspectives and is highly risky and therefore, any investment decision and the associated risk remains with the investor.
