e.l.f. Beauty stock plummets 20% as revenue and guidance fall short of expectations
- Bitcoin dropped 7% from its $123,000 peak, testing support near $114,650 amid market sell-off.
- Whale wallets holding 1,000–10,000 BTC fell 2.7%, the sharpest outflow in six months.
- Capital shifted to altcoins like Ethereum, which rose 55%, drawing volume away from Bitcoin.
- Looking for actionable trade ideas? Subscribe now to unlock access to InvestingPro’s AI-selected stock winners for up 50% off amid the summer sale!
After reaching a record high of $123,000 in early July, Bitcoin has been moving sideways in recent weeks. In the past 24 hours, news of a large sell-off has shaken the market. Bitcoin is now testing a key support level at $114,650, about 7% below its peak.
Whale Sell-Offs Raise Red Flags
One of the key developments in recent days is the drop in the number of whale wallets holding between 1,000 and 10,000 BTC. These wallets have fallen by 2.7% over the past 10 days—the sharpest decline in the last six months. Reports that some of these sales came from old “Satoshi era” wallets added to market worries.
Another major event was Galaxy Digital’s transfer of 10,000 BTC (about $1.18 billion) to an exchange, which further shook investor confidence.
Institutional selling has also weighed on the price. Bitcoin ETFs saw $285 million in outflows over the past three days, turning the sideways movement into a slight downtrend. While these outflows could simply be profit-taking after recent gains, Bitcoin’s failure to climb back to the $120,000 range has increased fears of growing selling pressure.
Another reason for Bitcoin’s stalled uptrend is the recent shift of capital into the altcoin market. Over the past 10 days, money has moved away from BTC and into coins like Ethereum. Ethereum, which leads the altcoin space, has jumped 55% this month. This surge, driven by rising interest in spot ETF activity, pulled market attention toward ETH and further reduced Bitcoin’s volume and momentum.
Global Economic Uncertainty Pressures Market Sentiment
Recent global economic developments are also putting indirect pressure on the crypto market. With the US tariff deadline of August 1 approaching, investor risk appetite is falling. This uncertainty has led many to take profits from recent crypto gains and move funds into safer assets. As a result, outflows from the crypto market picked up in the second half of the week.
Next (LON:NXT) week brings a packed macroeconomic calendar. In the US, investors will be watching employment and growth data, along with the Federal Reserve’s interest rate decision. These events, combined with the August 1 tariff deadline, could lead to sharp price swings. It is understandable that many investors are now being more cautious and shifting toward safer investments.
Technical Outlook for Bitcoin
At the moment, Bitcoin’s short-term downtrend has not yet damaged the broader upward trend. However, key short-term support levels need to be watched closely. If these levels are lost, it could trigger stronger selling and lead to a deeper correction.

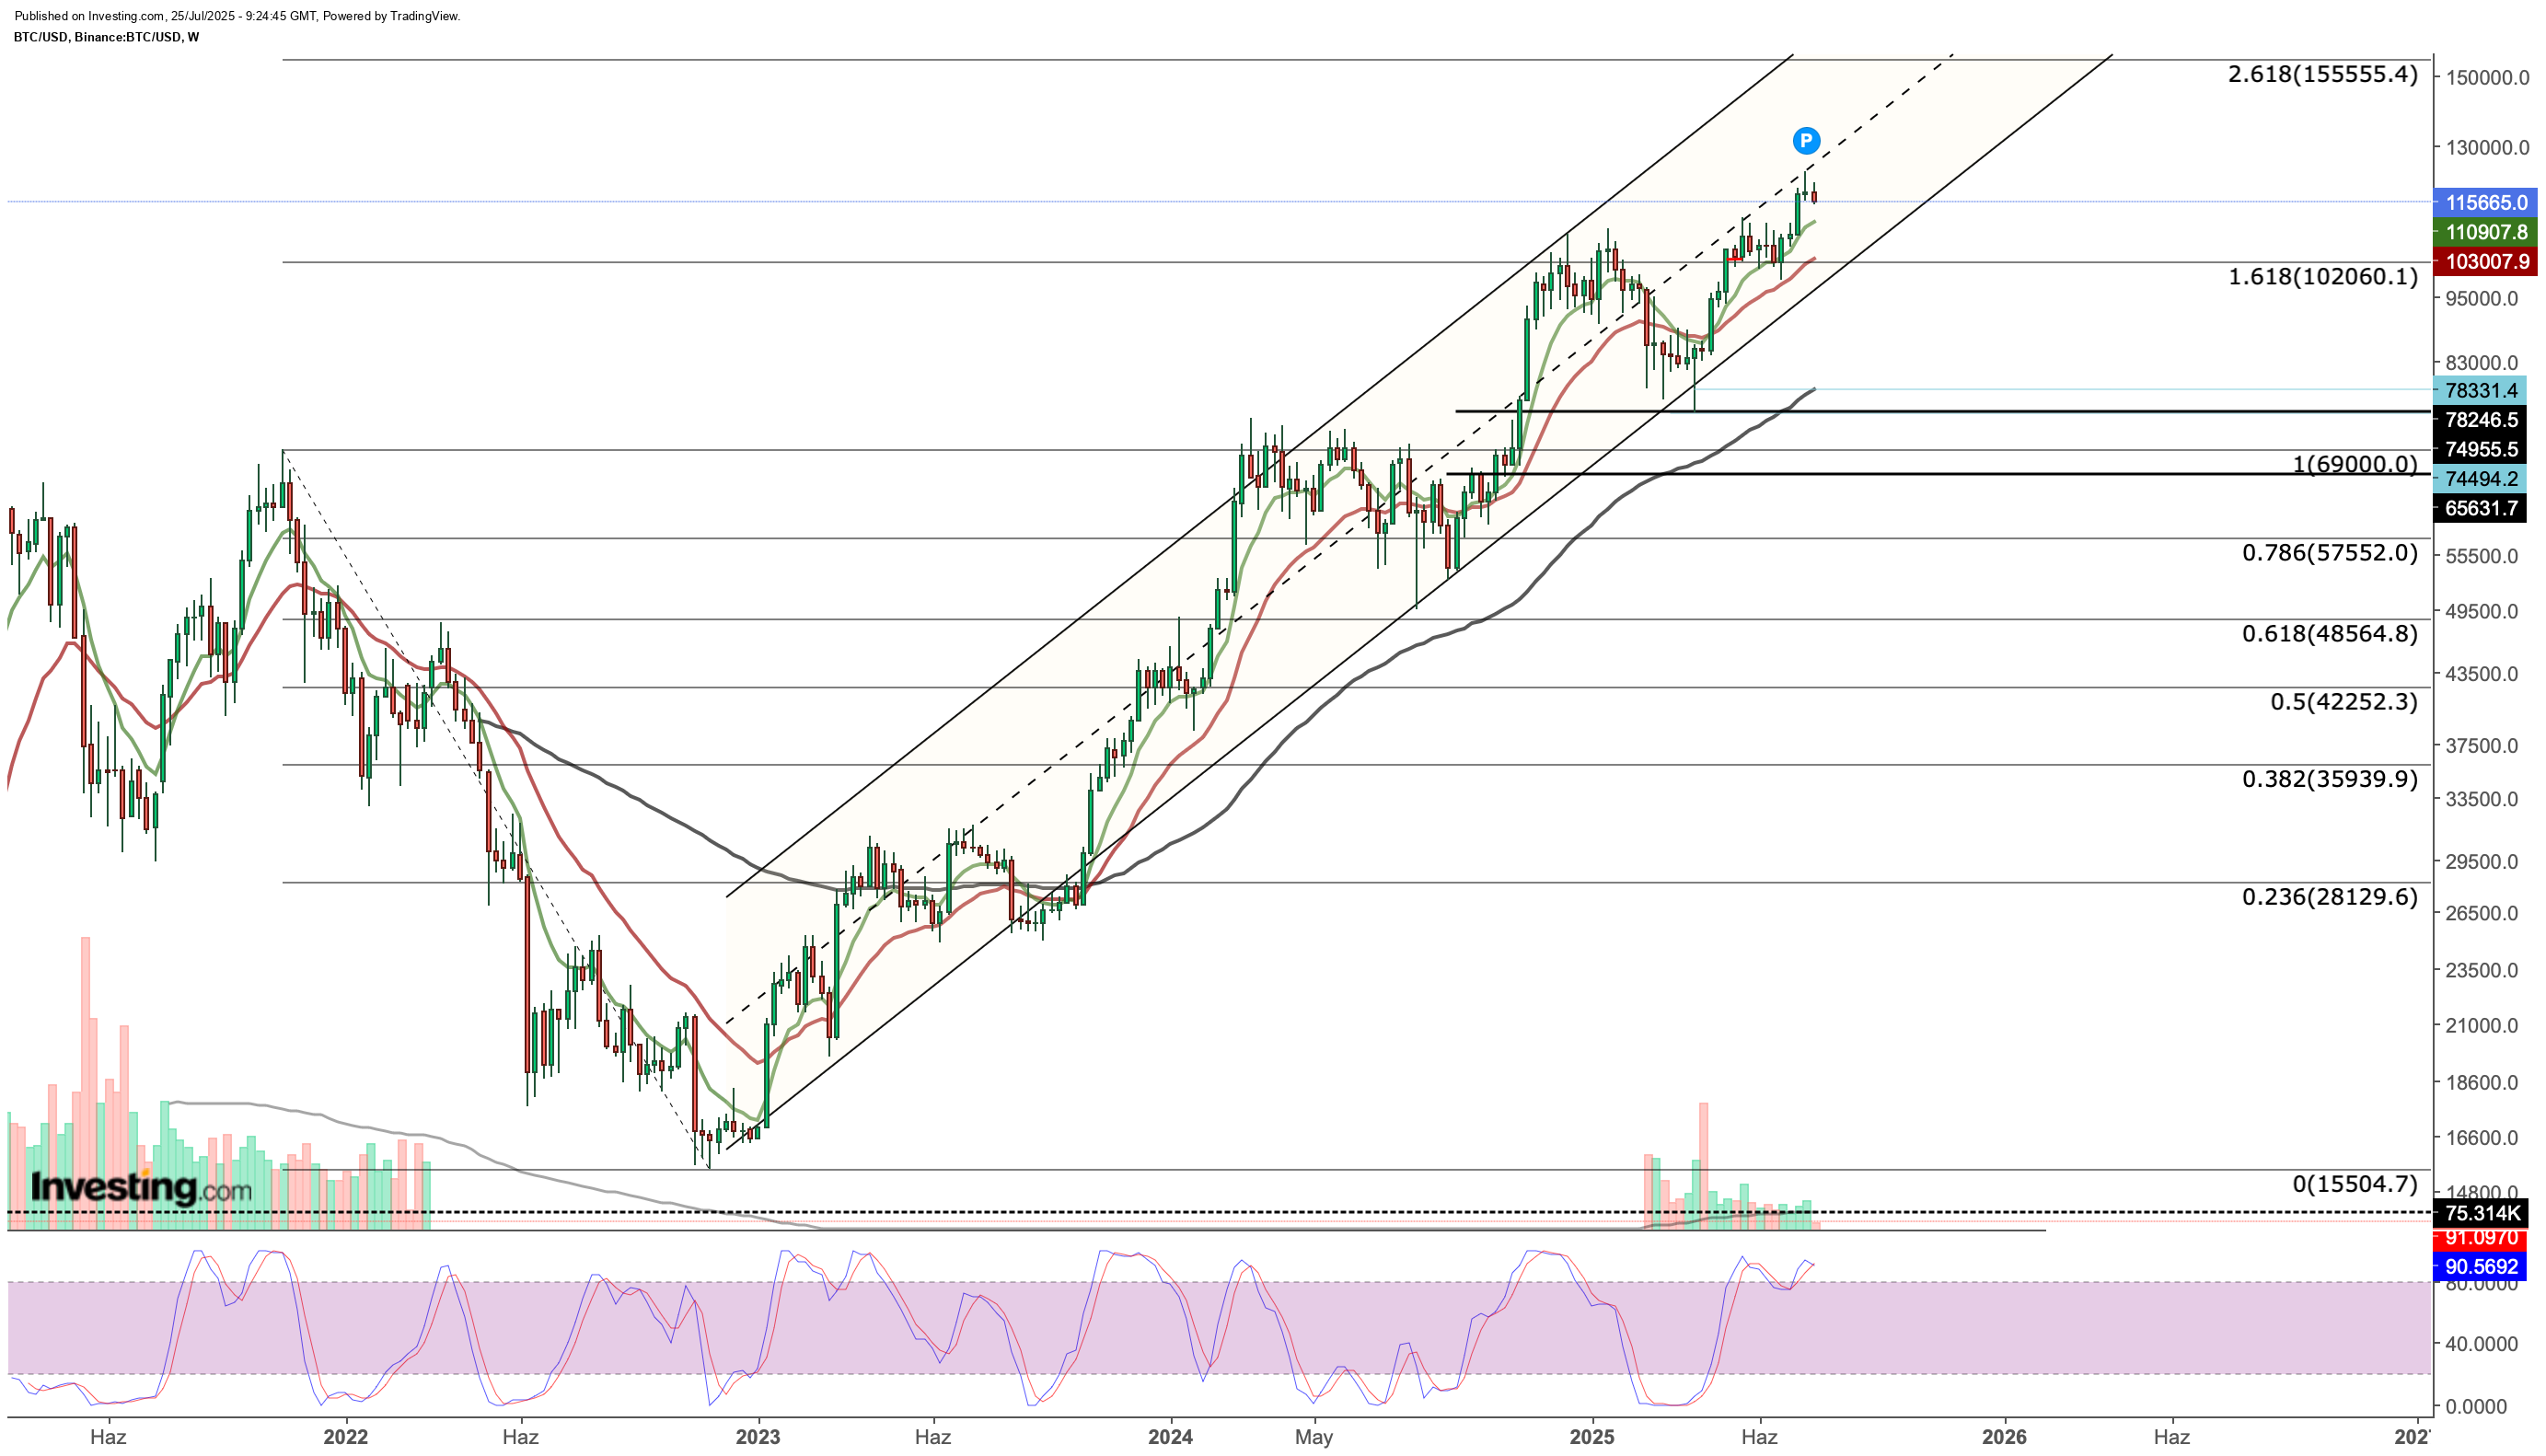
Bitcoin is currently facing resistance at the mid-band of its ascending channel on the weekly chart. Based on this week’s bearish movement, the key support to watch is around $110,800. If this level breaks, the price could retreat toward $102,000, which aligns with the lower band of the channel. A drop to this level would still be within the broader uptrend. As long as Bitcoin holds above $102,000, any deeper correction could strengthen the long-term trend.
However, if the $102,000 support fails, it could signal a trend reversal and open the way for a broader correction toward the $70,000 range.
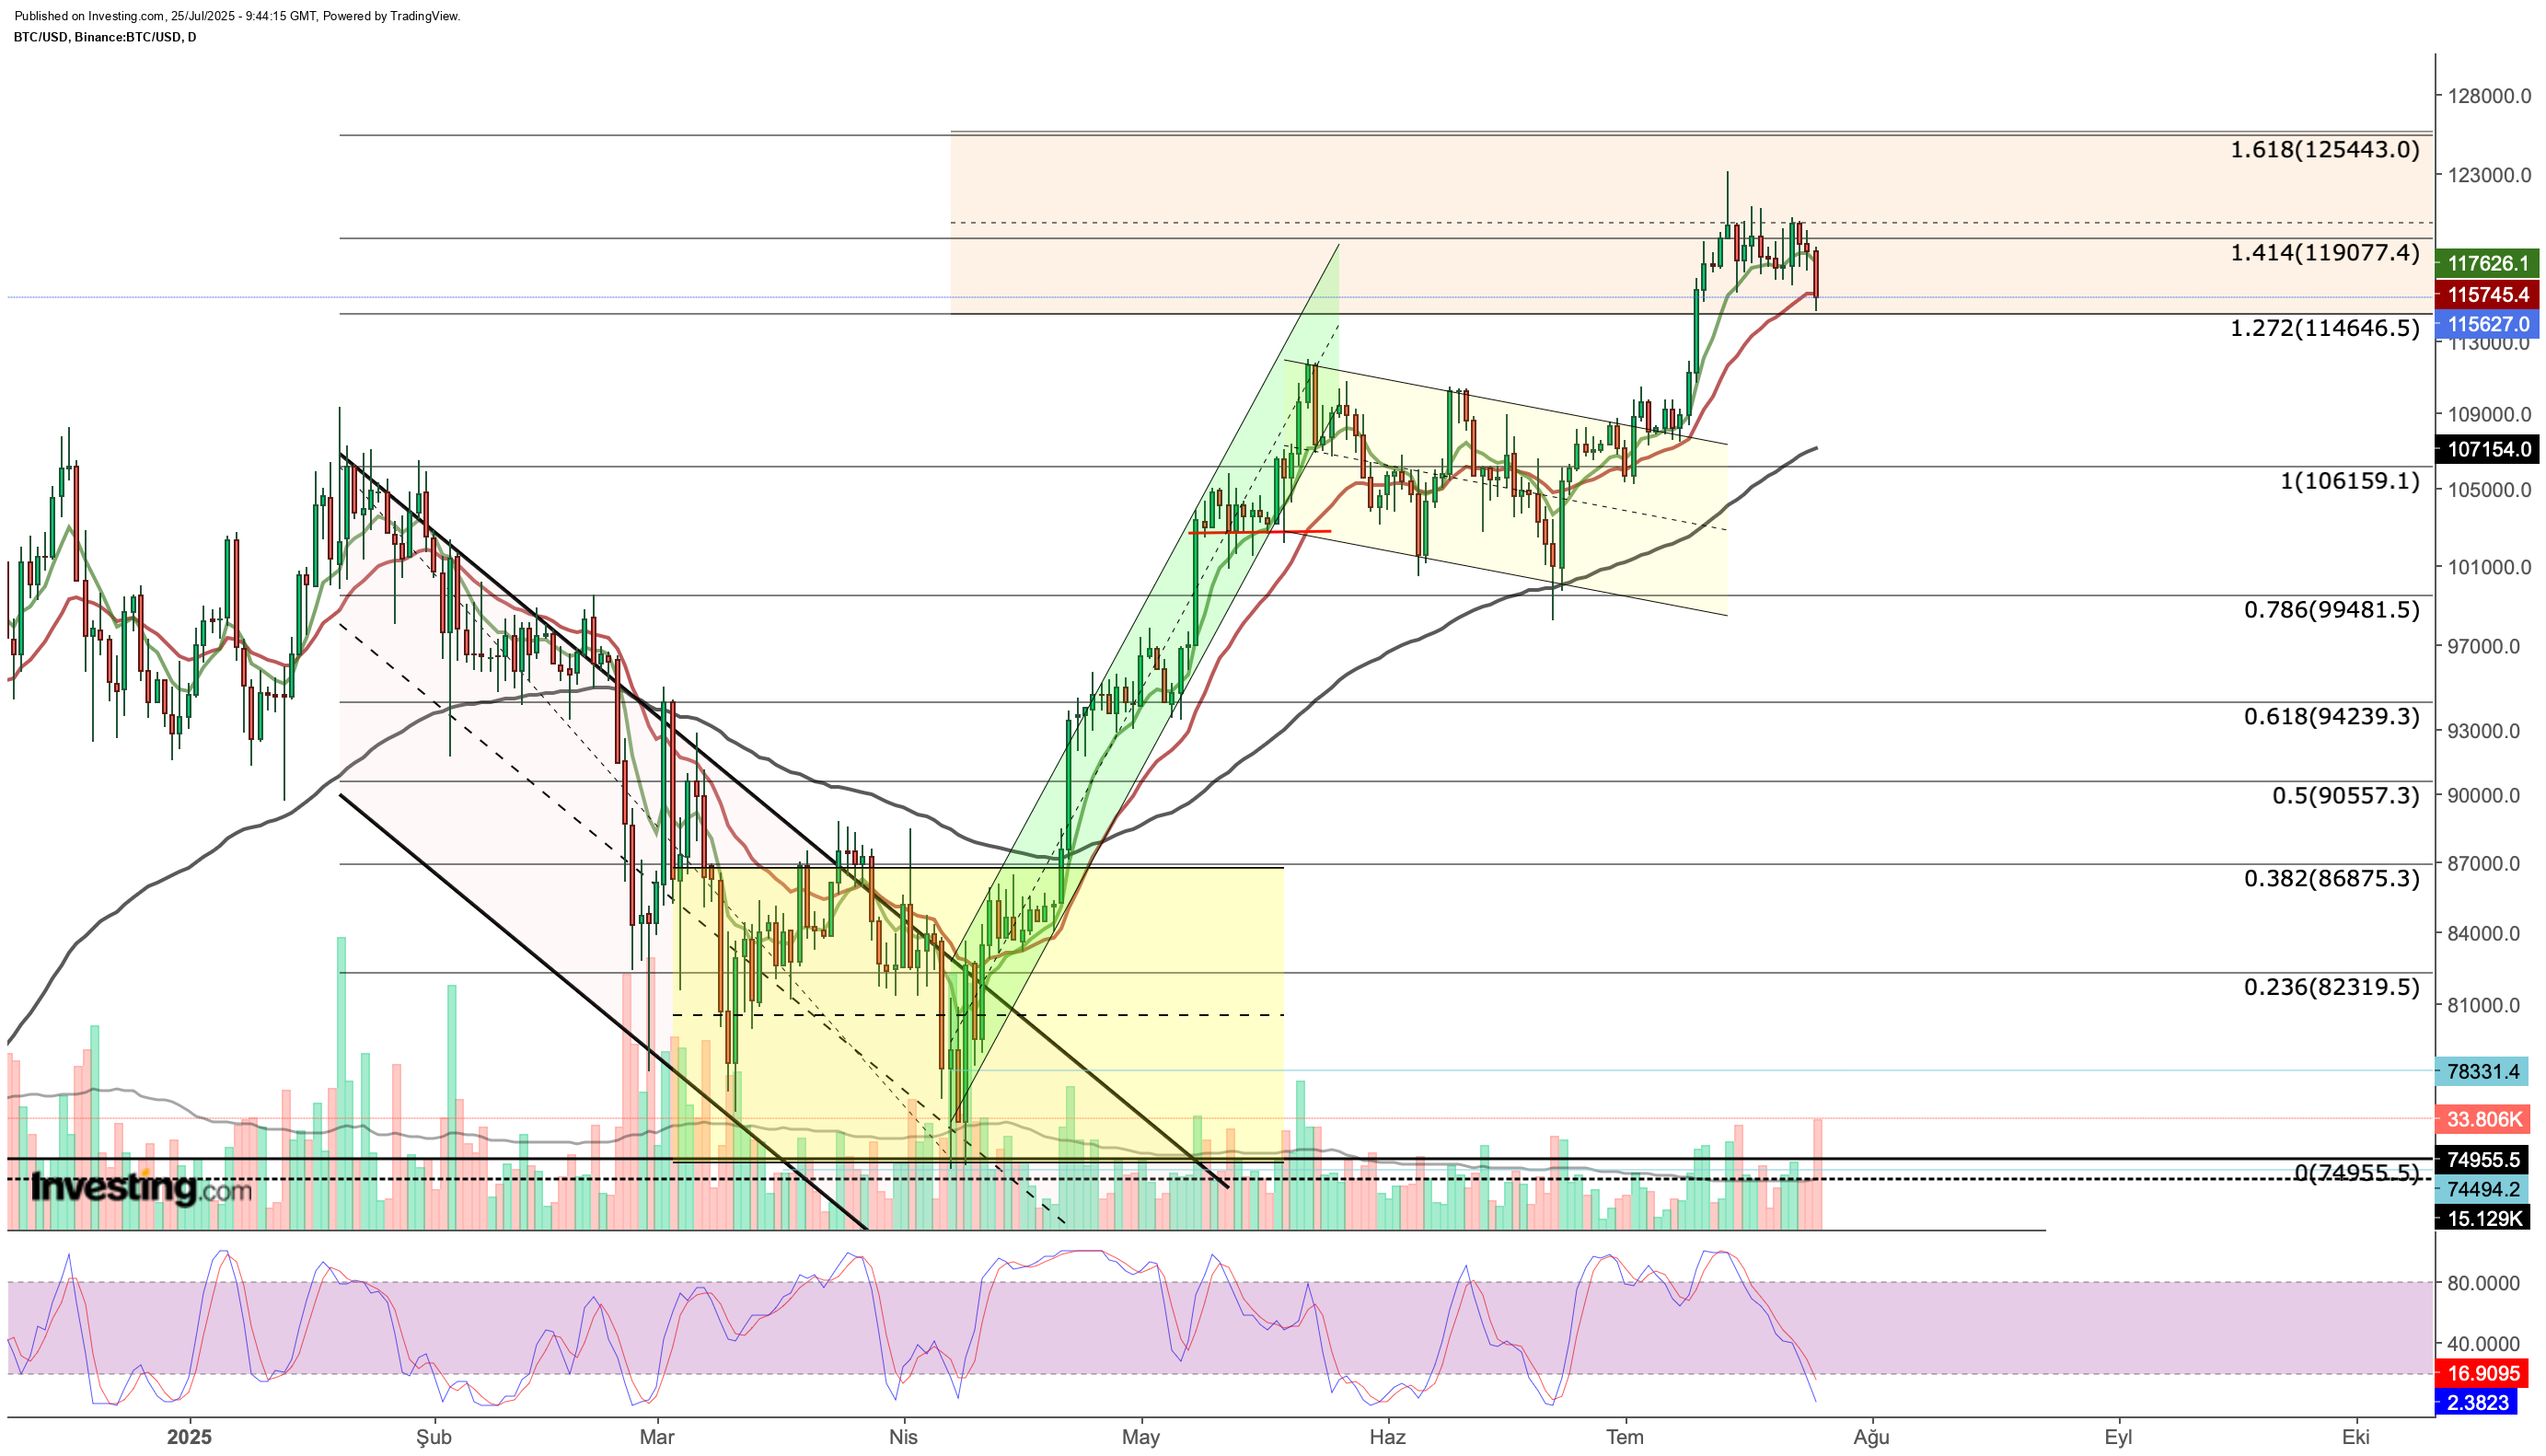
Looking at the daily chart, Bitcoin has reached a critical short-term support following today’s sharp decline. This area is defined by the 1.272 Fibonacci expansion level and the short-term EMA. If Bitcoin manages to stay above $114,600, the pullback can be seen as a limited correction.

Next, the resistance at the 1.414 Fibonacci level—around $119,000—will be key. If Bitcoin breaks above this level, a stronger recovery could follow, with the potential to reach a new peak near $125,400.
On the downside, if Bitcoin closes below the $114,600 support, it could trigger a pullback toward the $106,000–$110,000 range. This zone also lines up with key weekly support, making it a critical area to watch.
Currently, the Stochastic RSI on the daily chart has entered the oversold zone after a sharp drop. This suggests that if the $114,600 support holds, a fresh upward move could begin. Heading into next week, Bitcoin—and the broader crypto market—is likely to be more sensitive to macroeconomic events.
Disclaimer: This article is written for informational purposes only. It is not intended to encourage the purchase of assets in any way, nor does it constitute a solicitation, offer, recommendation or suggestion to invest. I would like to remind you that all assets are evaluated from multiple perspectives and are highly risky, so any investment decision and the associated risk belongs to the investor. We also do not provide any investment advisory services.
Whether you’re a novice investor or a seasoned trader, leveraging InvestingPro can unlock a world of investment opportunities while minimizing risks amid the challenging market backdrop.
- ProPicks AI: AI-selected stock winners with proven track record.
- InvestingPro Fair Value: Instantly find out if a stock is underpriced or overvalued.
- Advanced Stock Screener: Search for the best stocks based on hundreds of selected filters, and criteria.
- Top Ideas: See what stocks billionaire investors such as Warren Buffett, Michael Burry, and George Soros are buying.

