Stock market today: S&P 500 ekes out gain ahead of key inflation data
As February winds to a close, the commodities scorecard is filling up again with winners and losers.
Gasoline futures sit at the top, with a 40% gain helped by the long-running crude oil rally.
At the bottom of the heap are futures of frozen concentrated orange juice (FCOJ). It’s an odd position for FCOJ, as according to trade publications the drink remains as popular with Americans, especially after a banner year in 2020 as the coronavirus pandemic held up its supposed nutritional value.
In Thursday’s trade on ICE Futures US, FCOJ’s front-month March contract fell nearly 4% for its worst one-day since Dec. 11.
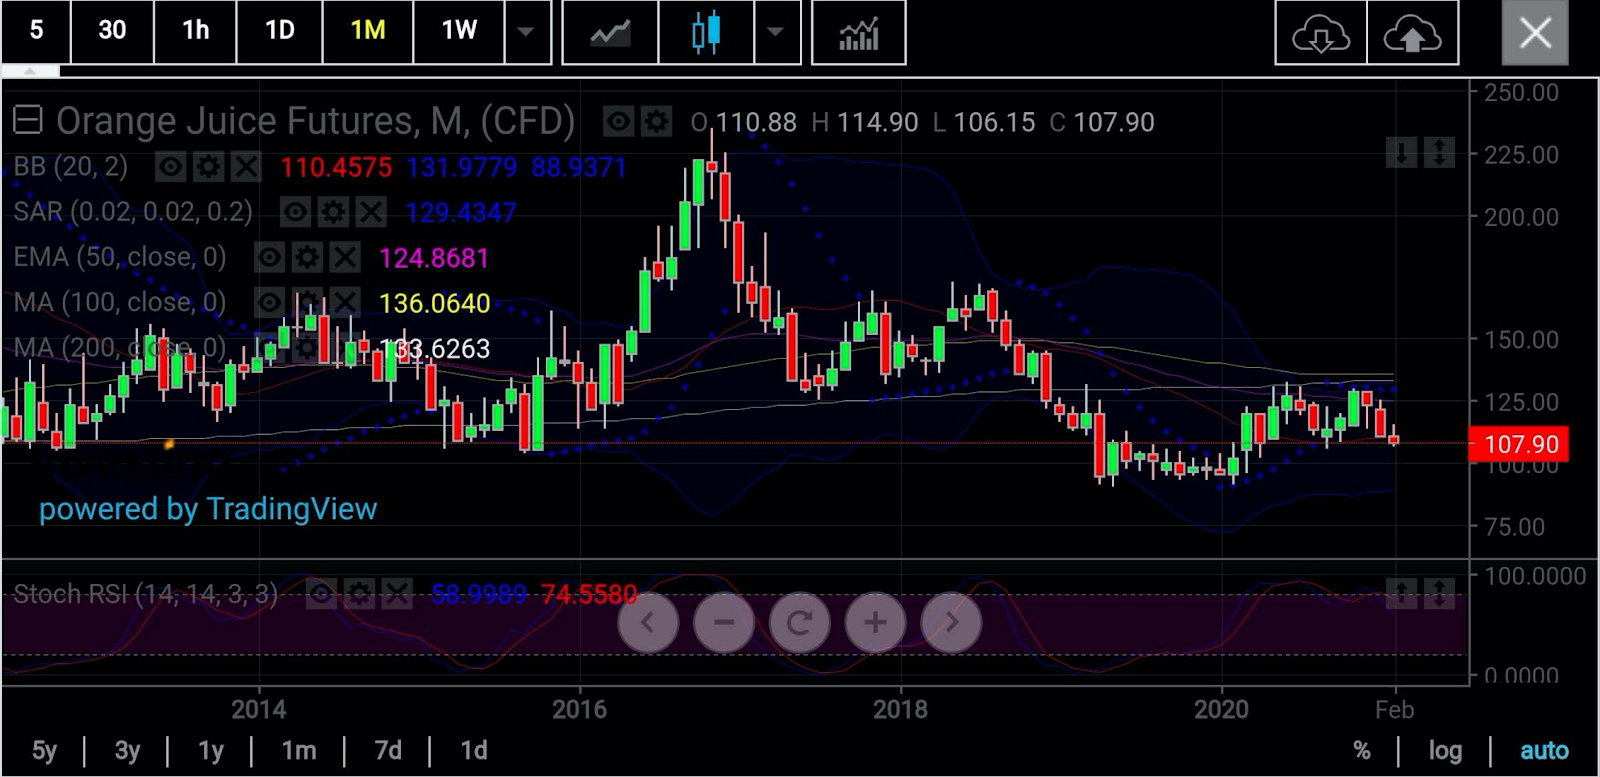
That set the market up for a decline of nearly 2.5% for February, and a cumulative 17% loss over three straight months since its 9% gain in November.
For this year itself, orange juice futures are down 12.7%, compared with a 27% gain in 2020.
That’s not all.
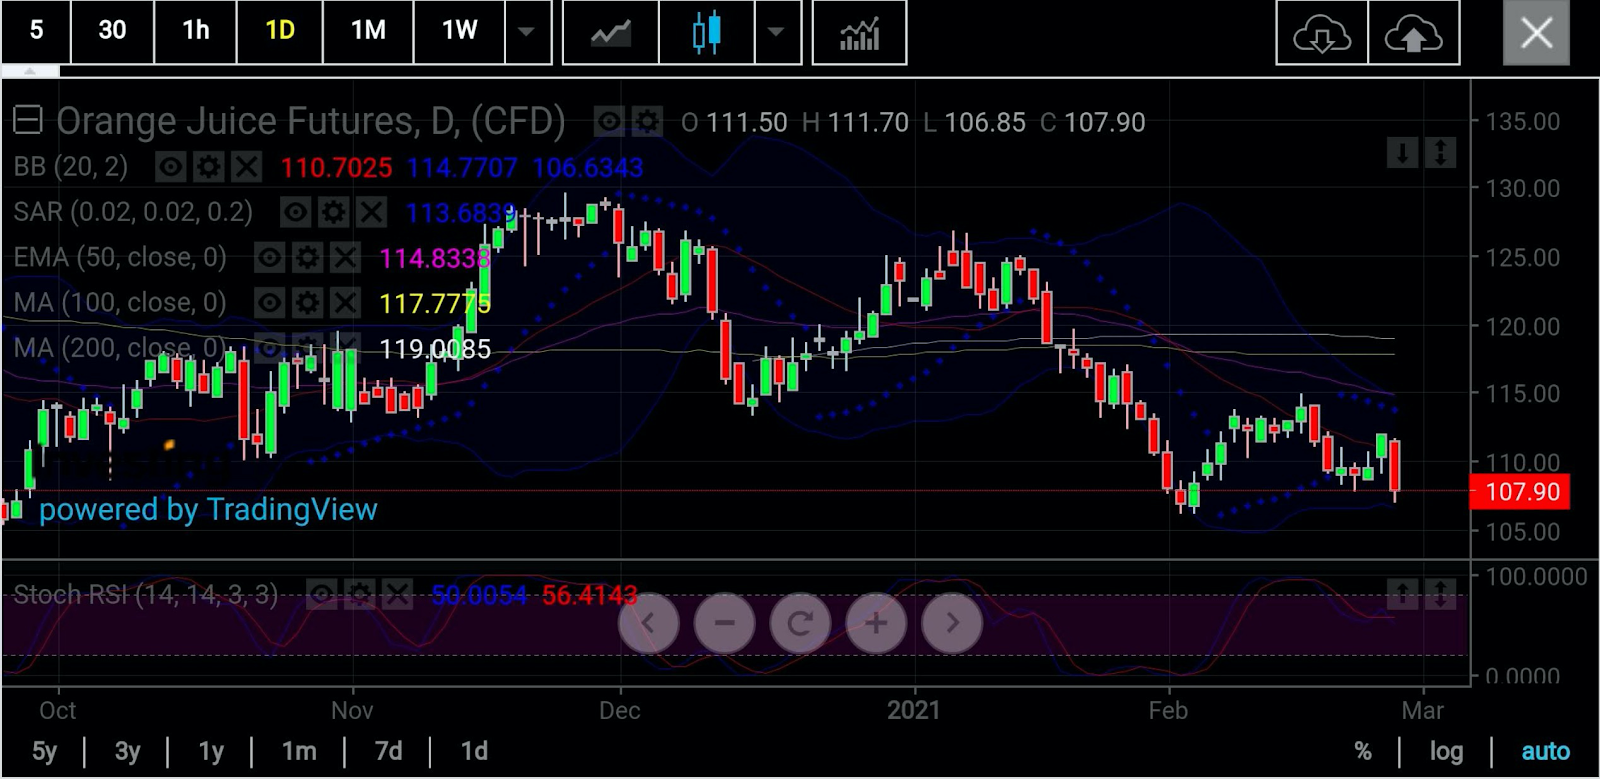
In Thursday’s session, March FCOJ hit a three-week low of $1.0685 a lb, before settling at $1.0758.
If it snaps the Feb. 3 low of $1.0615, it would mark an 11-month bottom for the benchmark juice contract, given that its previous trough was $1.02, hit in April.
Juice Futures Diverging With Demand On The Ground
The gloomy stats run contrary to trade publication reports about the encouraging growth in both orange grove yields and juice sales in Florida, the top citrus state in America.
Typically, when production spikes, a commodity’s price tends to fall.
But in the case of orange juice, the year is shaping up to be a busy one for both citrus growers and processors, Village Daily Sun, a trade publication, reported earlier this week.
Growth was not only in high crop orange yields and juice demands, but also interest from people ordering citrus online from growers that offered gift fruit shipping, it added.
Pete Spyke, who owns orange groves in Florida’s Weirsdale and Fort Pierce areas, told the publication that he was seeing higher yields of juice oranges like the Valencias, which are harvested around this time of year.
That’s good news for the orange juice industry, especially in a time of high demand, he said, adding:
“Everything is just good. More people are buying online, and the same is true in our business.”
Kris Sutton, another grower with Faryna Grove Care & Harvesting in Umatilla, Florida, said both crop yields and his business have been doing well. He added:
“Everything’s been up most parts, so as long as we can maintain the prices, we should be good to go.”
“More (fruit) is always better.”
Both Spyke and Sutton are optimistic about the reversal of declining orange juice demand and consumption in recent months, though they wish it came under more positive circumstances than the COVID-19 pandemic. Sutton said:
“I’m happy with the orange juice sales, but I wish it wasn’t a pandemic.”
The US Department of Agriculture, in its updated citrus forecast for February, estimates Florida orange production at 56 million boxes—an increase of 2 million boxes, or 4%, from the previous outlook issued in January.
More Speculators Could Be Getting In On Action
Jack Scoville, crop analyst at Chicago’s Price Futures Group, concurred that Florida’s weather and citrus planting conditions were good and FCOJ could still rebound on speculative activity that had been evident on ICE Futures US in recent days. He explained:
“Speculators appeared to be the best buyers and were buying in part on increasingly bullish chart formations. Futures are showing the potential for more price gains for the rest of the week.”

All charts courtesy of SK Dixit Charting
Commodity price forecaster gov.capital, using trade algorithms, forecast that FCOJ could trade between $1.2194 and $1.40226 by Mar. 26, a month from now.
The last time juice traded above $1.20 was on Jan. 13, when it hit $1.23. It got to above $1.40 in December 2018, when it traded as high as $1.44.

Sunil Kumar Dixit, technical analyst for commodities at SK Dixit Charting, said there were opportunities for FCOJ to break ground above $1.15, adding:
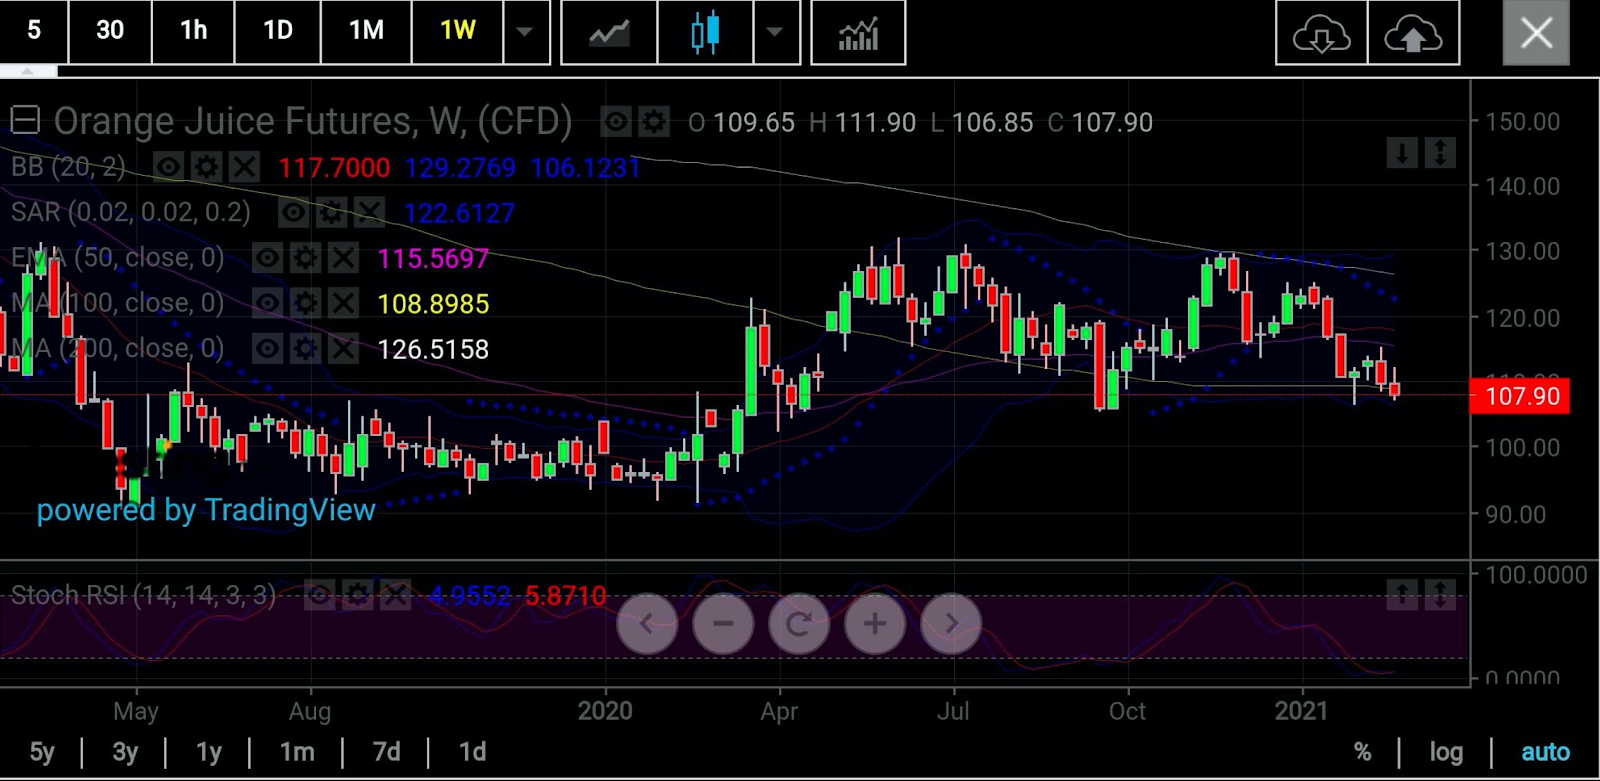
“OJ’s Stochastic Relative Strength Index is in oversold territory and a rebound is possible, subject to demand hike and supply crunch with prices building up above $1.09.”
“The weekly chart indicates reversal, conditioned by prices surviving above $1.09 and the 50-week Exponential Moving Average of $115.50.”

But Dixit also cautions that FCOJ’s daily chart suggests more weakness if prices break below $1.0685, that could lead to lower support areas of $1.053 and $1.040.
Disclaimer: Barani Krishnan uses a range of views outside his own to bring diversity to his analysis of any market. As an analyst for Investing.com he presents divergent views and market variables.
Comments are welcome and encouraged. Inappropriate comments will be reported and removed.
