United Homes Group stock plunges after Nikki Haley, directors resign
In recent weeks the US's key economic numbers have been providing optimistic signals that the country's recovery is not just on track but also accelerating. Last week's ISM manufacturing print beat expectations, as did this week's ISM non-manufacturing release. And since America's economy is the world's largest, that bodes well for industrial metals, a segment that's led by copper.
As well, US President Joseph Biden's massive, $2.5 million infrastructure plan should boost demand for the red metal and sister industrial commodities even further.
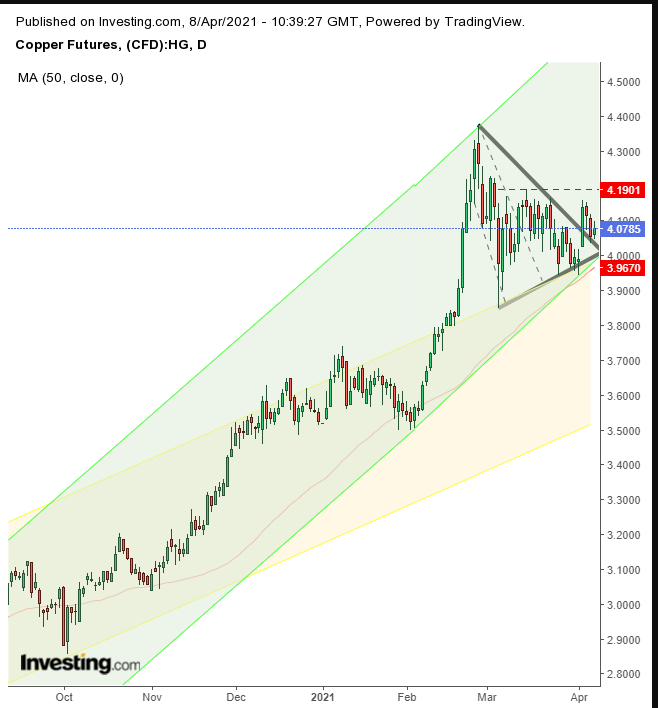
In mid-February, we gave copper a bullish call, forecasting that a failed H&S top would throw the metal's trend in the opposite direction, forcing investors to reverse positions. At that time, JPMorgan Chase had also predicted a new copper super cycle—an exceedingly long uptrend, which, on average can last about 25 years.
The technical chart for copper is signaling upperward momentum as well.

Copper added as much as 16% in as little as 10 sessions, till the Feb. 25 high. The price then fell from that peak by nearly 12%.
Almost a month later, on Mar. 10, we gave a second positive call, as the price appeared about to complete a bullish flag, which beautifully harmonized with the bottom of a new, steeper rising channel, precisely on top of the previous rising channel.
The flag provided an upside breakout, but instead of taking off, it ranged, until it retested the flag, which has so far held support. That was the period when markets initially became excited about the possibility of the first signs of inflation after 12 years. That theme was originally based on optimism that it would support an economic recovery. However the sentiment turned pessimistic as investors worried that rising prices would limit the expansion instead.
The inflation narrative had been flip-flopping since then, as the market remained confused about whether that meant the Fed didn’t want to own up to inflationary pressures which would trigger interest rate hikes by the central bank.
However, despite the apparent listlessness after the flag's completion during that period, a new pattern emerged—a symmetrical triangle. That's because the Fed succeeded in dispelling inflation risk fears, by underscoring that rising Treasury rates are nothing more than investors gearing up for economic growth, a healthy sign of confidence.
While the shape of the triangle suggests equal determination by both buyers and sellers, the fact that it's within a rising channel that's layered upon a previous rising channel, lends momentum for the underlying trajectory to continue higher.
And sure enough, on Monday, the price broke out. What’s more, when it fell back down, it found support precisely over it and has been rising since. Finally, the 50 DMA has been closely tracing the bottom of the second, steeper rising channel.
Trading Strategies
Conservative traders should wait for the price to register above the Mar. 15 high on a closing basis, then wait for a return move to retest the rising support of the pattern or the channel.
Moderate traders would wait for the price to overcome the 4.16 breakout high level, then wait for a pullback for a better entry, if not for reconfirmation of support.
Aggressive traders could go long at will, provided they understand and accept the higher risk that results from not waiting for further confirmation. It's the price to pay for being two steps ahead of the market. Employ a clear trading plan and commit to it.
Here’s an example of a basic trade plan:
Trade Sample
- Entry: $4.0700
- Stop-Loss: $4.0000
- Risk: $0.0700
- Target: $4.3500
- Reward: $0.2800
- Risk:Reward Ratio: 1:4
Author's Note: This is just a sample. There are different ways to approach this trade. You must find and learn your trading style, one that incorporates your timing, budget and temperament, and write trading plans accordingly. Till you learn how to do that, take small risks, just to develop that skill, not for profit, or you’ll achieve neither.
